Name
基于轨迹平均振幅的多时igkeit交易策略Gyroscopic-Bands-Strategy-Based-on-Multi-Time-Frame-and-Average-Amplitude
Author
ChaoZhang
Strategy Description
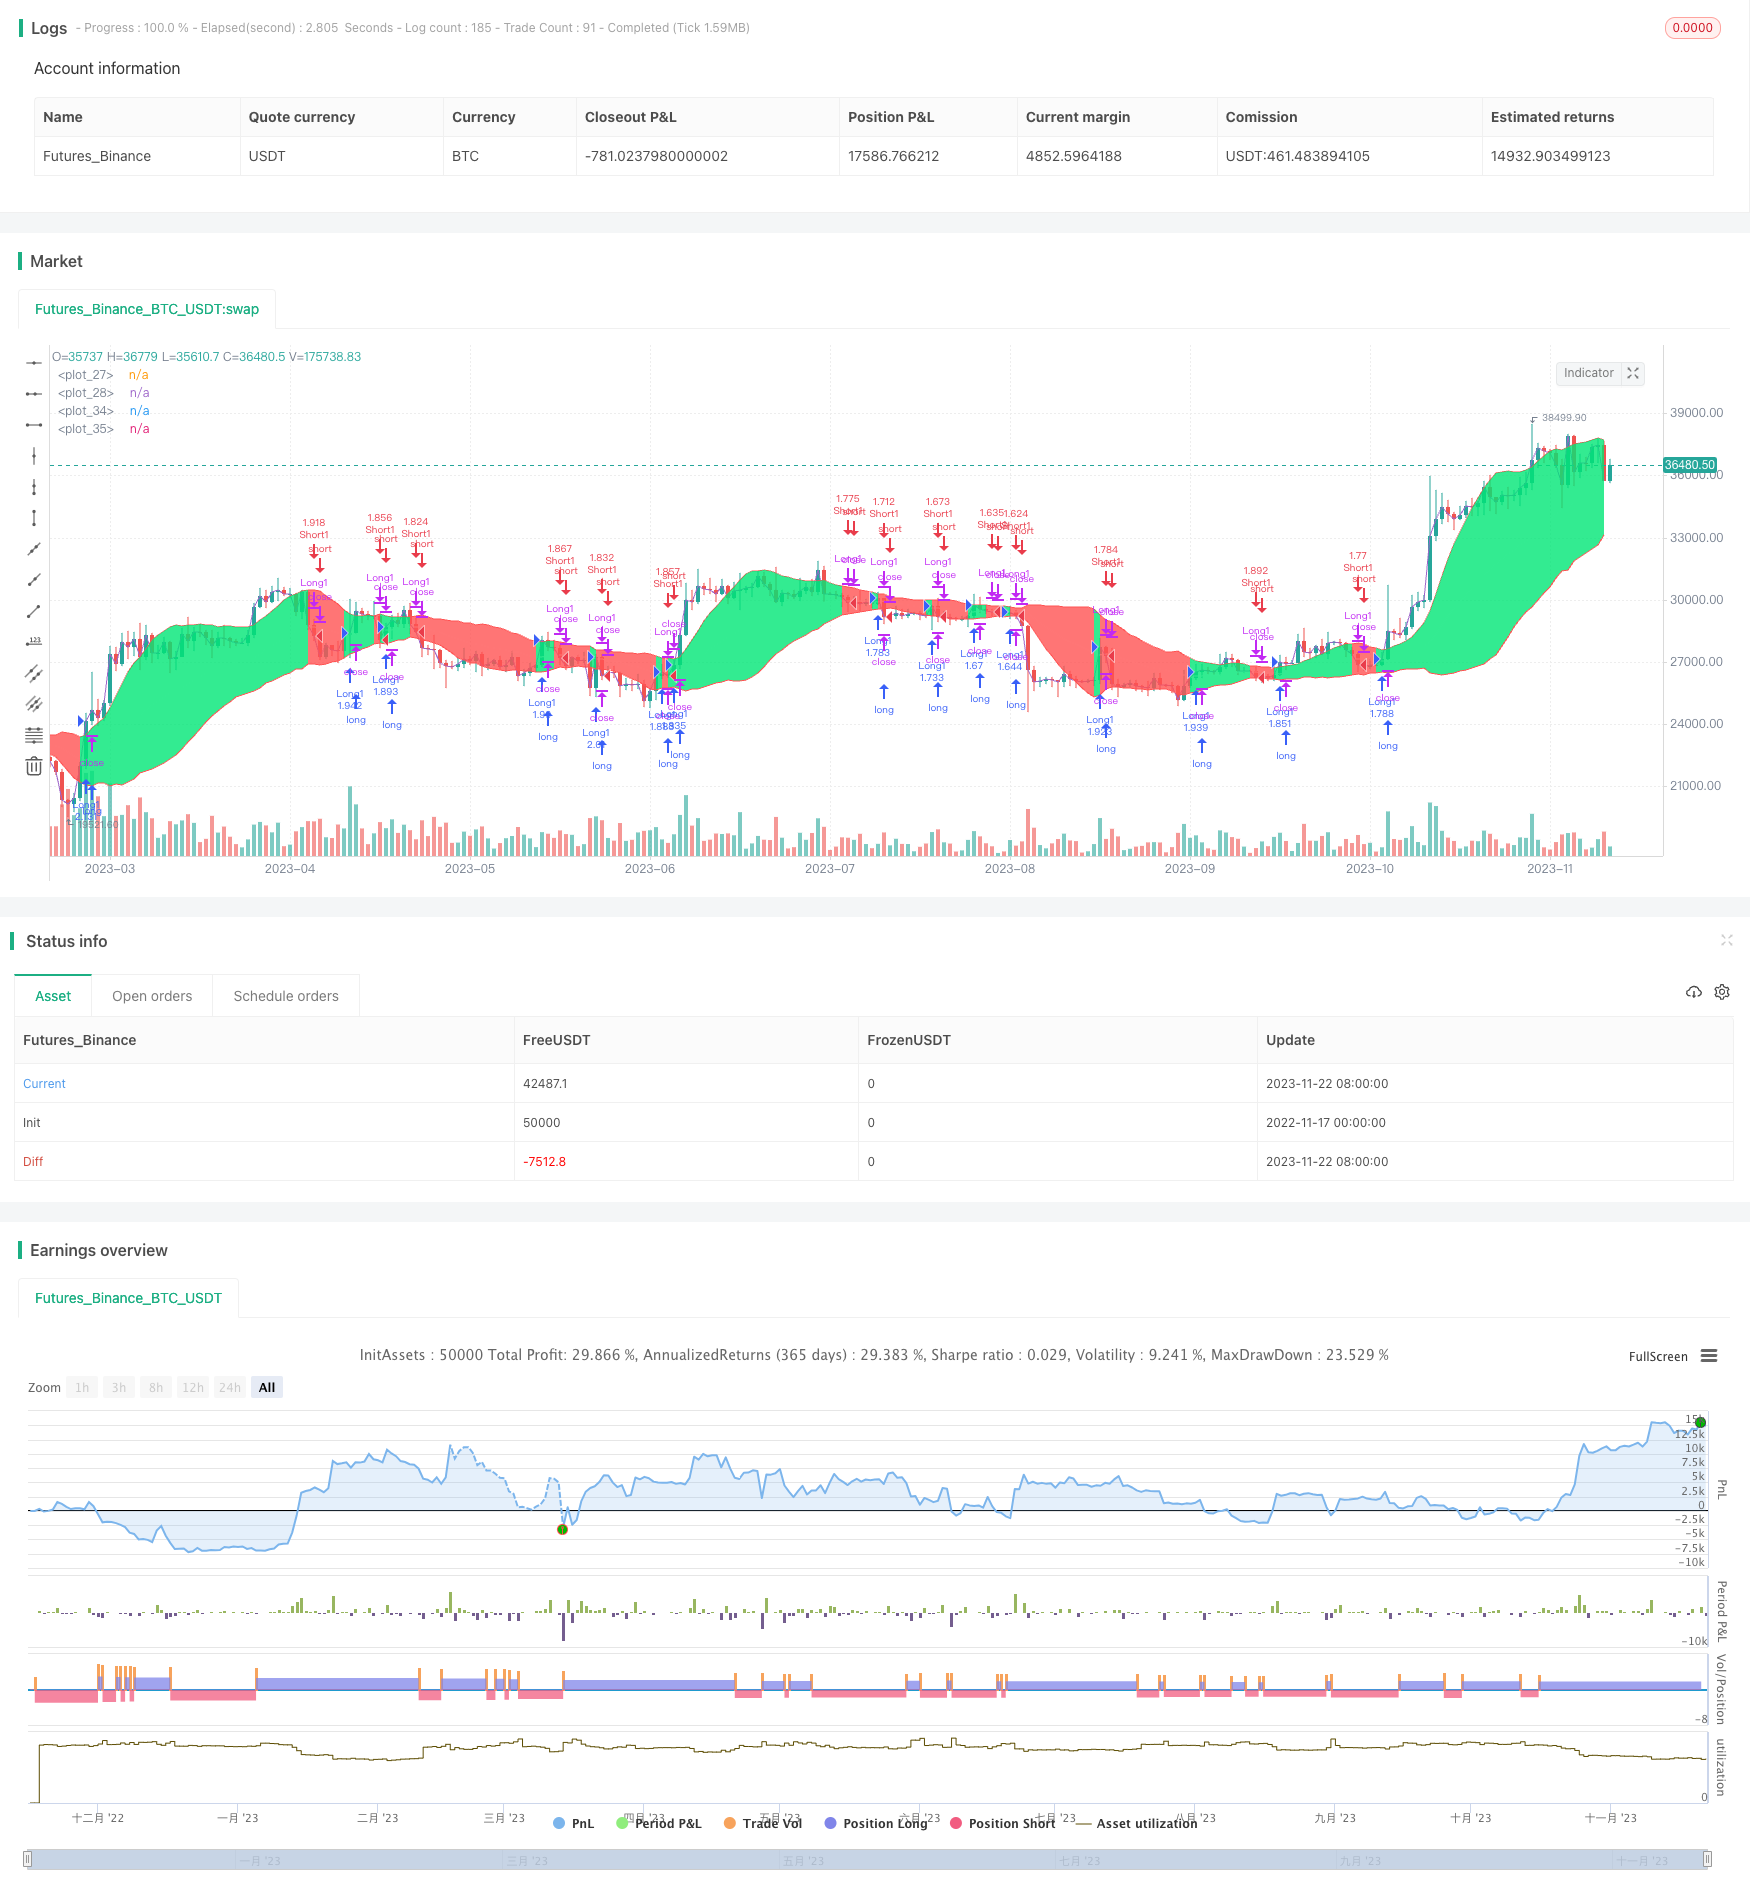
本策略名称为“基于轨迹平均振幅的多时间帧交易策略”。它的主要思想是通过引入一个拟合价格轨迹的粒子,基于粒子与价格之间的平均振幅来构建交易信号。
该策略首先定义了一个拟合价格轨迹的粒子。该粒子受引力和惯性的影响,其运动轨迹会围绕价格振荡。然后计算粒子与价格之间的平均偏离距离,并以此构建上下轨道。当价格突破上轨或下轨时,发出交易信号。
具体来说,策略中定义的粒子位置公式为:
pos:=if pos<close
     nz(pos[1])+grav+traj
else
     nz(pos[1])-(grav)+traj
这里grav代表引力项,使粒子向价格趋近;traj代表惯性项,使粒子保持运动趋势。这两个项结合使粒子围绕价格振荡。
然后计算价格与粒子之间的平均偏离距离avgdist,并以此构建上下轨道:
bbl=pos-sma(avgdist,varb)
bbh=pos+sma(avgdist,varb)
最后,当价格大于上轨时做多,小于下轨时做空。
相比传统的移动平均线策略,本策略有以下优势:
- 利用粒子轨迹更好地模拟价格波动;
- 上下轨道可基于历史平均振幅自适应调整,有利于捕捉突破;
- 多时间框架设计,可以在高低时间框架之间切换,捕捉更多交易机会。
本策略也存在一些风险:
- 粒子运动参数设置不当可能导致虚假信号或漏失信号;
- 多时间框架之间切换时可能出现信号冲突;
- 突破上下轨道信号可能会增加止损风险。
对应风险管理措施包括:优化参数以减少虚假信号,定义清晰的时间框架择时规则,设置适当的止损位置等。
本策略可从以下几个方面进行优化:
- 优化粒子运动相关参数,拟合价格轨迹;
- 增加时间框架的层数,在更高级时间框架确认信号;
- 加入波动率指标判断,避免在市场剧烈波动时产生信号;
- 优化止损策略,降低单笔止损。
本策略通过引入价格轨迹拟合的方式改进了移动平均线策略,具有参数自适应、多时间框架、止损优化等特点。其关键在于找到合适的粒子运动方程来模拟价格。虽然仍需进一步测试和优化,但基本思路是可行的,值得进一步研究。
||
This strategy is named "Gyroscopic Bands Strategy Based on Multi Time Frame and Average Amplitude". Its main idea is to construct trading signals based on the average amplitude between the price and a particle that fits the price trajectory.
The strategy first defines a particle that fits the price trajectory. Under the influence of gravity and inertia, the trajectory of the particle will oscillate around the price. Then we calculate the average deviation between the particle and the price, and use it to construct upper and lower bands. When the price breaks through the upper or lower band, trading signals are generated.
Specifically, the particle position formula defined in the strategy is:
pos:=if pos<close
     nz(pos[1])+grav+traj
else
     nz(pos[1])-(grav)+traj
Here grav represents the gravity term that makes the particle close to the price; traj represents the inertia term that keeps the particle's movement trend. The combination of these two items makes the particle oscillate around the price.
Then we calculate the average deviation avgdist between the price and the particle, and use it to construct upper and lower bands:
bbl=pos-sma(avgdist,varb)
bbh=pos+sma(avgdist,varb)
Finally, go long when the price is greater than the upper band, and go short when less than the lower band.
Compared with traditional moving average strategies, this strategy has the following advantages:
- Use particle trajectories to better simulate price fluctuations;
- The upper and lower bands can be adaptively adjusted based on historical average amplitude, which is conducive to capturing breakthroughs;
- Multi time frame design can switch between high and low time frames to capture more trading opportunities.
This strategy also has some risks:
- Improper parameter settings of particle motion may cause false signals or miss signals;
- Signal conflicts may occur when switching between multiple time frames;
- Breakthrough signals of upper and lower bands may increase stop loss risk.
Corresponding risk management measures include: optimizing parameters to reduce false signals, defining clear time frame timing rules, setting appropriate stop loss positions, etc.
This strategy can be optimized in the following aspects:
- Optimize particle motion related parameters to fit the price trajectory;
- Increase the number of time frame layers to confirm signals at higher time frames;
- Add volatility indicators to avoid signals during violent market fluctuations;
- Optimize stop loss strategies to reduce single stop loss.
This strategy improves the moving average strategy by introducing price trajectory fitting. It has features like adaptive parameters, multi time frames, stop loss optimization, etc. The key is to find a suitable particle motion equation to simulate the price. Although further testing and optimization is needed, the basic idea is feasible and worth further research.
[/trans]
Strategy Arguments
| Argument | Default | Description |
|---|---|---|
| v_input_1 | true | leverage |
| v_input_2 | 4 | variable a (10 to the power of __ |
| v_input_3 | 12 | variable b |
Source (PineScript)
/*backtest
start: 2022-11-17 00:00:00
end: 2023-11-23 00:00:00
period: 1d
basePeriod: 1h
exchanges: [{"eid":"Futures_Binance","currency":"BTC_USDT"}]
*/

//@version=4
//2 revert
strategy("Jomy's Gyroscopic Bands",precision=8,commission_value=.03,overlay=true,initial_capital =10000, default_qty_type=strategy.percent_of_equity, default_qty_value=100,  pyramiding=0)//,calc_on_order_fills= true, calc_on_every_tick=false)
leverage=input(1,"leverage")
a=0
a:= if volume > -1
    nz(a[1])+1
else
    nz(a)

vara=input(4.0,"variable a (10 to the power of __ ",step=.5)
vara:=pow(10,vara)
varb=input(12,"variable b")
pos=0.0
pos:=if a<=5
    close
else
    nz(pos[1])
grav=1/sqrt((close*close))*vara
traj=0.0
traj:=(nz(close[1])-nz(close[2])+nz(traj[1])*varb)/(varb+1)
pos:=if pos<close
    nz(pos[1])+grav+traj
else
    nz(pos[1])-(grav)+traj

plot(pos,color=color.white)
plot(close)

avgdist=abs(close-pos)
bbl=pos-sma(avgdist,varb)
bbh=pos+sma(avgdist,varb)

plbbh=plot(bbh,color=color.red)
plbbl=plot(bbl,color=color.red)

long = close>pos
short = close<pos

fill(plbbh,plbbl,color=long?color.lime:color.red)
//bgcolor(close>bbh?color.lime:close<bbl?color.red:na,transp=90)

strategy.entry("Long1",strategy.long,when=long,qty=(strategy.equity*leverage/open))
strategy.close("Long1",when=not long)
strategy.entry("Short1",strategy.short,when=short,qty=(strategy.equity*leverage/open))
strategy.close("Short1",when=not short)


//plot(strategy.equity,color=color.lime,linewidth=4)
Detail
https://www.fmz.com/strategy/433147
Last Modified
2023-11-24 17:29:39
