Name
基于量价指标的趋势反转策略Volume-Weighted-Trend-Reversal-Strategy
Author
ChaoZhang
Strategy Description
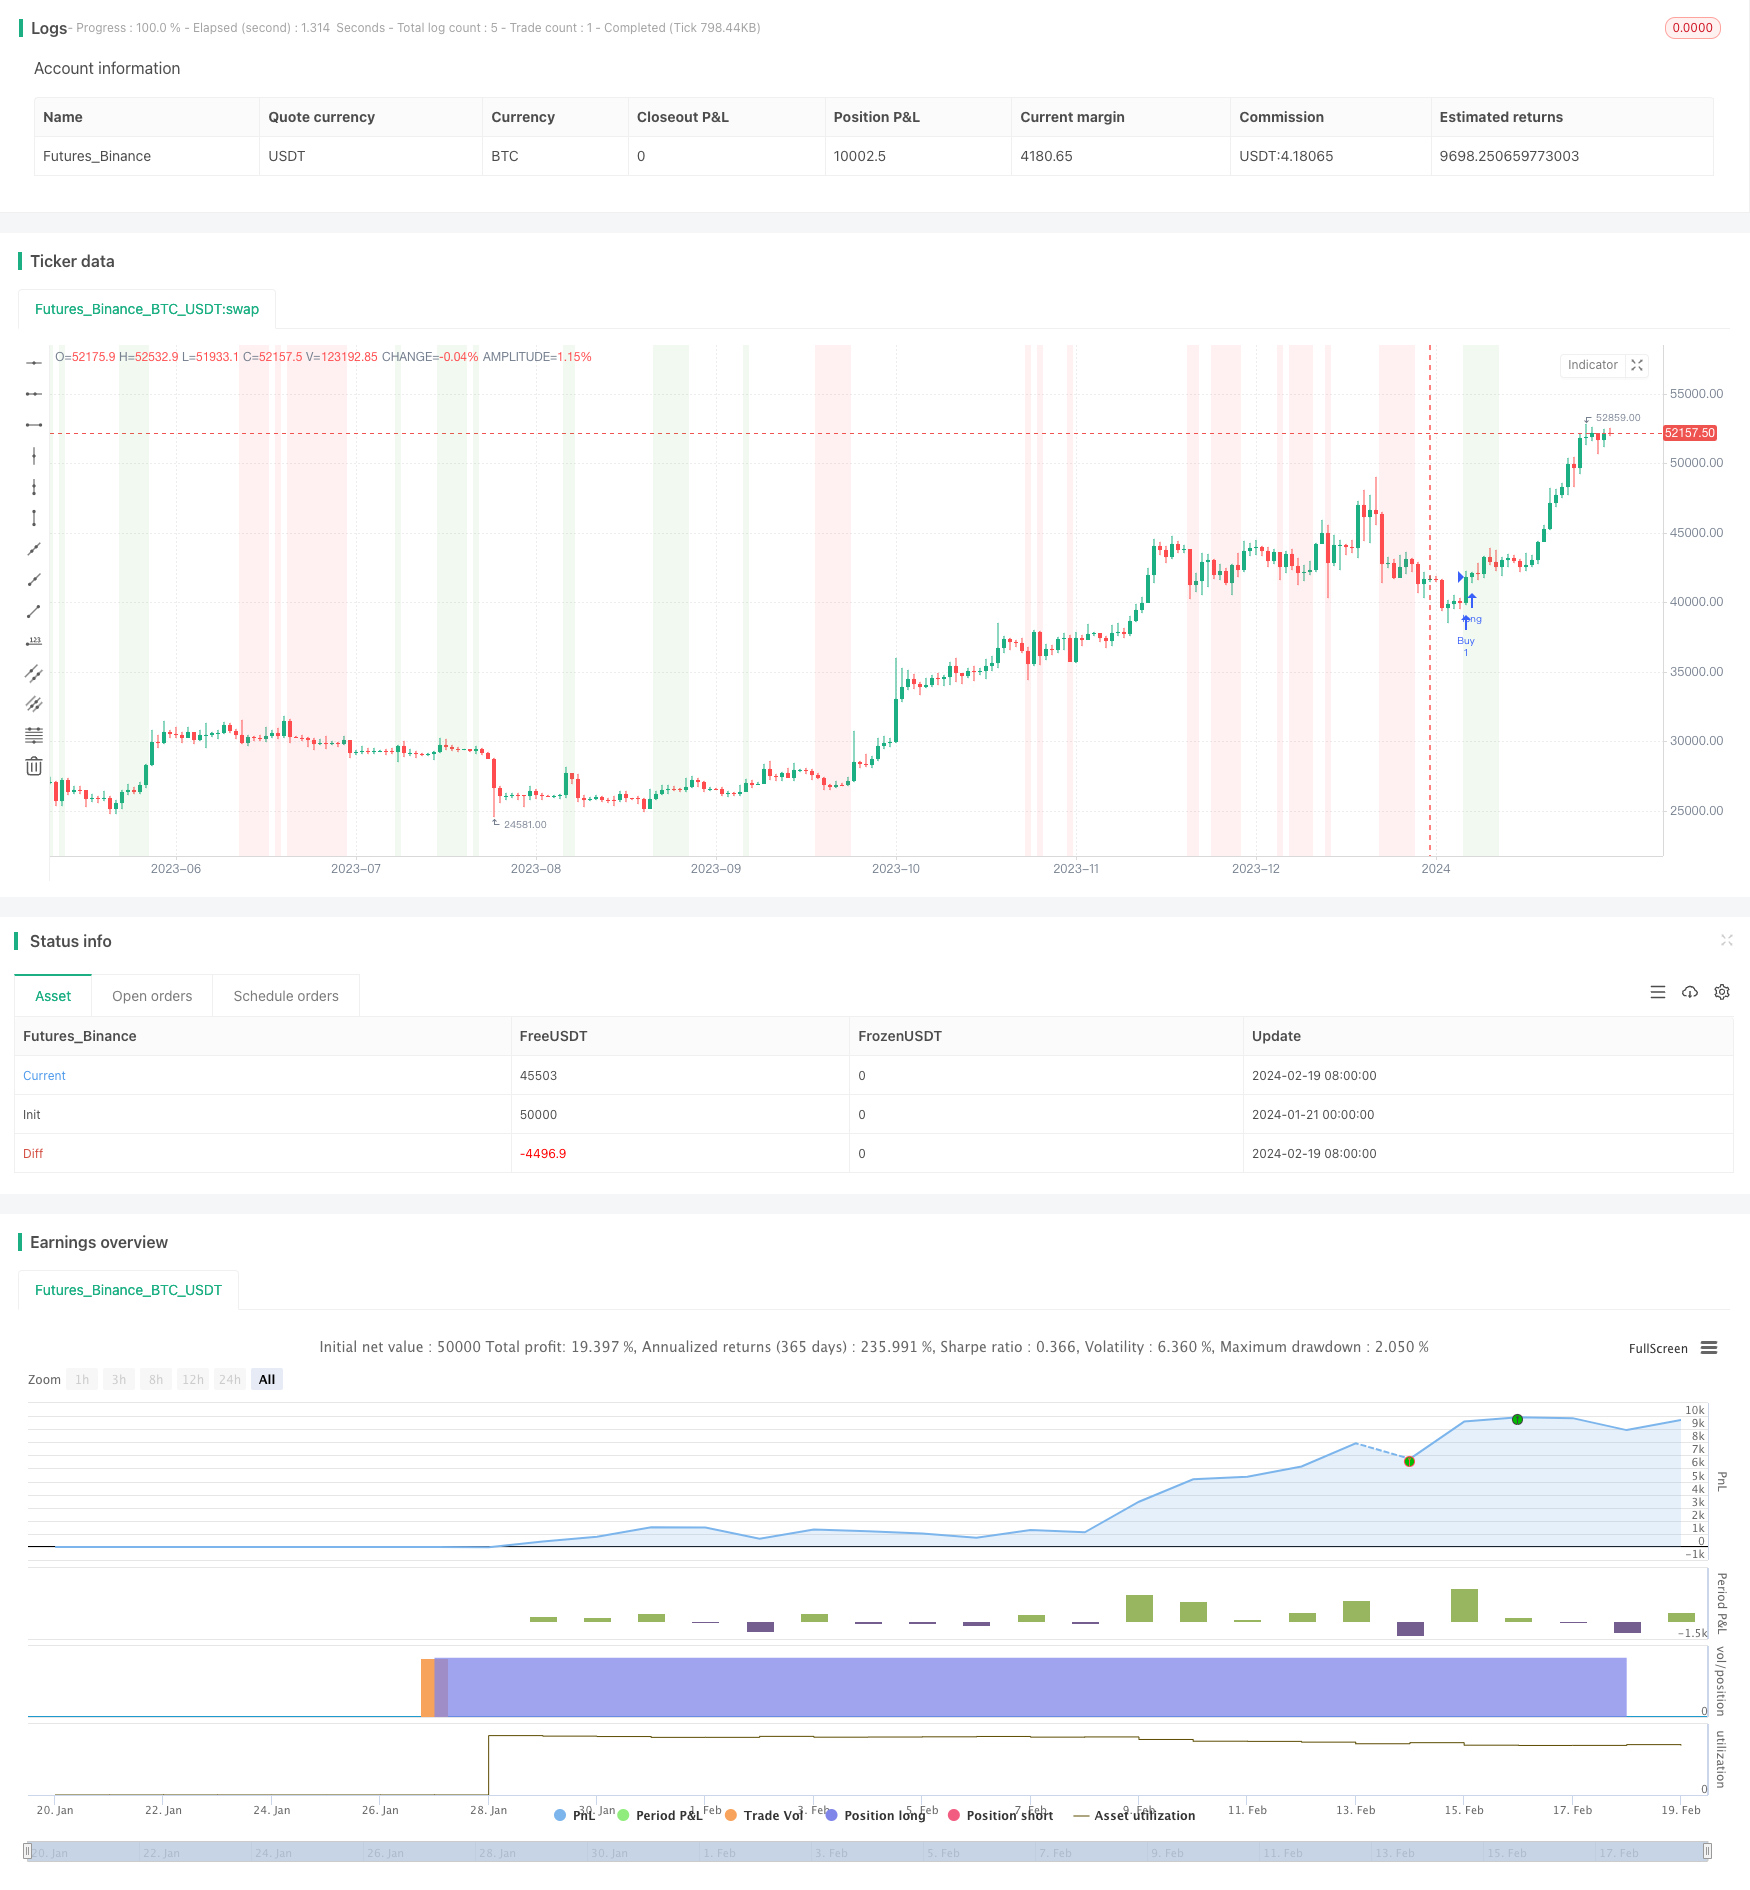
本策略名称为Volume Weighted Trend Reversal Strategy(基于量价指标的趋势反转策略)。该策略旨在识别潜在的趋势反转点,在价格偏离平均水平时获利。它组合使用成交量加权平均价格(VWAP)和定量定性估计修正(QQE Mod)指标来生成交易信号。
该策略使用两个指标:VWAP和QQE Mod。
VWAP代表成交量加权平均价格,它通过将一段时间内的收盘价与成交量相乘的总和除以同期间的成交量总和来计算。VWAP反映了资产在一段时间内的平均交易价格,根据成交量进行加权。
QQE Mod是定量定性估计指标的修正版本,它整合了相对强弱指标(RSI)和指数移动平均线(EMA)的元素。它有助于识别潜在的趋势反转点并评估趋势的强度。
当收盘价同时高于VWAP和QQE Mod的值时,会生成买入信号。这表示当价格高于平均水平并且QQE Mod显示出强势时,是一个潜在的买入机会。
当收盘价同时低于VWAP和QQE Mod的值时,会生成卖出信号。这表示当价格低于平均水平并且QQE Mod显示出弱势时,是一个潜在的卖出机会。
该策略通过这种组合使用VWAP和QQE Mod指标,目标是在价格出现反转时及时识别并获利。
该策略具有以下优势:
-
结合价格与成交量分析。VWAP指标根据成交量为价格设置权重,使分析更具参考价值。
-
区分趋势与随机波动。QQE Mod指标有助于判断价格波动是否为可持续趋势或仅为随机波动。
-
及时捕捉反转信号。两种指标的组合使用,可以在价格出现反转时尽早生成交易信号。
-
可自定义参数。指标参数可根据市场环境进行优化,适应不同周期和股票。
-
易于实施与回测。该策略可直接在TradingView中利用Pine Script编写,便于可视化与回测,也可转为MQL用于MT4/MT5自动交易。
尽管该策略设计严谨,但交易中依然存在一定风险,主要包括:
-
错误信号风险。像所有技术指标那样,VWAP和QQE也会生成错误信号,从而导致损失。
-
回撤风险。如果行情出现大幅震荡,会给账户带来回撤。可通过止损来控制风险。
-
过优化风险。在回测时可能会过度优化参数,使之对历史数据效果很好,但对未来数据不一定适用。
-
实盘与回测差异。实盘价格可能会与回测存在差异,从而导致策略效果变差。
-
自动交易风险。如果用于自动交易,还需要考虑服务器宕机、网络中断等技术风险。
该策略可从以下几个方向进行优化:
-
选择代理股票。比如选择更加活跃的股票,使VWAP和QQE Mod更准确。
-
调整参数。修改QQE 的长度、平滑周期和过滤周期参数,寻找最佳组合。
-
结合止损策略。设定合理的止损位置和移动止损策略,可以有效控制回撤。
-
考虑交易费用。将手续费和滑点等成本纳入回测和实盘,使策略测试更加准确。
-
增加过滤条件。比如考虑成交量突破、波动率指标等其他因素,减少错误信号。
基于量价指标的趋势反转策略通过结合VWAP和QQE Mod两个指标,目标识别价格趋势反转点。它兼顾了成交量和强弱指标分析,可以有效捕捉短期反转机会。该策略实施简单,通过参数优化可以适应不同市场环境,是一种值得考虑的选择。但交易中依然存在错误信号、回撤等风险,仍需进行严谨的回测与风险控制。
||
This strategy is named Volume Weighted Trend Reversal Strategy. It aims to identify potential trend reversal points and profit when prices deviate from average levels. It combines the Volume Weighted Average Price (VWAP) and Quantitative Qualitative Estimation Modified (QQE Mod) indicators to generate trading signals.
The strategy utilizes two indicators: VWAP and QQE Mod.
VWAP stands for Volume Weighted Average Price. It calculates the average price of an asset over a timeframe, weighted by volume.
QQE Mod is a modified version of the Quantitative Qualitative Estimation indicator, incorporating elements of Relative Strength Index (RSI) and Exponential Moving Averages (EMA). It helps identify potential trend reversals and assess the strength of a trend.
A buy signal is generated when the closing price is above both VWAP and QQE Mod values. This indicates a potential buying opportunity when price is higher than average and shows strength according to QQE Mod.
A sell signal is generated when the closing price is below both VWAP and QQE Mod values. This indicates a potential selling opportunity when price is lower than average and shows weakness according to QQE Mod.
By combining VWAP and QQE Mod, the strategy aims to timely identify and profit from trend reversals as prices bounce off from extreme levels.
The advantages of this strategy include:
-
Combines price and volume analysis. VWAP weights prices according to volume, making the analysis more meaningful.
-
Distinguishes trends and random fluctuations. QQE Mod helps assess if price moves are sustainable trends or just random noise.
-
Timely signals on reversals. The combination generates early signals when prices start to reverse.
-
Customizable parameters. Indicator inputs can be optimized for different markets and timeframes.
-
Easy backtesting and implementation. The strategy can be directly written in Pine Script for TradingView, or converted to MQL for MT4/MT5 automated trading.
Despite sound logic, trading risks still exist including:
-
Whipsaw risk. Like all indicators, VWAP and QQE can generate false signals resulting in losses.
-
Drawdown risk. Significant volatility could lead to portfolio drawdowns. Risk can be controlled via stop losses.
-
Overfitting risk. Parameters maybe over-optimized to historical data but fail on out-of-sample data.
-
Backtest vs live performance deviation. Actual performance may differ from backtested results.
-
Automated trading risks. Additional risks from server outages, network errors etc if used for automated trading.
The strategy can be improved in several aspects:
-
Choose appropriate stocks. More liquid stocks may give better VWAP and QQE signals.
-
Adjust parameters. Optimize QQE input values for ideal performance.
-
Incorporate stop loss. Reasonable stop loss levels and trailing stops help control risk.
-
Account for trading costs. Include commissions and slippage to make simulations more realistic.
-
Add filters. Additional filters on volume breakouts or volatility may reduce false signals.
The Volume Weighted Trend Reversal Strategy combines VWAP and QQE Mod to identify potential turning points in price trends. It incorporates both volume and momentum analysis to capture short-term reversals. Simple to implement, it can be optimized across market conditions and remains a viable option for traders. Nonetheless risks from whipsaws and drawdowns persist, necessitating prudent backtesting and risk control.
[/trans]
Strategy Arguments
| Argument | Default | Description |
|---|---|---|
| v_input_1 | 14 | QQE Length |
| v_input_2 | 5 | QQE Smoothing |
| v_input_3 | 5 | QQE Filter Length |
Source (PineScript)
/*backtest
start: 2024-01-21 00:00:00
end: 2024-02-20 00:00:00
period: 1d
basePeriod: 1h
exchanges: [{"eid":"Futures_Binance","currency":"BTC_USDT"}]
*/

//@version=5
strategy("VWAP and QQE Mod Strategy", overlay=true)

// Input parameters
length = input(14, title="QQE Length")
m = input(5, title="QQE Smoothing")
filterLength = input(5, title="QQE Filter Length")

// Calculate VWAP
vwapValue = ta.sma(close * volume, length) / ta.sma(volume, length)

// Calculate QQE Mod indicator
qqeMod(source, length, m, filterLength) =>
    emaSource = ta.ema(source, length)
    rsiValue = ta.rsi(source, length)
    var float j = na
    j := (1.0 - 1.0 / m) * nz(j[1]) + 1.0 / m * (rsiValue - 50)
    upperBand = emaSource + filterLength * ta.stdev(source - emaSource, length)
    lowerBand = emaSource - filterLength * ta.stdev(source - emaSource, length)
    qqeModValue = j > 0 ? upperBand : lowerBand
    [qqeModValue, upperBand, lowerBand]

[qqeModValue, upperBand, lowerBand] = qqeMod(close, length, m, filterLength)

// Generate trading signals
buySignal = close > vwapValue and close > qqeModValue
sellSignal = close < vwapValue and close < qqeModValue

// Plot signals on the chart
bgcolor(buySignal ? color.new(color.green, 90) : na)
bgcolor(sellSignal ? color.new(color.red, 90) : na)

// Print trading signals
strategy.entry("Buy", strategy.long, when=buySignal)
strategy.entry("Sell", strategy.short, when=sellSignal)
Detail
https://www.fmz.com/strategy/442386
Last Modified
2024-02-21 15:04:34
