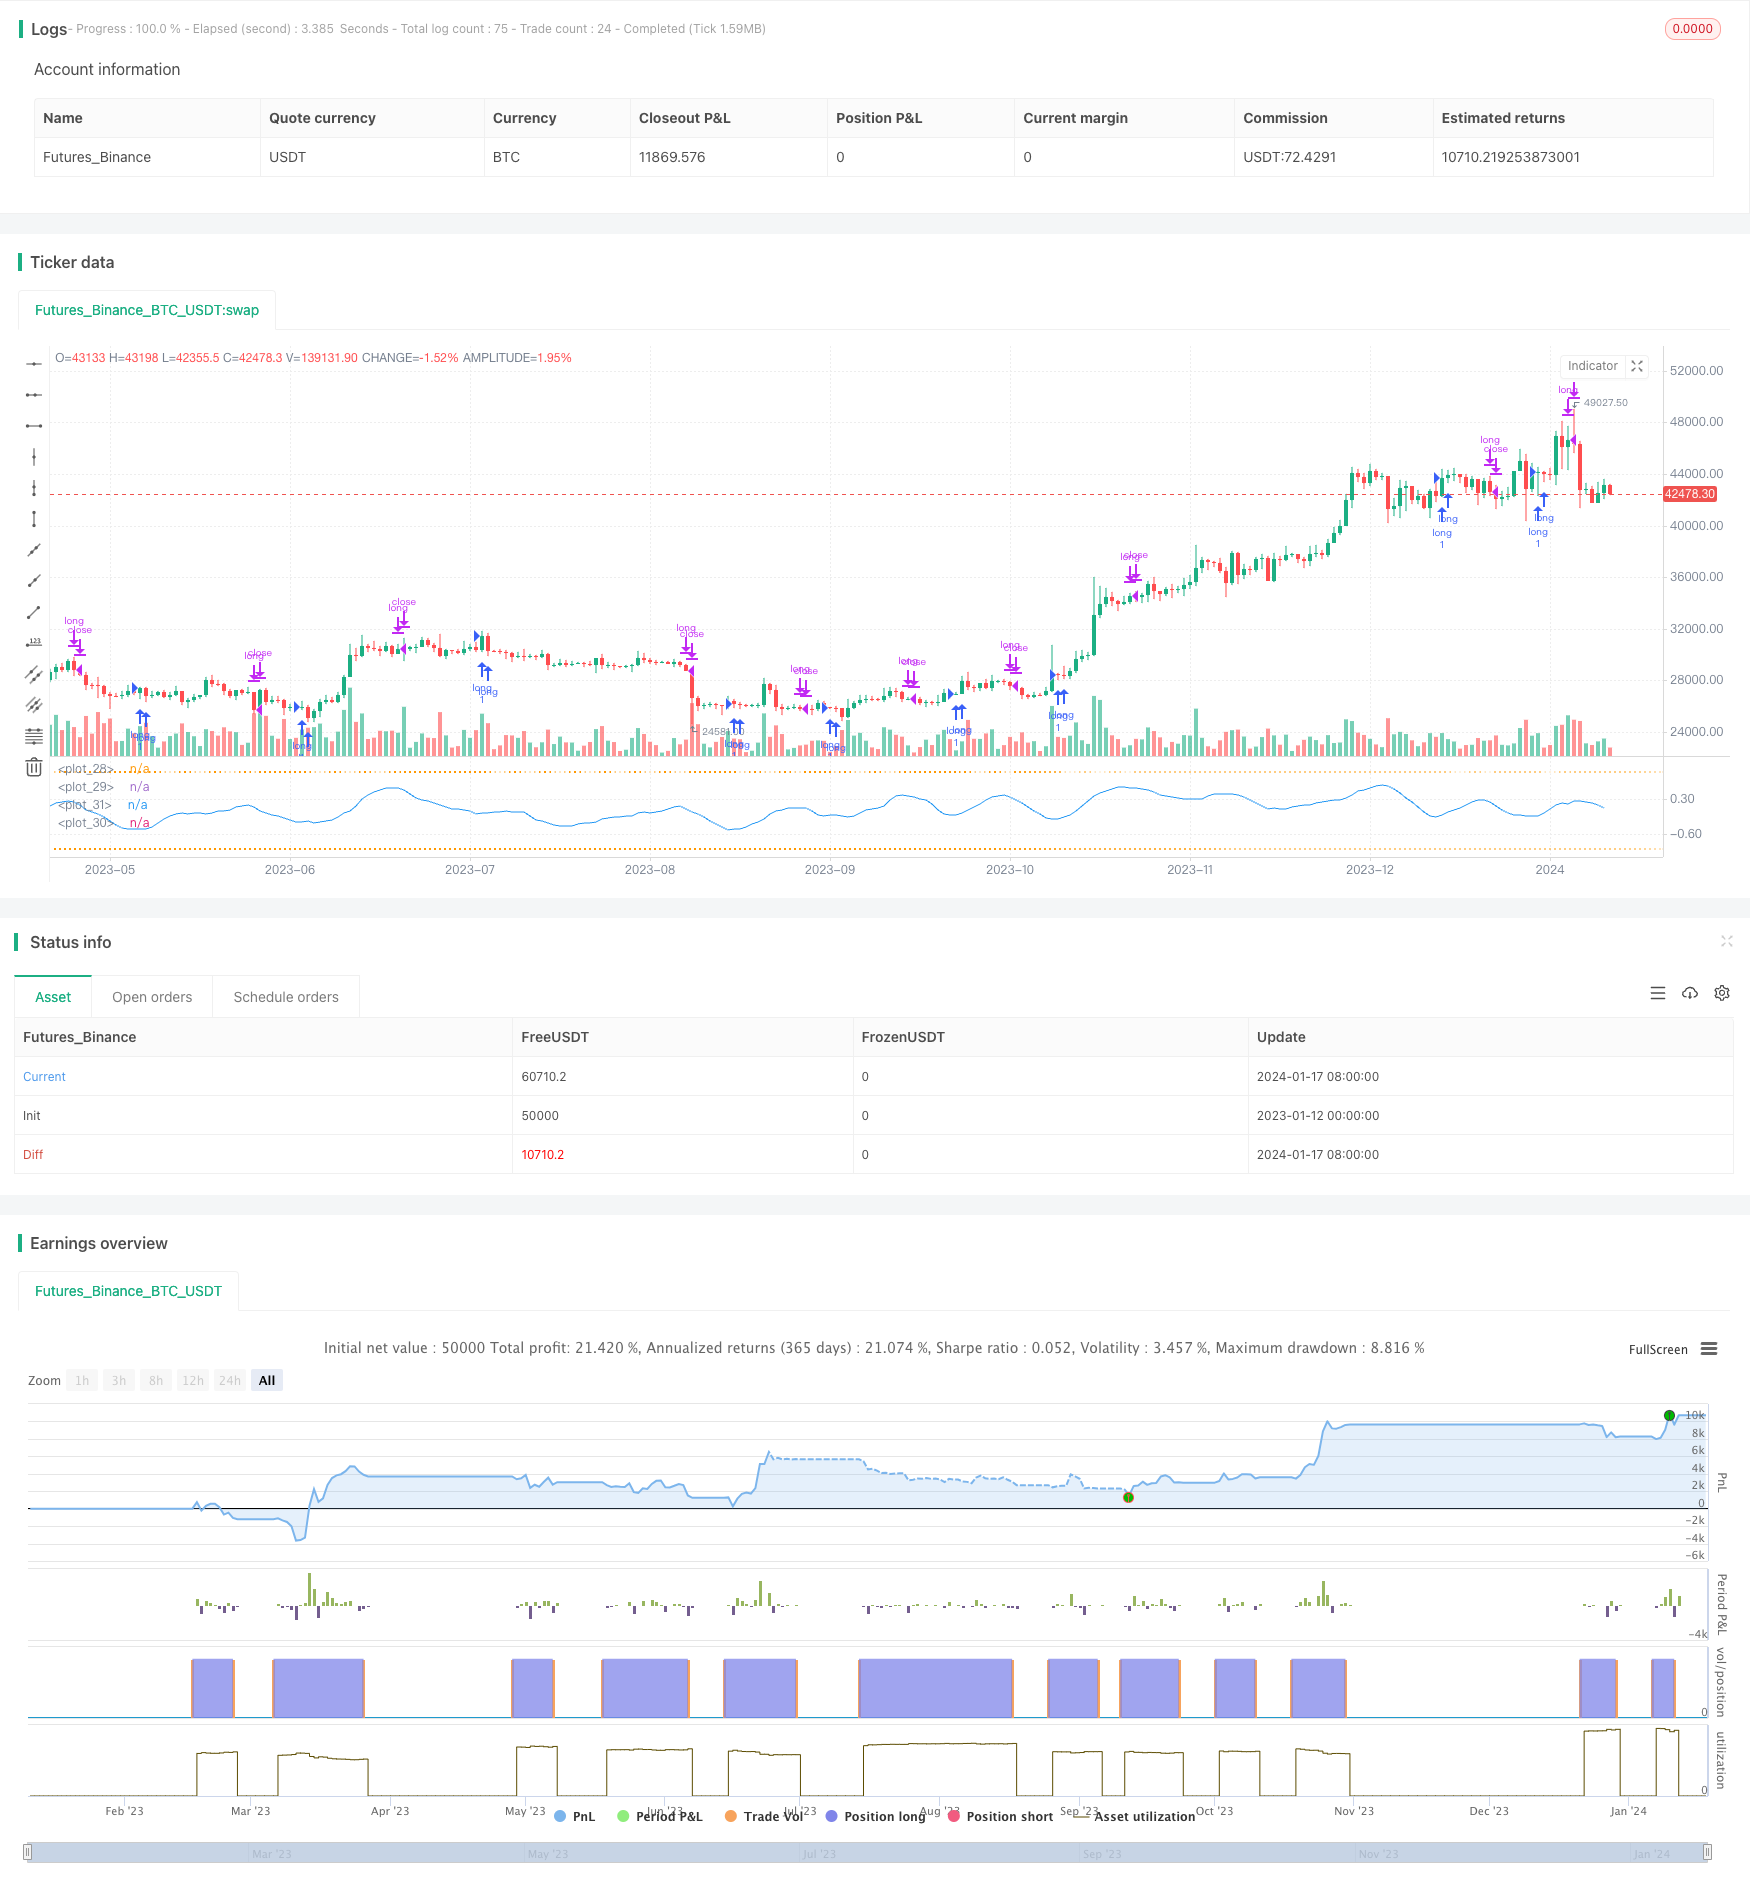
Name
基于高斯误差函数的量化交易策略An-Analysis-of-Quantitative-Trading-Strategy-Based-on-Gaussian-Error-Function
Author
ChaoZhang
Strategy Description
[trans]
该策略是一个基于高斯误差函数来计算价格变化的P-Signal指标的量化交易策略。它使用P-Signal指标判断价格趋势和转折点,以此来决定入场和退出的时机。
该策略的核心指标是P-Signal。P-Signal的计算公式如下:
fPSignal(ser, int) =>
    nStDev = stdev(ser, int)
    nSma = sma(ser, int)
    fErf(nStDev > 0 ? nSma/nStDev/sqrt(2) : 1.0)
这里ser代表价格序列,int代表参数nPoints,也就是看多少根K线。该公式由三部分组成:
- nStDev是价格的标准差;
- nSma是价格的简单移动平均;
- fErf是高斯误差函数。
整个公式的意思是,用价格的移动平均除以价格的标准差,再除以sqrt(2)做标准化,然后通过高斯误差函数映射到(-1, 1)区间。也就是如果价格波动大于平均值,P-Signal接近1;如果价格波动小于平均值,P-Signal接近-1。
策略使用P-Signal的数值和其变化的符号来决定入场和退出:
strategy.entry("long", strategy.long, 1, when = nPSignal < 0 and ndPSignal > 0)

strategy.close("long", when = nPSignal > 0 and ndPSignal < 0)
当P-Signal小于0且变化为正的时候做多;当P-Signal大于0且变化为负的时候平仓。
该策略具有以下优势:
- 使用高斯误差函数拟合价格分布。高斯误差函数能很好地拟合正常分布,这与大多数金融时间序列分布特征相符。
- 利用价格的标准差自动调整参数。这使得策略参数范围更广,对市场变化更加鲁棒。
- P-Signal指标结合趋势和反转Trade的优点。它既考虑价格波动趋势,也关注价格反转点,这对捕捉趋势交易和反转交易机会都有帮助。
该策略也存在一些风险,主要体现在:
- 高频交易风险。该策略是典型的高频交易策略,会产生较多交易,承担更高的交易成本和滑点风险。
- 震荡行情下表现不佳。P-Signal指标在价格没有明显趋势和规律的市场中,会产生大量虚假信号。
- 参数优化有难度。公式中多个参数之间关系复杂,使参数优化比较困难。
为降低这些风险,可以考虑增加过滤条件,减少交易频率;优化参数组合和交易成本设定;实盘磨合,选择合适品种。
该策略还有进一步优化的空间,主要方向有:
- 增加过滤条件,避免虚假信号。例如结合其他指标,做AND或OR条件,过滤掉一部分Noise。
- 优化参数组合。在不同品种和周期调整nPoints的大小,改进策略稳定性。
- 考虑动态参数。让nPoints参数根据市场波动程度做自适应调整,这可能改善策略鲁棒性。
- 结合机器学习方法。使用AI算法对参数、过滤条件以及多品种择时进行优化。
整体来说,该策略核心思路新颖,利用高斯函数拟合价格分布,自动调整参数范畴。但作为一个高频交易策略,还需要进一步的测试和优化,特别是风险控制和参数调整方面,才能在实盘中稳定盈利。
||
This strategy is a quantitative trading strategy based on P-Signal indicator calculated by Gaussian error function to measure price changes. It uses P-Signal to determine price trend and turning points for entries and exits.
The core indicator of this strategy is P-Signal. The calculation formula of P-Signal is:
fPSignal(ser, int) =>
    nStDev = stdev(ser, int)
    nSma = sma(ser, int)
    fErf(nStDev > 0 ? nSma/nStDev/sqrt(2) : 1.0)
Here ser represents the price series, int represents the parameter nPoints, which is the number of bars to look back. This formula consists of three parts:
- nStDev is the standard deviation of price;
- nSma is the simple moving average of price;
- fErf is the Gaussian error function.
The meaning of the whole formula is to take the moving average of price divided by the standard deviation of price, then divided by sqrt(2) for standardization, and finally mapped to (-1, 1) range by the Gaussian error function. That is, if the price fluctuation is greater than the average, P-Signal is close to 1; if the price fluctuation is less than the average, P-Signal is close to -1.
The strategy uses the value of P-Signal and the sign of its change to determine entries and exits:
strategy.entry("long", strategy.long, 1, when = nPSignal < 0 and ndPSignal > 0)

strategy.close("long", when = nPSignal > 0 and ndPSignal < 0)
It goes long when P-Signal is less than 0 and change to positive. It closes position when P-Signal is greater than 0 and change to negative.
The advantages of this strategy include:
- Using Gaussian error function to fit price distribution. Gaussian error function can fit normal distribution very well, which is in line with most financial time series distributions.
- Automatically adjusting parameters by standard deviation of price. This makes the strategy more robust across different market conditions.
- P-Signal combines the advantages of trend following and mean reversion. It considers both price fluctuation trend and reversal points, which helps capturing opportunities in both trend trading and reversal trading.
There are also some risks with this strategy:
- High frequency trading risk. As a typical high frequency trading strategy, it may generate more trades, thus bearing higher transaction costs and slippage risks.
- Underperformance in ranging markets. P-Signal may produce many false signals when price has no clear trend or pattern.
- Difficult parameter optimization. Complex relationship between multiple parameters makes parameter optimization challenging.
To reduce those risks, some measures can be taken into consideration: adding filters to reduce trade frequency; optimizing parameter combination and transaction costs setting; live testing and choosing suitable products.
There is room for further enhancement:
- Adding filters to avoid false signals, eg. AND/OR with other indicators to filter out some noise.
- Optimizing parameter combination. Adjusting the size of nPoints across different products and timeframes to improve stability.
- Considering dynamic parameters. Adaptively adjusting nPoints according to market volatility may improve robustness.
- Incorporating machine learning methods. Using AI algorithms on parameters, filters and cross-product timing optimization.
In conclusion, the core idea of this strategy is innovative, fitting price distribution with Gaussian function and automatically adjusting parameters. But as a high frequency trading strategy, it requires further testing and optimization on risk control and parameter tuning before stable profitability in live trading, especially as a high frequency trading strategy.
[/trans]
Strategy Arguments
| Argument | Default | Description |
|---|---|---|
| v_input_1 | 9 | (?Parameters of observation.)Number of Bars |
Source (PineScript)
/*backtest
start: 2023-01-12 00:00:00
end: 2024-01-18 00:00:00
period: 1d
basePeriod: 1h
exchanges: [{"eid":"Futures_Binance","currency":"BTC_USDT"}]
*/

// **********************************************************************************************************
// This source code is subject to the terms of the Mozilla Public License 2.0 at https://mozilla.org/MPL/2.0/
// P-Signal Strategy © Kharevsky
// @version=4
// **********************************************************************************************************
strategy("P-Signal Strategy", precision = 3)
// Parameters and const of P-Signal.
nPoints = input(title = "Number of Bars", type = input.integer, defval = 9, minval = 4, maxval = 100, group = "Parameters of observation.")
int nIntr = nPoints - 1
// Horner's method for the error (Gauss) & P-Signal functions.
fErf(x) =>
    nT = 1.0/(1.0 + 0.5*abs(x))
    nAns = 1.0 - nT*exp(-x*x - 1.26551223 +
     nT*( 1.00002368 + nT*( 0.37409196 + nT*( 0.09678418 +
     nT*(-0.18628806 + nT*( 0.27886807 + nT*(-1.13520398 +
     nT*( 1.48851587 + nT*(-0.82215223 + nT*( 0.17087277 ))))))))))
    x >= 0 ? nAns : -nAns
fPSignal(ser, int) =>
    nStDev = stdev(ser, int)
    nSma = sma(ser, int)
    fErf(nStDev > 0 ? nSma/nStDev/sqrt(2) : 1.0)
// Strat.
float nPSignal = sma(fPSignal(change(ohlc4), nIntr), nIntr)
float ndPSignal = sign(nPSignal[0] - nPSignal[1])
strategy.entry("long", strategy.long, 1, when = nPSignal < 0 and ndPSignal > 0)
strategy.close("long", when = nPSignal > 0 and ndPSignal < 0)
// Plotting.
hline(+1.0, color = color.new(color.orange,70), linestyle = hline.style_dotted)
hline(-1.0, color = color.new(color.orange,70), linestyle = hline.style_dotted)
plot(nPSignal, color = color.blue, style = plot.style_line)
plot(strategy.position_size, color = color.white, style = plot.style_cross)
// Alerts.
if(strategy.position_size[0] > strategy.position_size[1])
    alert("P-Signal strategy opened the long position: " + syminfo.tickerid + " " + timeframe.period, alert.freq_once_per_bar)
if(strategy.position_size[0] < strategy.position_size[1])
    alert("P-Signal strategy closed the long position: " + syminfo.tickerid + " " + timeframe.period, alert.freq_once_per_bar)
// The end.
Detail
https://www.fmz.com/strategy/439348
Last Modified
2024-01-19 14:28:03
