Name
基于ADX指标的原油趋势跟踪策略Crude-Oil-ADX-Trend-Following-Strategy
Author
ChaoZhang
Strategy Description
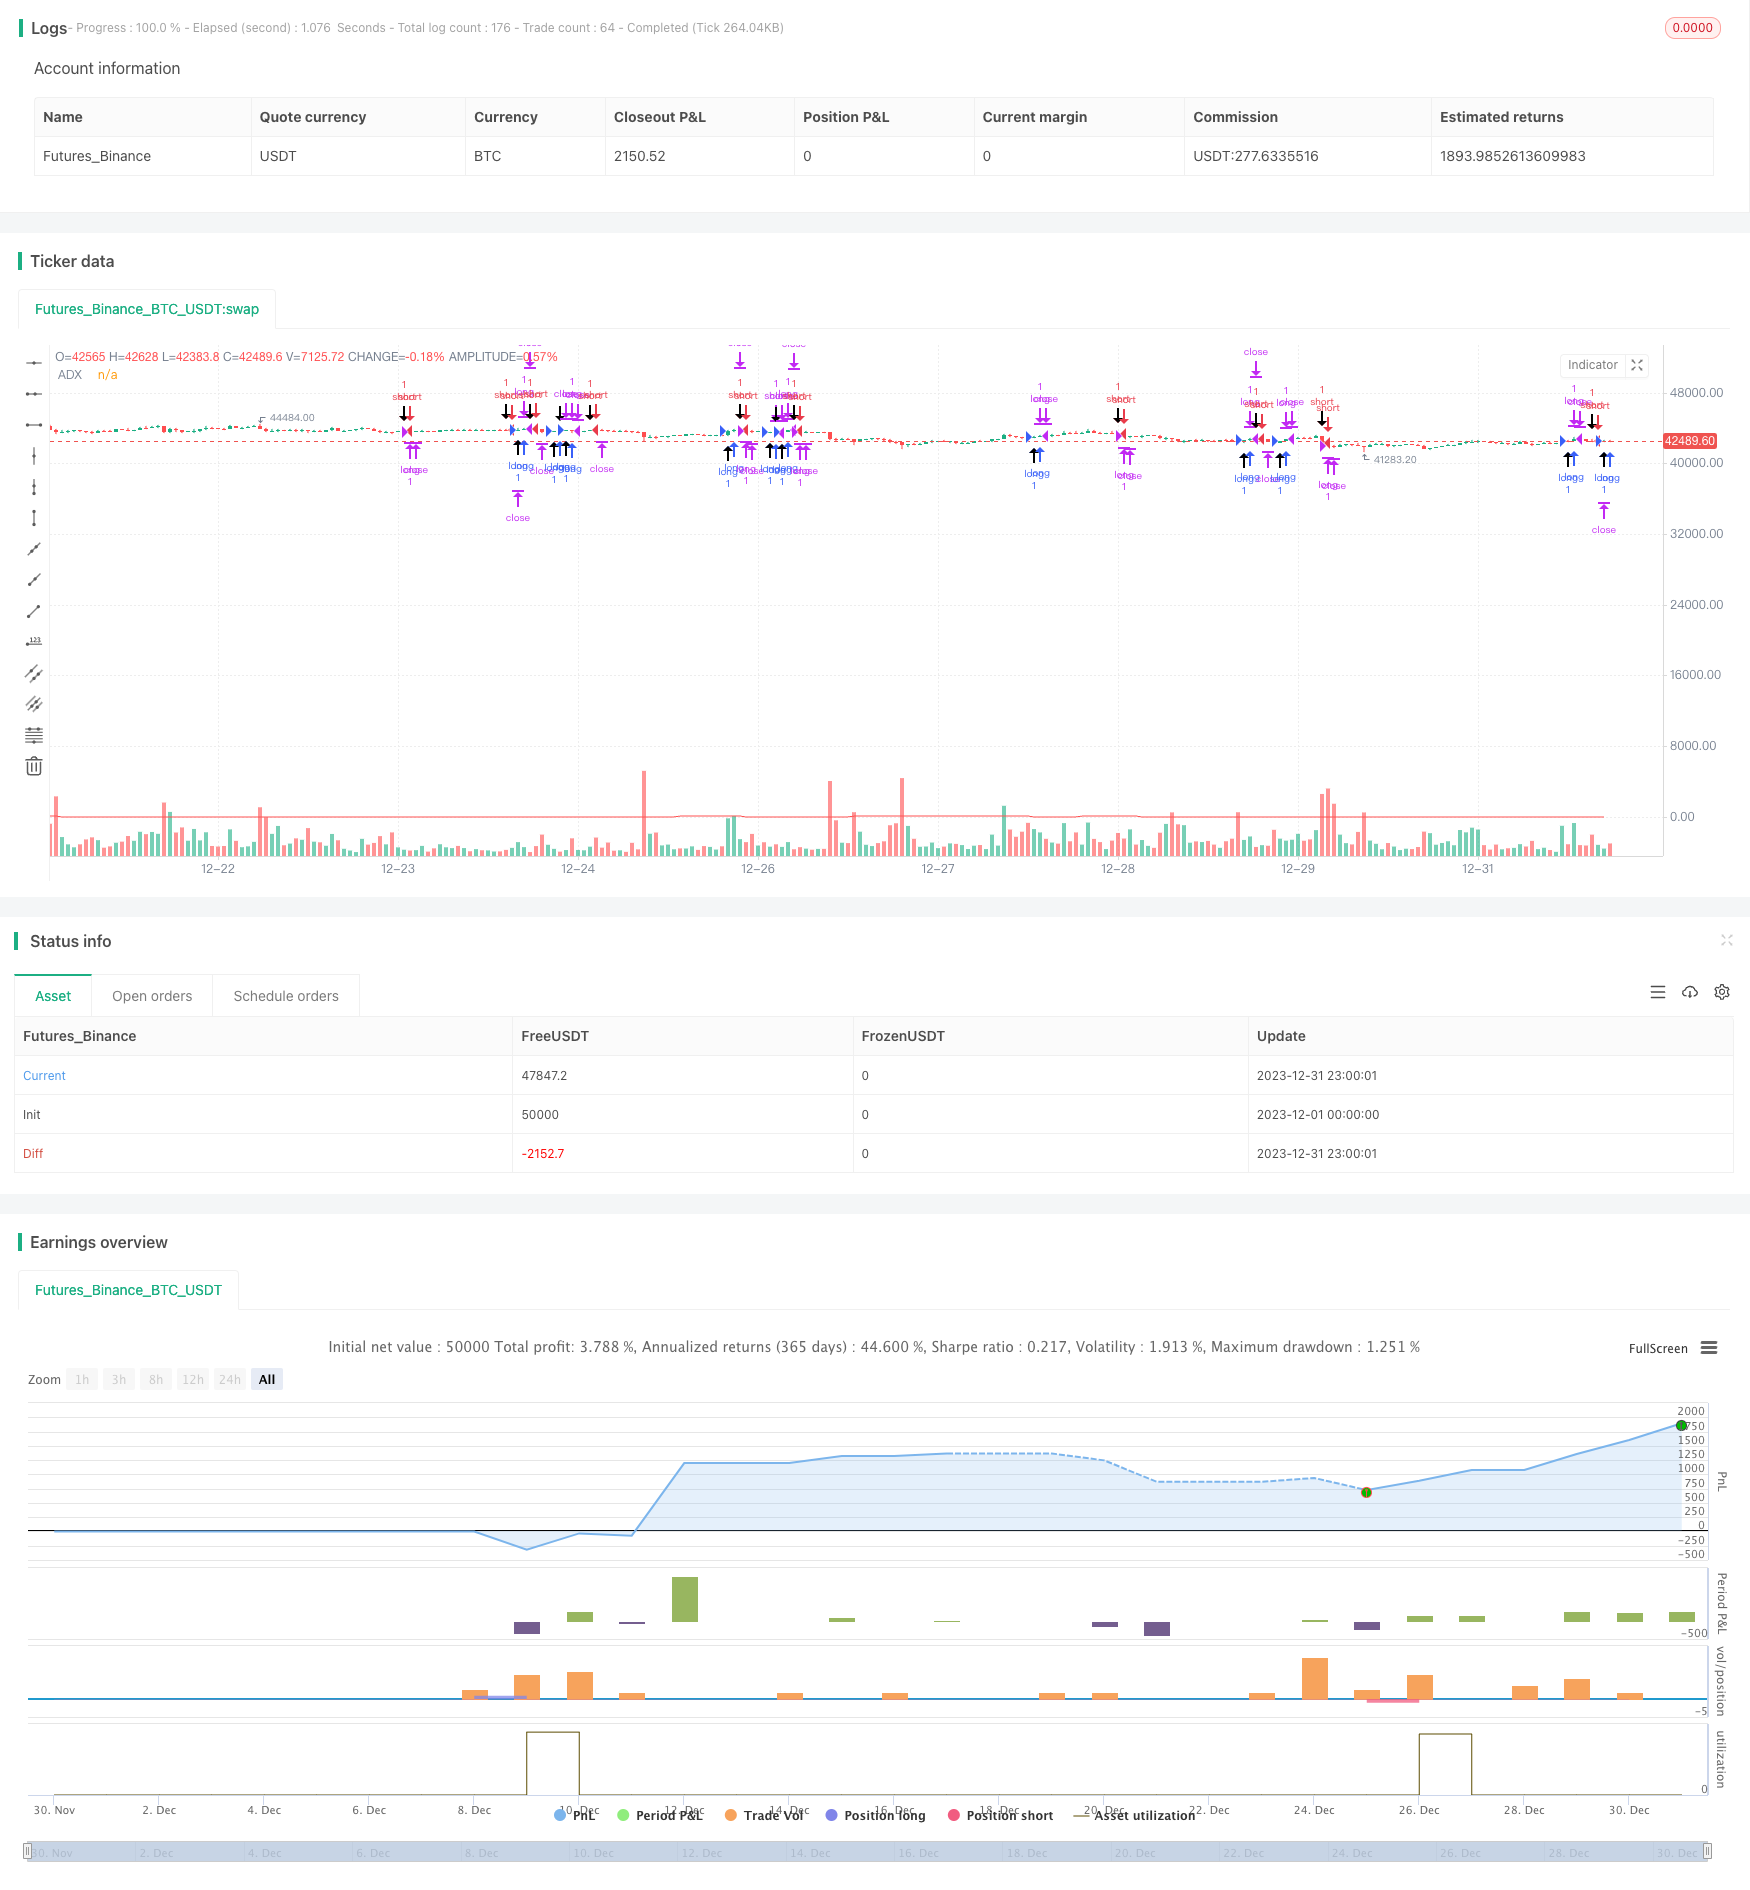
本策略基于Kevin Davey的免费原油期货交易策略改编。该策略利用ADX指标判断原油市场的趋势,结合价格突破原则,实现了一个简单实用的原油自动交易策略。
- 计算14周期的ADX指标
- 当ADX>10时,认为行情具有趋势
- 如果收盘价比65根K线前的收盘价高,则表明价格突破,为长仓信号
- 如果收盘价比65根K线前的收盘价低,则表明价格突破,为短仓信号
- 入场后设置止损和止盈
该策略主要依赖ADX指标判断趋势,并在趋势情况下根据固定周期的价格突破产生交易信号。整个策略逻辑非常简单清晰。
- 利用ADX判断趋势,可避免错过趋势机会
- 固定周期价格突破产生信号,回测效果较好
- 代码直观简洁,易于理解和修改
- Kevin Davey多年实盘验证,非曲线拟合
- ADX作为主要指标,对参数选取和突破周期选取敏感
- 固定周期突破可能错过部分机会
- 止损止盈设定不当可能增大亏损
- 实盘效果与回测存在差异的可能
- 优化ADX参数和突破周期
- 增加持仓量动态调整
- 根据回测结果和实盘验证不断修改完善策略
- 引入机器学习和深度学习技术进行策略优化
本策略总的来说是一个非常实用的原油交易策略。它利用ADX指标判断趋势非常合理,价格突破原则简单有效,回测效果良好。同时作为Kevin Davey的公开免费策略,它具有很强的实战可靠性。虽然策略也存在一定改进空间,但对于初学者和小资金交易者来说,本策略是一个非常适合入门和实践的选择。
||
This strategy is adapted from Kevin Davey's free crude oil futures trading strategy. It utilizes the ADX indicator to determine the trend in the crude oil market and, combined with the price breakout principle, implements a simple and practical automated trading strategy for crude oil.
- Calculate the 14-period ADX indicator
- When ADX>10, the market is considered to have a trend
- If the closing price is higher than the closing price 65 bars ago, it indicates a price breakout and a long signal
- If the closing price is lower than the closing price 65 bars ago, it indicates a price breakout and a short signal
- Set stop loss and take profit after entering the position
The strategy mainly relies on the ADX indicator to determine the trend, and generates trading signals based on fixed-cycle price breakouts under trend conditions. The overall strategy logic is very simple and clear.
- Use ADX to determine trends and avoid missing trend opportunities
- Fixed-cycle price breakouts generate signals with good backtest results
- Intuitive and simple code, easy to understand and modify
- Kevin Davey's multi-year live trading verification, non-curve fitting
- As the main indicator, ADX is sensitive to parameter selection and breakout cycle selection
- Fixed-cycle breakouts may miss some opportunities
- Improper stop loss and take profit settings may increase losses
- There may be differences between live trading and backtest results
- Optimize ADX parameters and breakout cycles
- Increase dynamic adjustment of position size
- Continuously modify and improve the strategy based on backtest results and live trading verification
- Introduce machine learning and deep learning techniques for strategy optimization
Overall this is a very practical crude oil trading strategy. It uses the ADX indicator to determine the trend very reasonably. The price breakout principle is simple and effective with good backtest results. At the same time, as Kevin Davey's public free strategy, it has very strong reliability in actual combat. Although there is still room for improvement in the strategy, it is a very suitable choice for beginners and small capital traders to get started and practice.
[/trans]
Strategy Arguments
| Argument | Default | Description |
|---|---|---|
| v_input_1 | 14 | ADX Smoothing |
| v_input_2 | 14 | DI Length |
Source (PineScript)
/*backtest
start: 2023-12-01 00:00:00
end: 2023-12-31 23:59:59
period: 1h
basePeriod: 15m
exchanges: [{"eid":"Futures_Binance","currency":"BTC_USDT"}]
*/

// Strategy idea coded from EasyLanguage to Pinescript
//@version=5
strategy("Kevin Davey Crude free crude oil strategy", shorttitle="CO Fut", format=format.price, precision=2, overlay = true, calc_on_every_tick = true)
adxlen = input(14, title="ADX Smoothing")
dilen = input(14, title="DI Length")
dirmov(len) =>
	up = ta.change(high)
	down = -ta.change(low)
	plusDM = na(up) ? na : (up > down and up > 0 ? up : 0)
	minusDM = na(down) ? na : (down > up and down > 0 ? down : 0)
	truerange = ta.rma(ta.tr, len)
	plus = fixnan(100 * ta.rma(plusDM, len) / truerange)
	minus = fixnan(100 * ta.rma(minusDM, len) / truerange)
	[plus, minus]
adx(dilen, adxlen) =>
	[plus, minus] = dirmov(dilen)
	sum = plus + minus
	adx = 100 * ta.rma(math.abs(plus - minus) / (sum == 0 ? 1 : sum), adxlen)
sig = adx(dilen, adxlen)
plot(sig, color=color.red, title="ADX")

buy = sig > 10 and (close - close[65]) > 0 and (close - close[65])[1] < 0
sell = sig > 10 and (close - close[65]) < 0 and (close - close[65])[1] > 0

plotshape(buy, style = shape.arrowup, location = location.belowbar,size = size.huge)
plotshape(sell, style = shape.arrowdown, location = location.abovebar,size = size.huge)

if buy
	strategy.entry("long", strategy.long)
if sell
	strategy.entry("short", strategy.short)

if strategy.position_size != 0
	strategy.exit("long", profit = 450, loss = 300)
	strategy.exit("short", profit = 450, loss = 300)


// GetTickValue() returns the currency value of the instrument's
// smallest possible price movement.
GetTickValue() =>
    syminfo.mintick * syminfo.pointvalue

// On the last historical bar, make a label to display the
// instrument's tick value
if barstate.islastconfirmedhistory
    label.new(x=bar_index + 1, y=close, style=label.style_label_left,
         color=color.black, textcolor=color.white, size=size.large,
         text=syminfo.ticker + " has a tick value of:\n" +
             syminfo.currency + " " + str.tostring(GetTickValue()))
Detail
https://www.fmz.com/strategy/439983
Last Modified
2024-01-25 15:18:15
