Name
基于ADXMA和EMA的只做多趋势跟踪策略ADX-MA-and-EMA-Long-Only-Trend-Tracking-Strategy
Author
ChaoZhang
Strategy Description
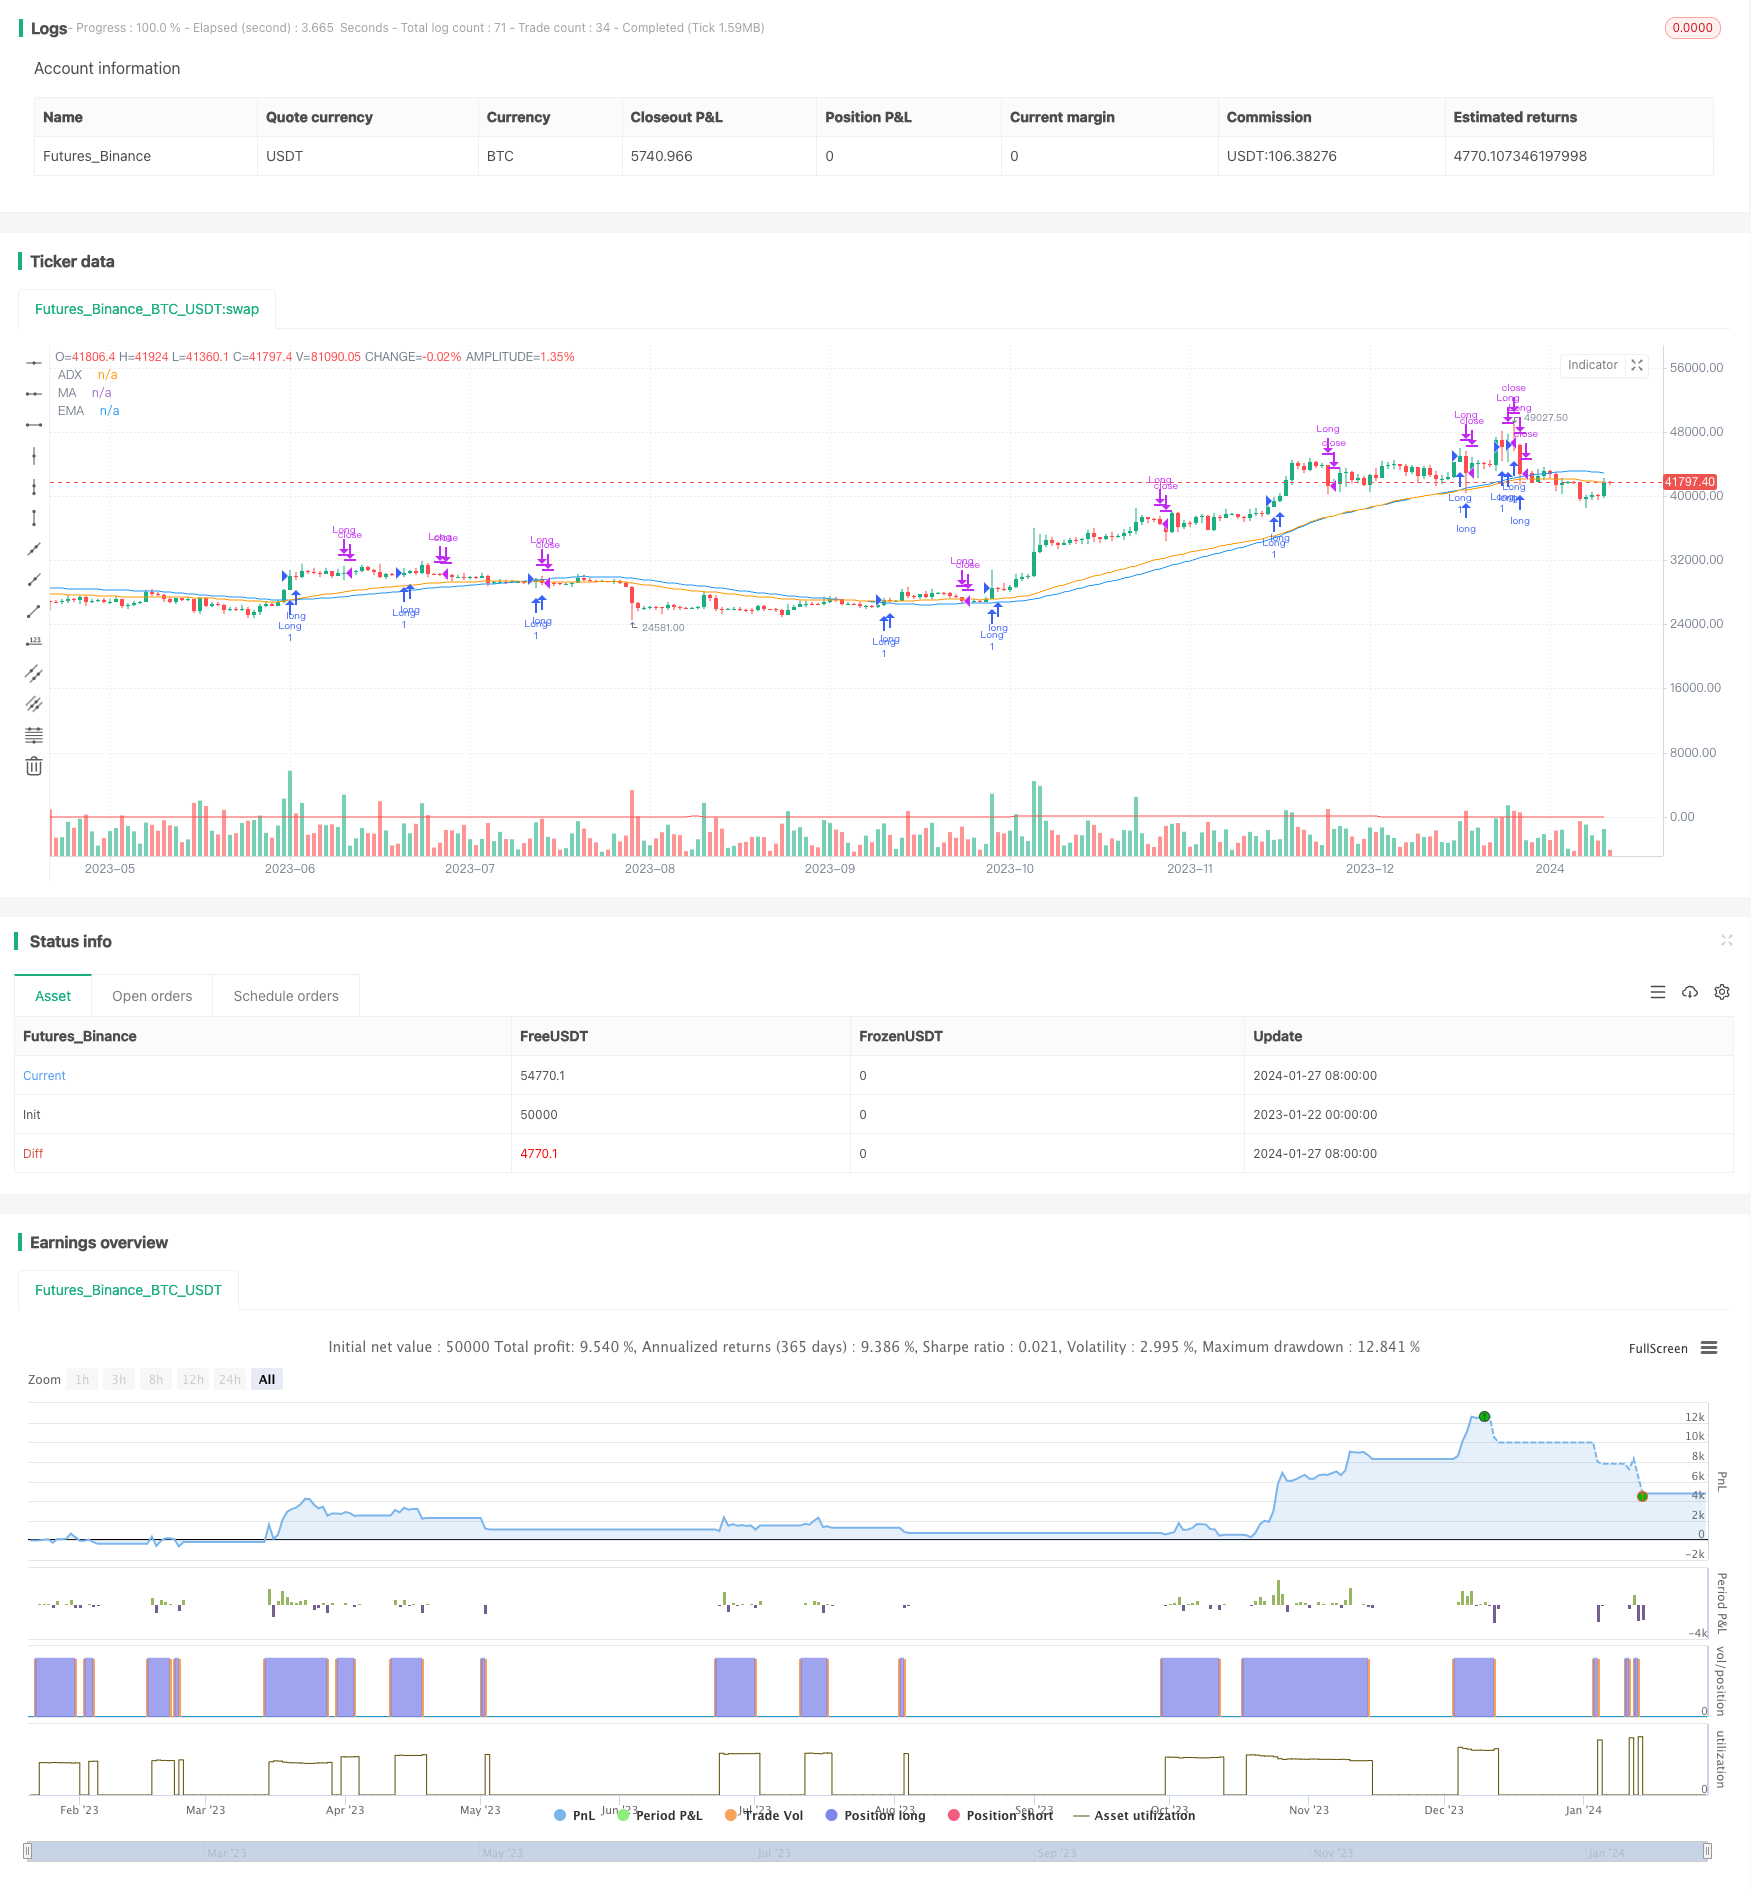
这个策略主要是利用ADX指标判断趋势,并结合MA和EMA两种不同参数设置的移动平均线构建只做多的趋势跟踪策略。当ADX上涨时提示做多方向,并且价格突破上行MA和EMA时开仓做多;当ADX下跌或价格跌破MA或EMA其中之一时平仓。
该策略主要利用ADX判断市场趋势和强度。ADX通过计算价格变化的程度和方向的程度来判断趋势的存在和强度。当ADX上涨时,说明目前处于一个上升趋势中;当ADX下跌时,说明趋势正在减弱。
该策略同时利用两种不同参数设置的移动平均线MA和EMA进行辅助判断。它们能有效地滤除价格的随机性,显示出价格的主要趋势方向。当价格上涨突破MA和EMA时,为做多信号;当价格下跌跌破时,为平仓信号。
结合ADX和移动平均线的特征,该策略构建了判断趋势方向的交易信号:ADX上涨且价格突破上行MA和EMA时做多开仓,ADX下跌或价格跌破MA/EMA时平仓,实现了一个只做多的趋势跟踪策略。
该策略主要具有以下几个优势:
- 利用ADX判断趋势强度,能减少无效交易的发生,跟踪趋势;
- 结合两种不同参数设置的移动平均线进行过滤,能有效识别趋势;
- 只做多,避免29797频繁反向操作带来的滑点损失;
- 入场条件严格,能有效控制风险;
- 实现了一个只做多的长线趋势跟踪策略。
该策略也存在一些风险:
- ADX指标存在滞后,可能错过最佳入场时机;
- 只做多,无法利用下跌行情获利;
- 当趋势发生转变时,存在一定亏损风险;
- 参数设置不当也会影响策略表现。
对应解决方法:
- 适当调整ADX的参数,减少滞后;
- 可设置止损策略,控制单笔亏损;
- 对参数进行测试优化,选择最佳参数。
该策略还可以从以下几个方面进行优化:
- 增加止损策略,更好控制风险;
- 增加仓位管理,根据市场情况动态调整仓位;
- 测试优化参数,寻找最佳参数组合;
- 增加机器学习算法,动态优化参数;
- 构建马丁格尔做多策略,降低盈亏比的影响。
该策略整体是一个利用ADX判断趋势强度,并辅助以两个移动平均线构建过滤信号的只做多趋势跟踪策略。它有效控制了无效交易的发生,实现了跟踪趋势的效果,是一种较为稳定的只做多策略。通过一定的优化调整,可以进一步增强策略的稳定性和收益率。
||
This strategy mainly uses the ADX indicator to judge the trend and combines the MA and EMA moving averages with different parameter settings to build a long-only trend tracking strategy. When ADX rises, it indicates a long direction. When the price breaks through the upward MA and EMA, open long positions. When ADX falls or the price falls below MA or EMA, close positions.
The strategy mainly uses ADX to judge market trend and strength. ADX calculates the degree and direction of price changes to determine the existence and strength of the trend. When ADX rises, it means that it is currently in an upward trend. When ADX falls, it means the trend is weakening.
The strategy also uses two moving averages, MA and EMA, with different parameter settings as auxiliary judgment. They can effectively filter the randomness of prices and show the main trend direction of prices. When prices rise and break through MA and EMA, it is a long signal. When prices fall and break through, it is a closing signal.
Combining the characteristics of ADX and moving averages, the strategy builds trading signals to judge the trend direction: go long when ADX rises and prices break through the upward MA and EMA, and close positions when ADX falls or prices break through MA/EMA. It implements a long-only trend tracking strategy.
The main advantages of this strategy are:
- Use ADX to judge the trend strength, reduce invalid trades and track trends.
- Combining two moving averages with different parameter settings can effectively identify trends.
- Only long positions avoid frequent reverse operations and slippage loss.
- Strict entry conditions can effectively control risks.
- Implement a long-only trend tracking strategy.
There are also some risks:
- ADX indicator has lag, possibly missing the best entry point.
- Only long positions cannot profit from falling markets.
- There is a certain loss risk when trends change.
- Improper parameter settings also affect strategy performance.
Solutions:
- Adjust ADX parameters to reduce lag reasonably.
- Set stop loss to control single loss.
- Test and optimize parameters to select the best.
The strategy can be optimized from the following aspects:
- Add a stop loss strategy to better control risks.
- Add position management to dynamically adjust positions based on market conditions.
- Test and optimize parameters to find the best combination.
- Add machine learning algorithms to dynamically optimize parameters.
- Build martingale strategies to reduce the impact of profit ratio.
In general, this is a long-only trend tracking strategy that uses ADX to judge the trend strength and two moving averages as auxiliary filters. It effectively controls the occurrence of invalid trades and achieves the effect of tracking trends. It is a relatively stable long-only strategy. With some optimizations, the strategy's stability and yield can be further enhanced.
[/trans]
Strategy Arguments
| Argument | Default | Description |
|---|---|---|
| v_input_1 | 14 | ADX Smoothing |
| v_input_2 | 14 | DI Length |
| v_input_3 | 50 | MA Period |
| v_input_4 | 50 | EMA Period |
Source (PineScript)
/*backtest
start: 2023-01-22 00:00:00
end: 2024-01-28 00:00:00
period: 1d
basePeriod: 1h
exchanges: [{"eid":"Futures_Binance","currency":"BTC_USDT"}]
*/

//@version=4
strategy("ADX, MA, and EMA Long Strategy - ADX Trending Up", shorttitle="ADX_MA_EMA_Long_UpTrend", overlay=true)
adxlen = input(14, title="ADX Smoothing")
dilen = input(14, title="DI Length")
maPeriod = input(50, title="MA Period")
emaPeriod = input(50, title="EMA Period")
dirmov(len) =>
    up = change(high)
    down = -change(low)
    plusDM = na(up) ? na : (up > down and up > 0 ? up : 0)
    minusDM = na(down) ? na : (down > up and down > 0 ? down : 0)
    truerange = rma(tr, len)
    plus = fixnan(100 * rma(plusDM, len) / truerange)
    minus = fixnan(100 * rma(minusDM, len) / truerange)
    [plus, minus]
adx(dilen, adxlen) =>
    [plus, minus] = dirmov(dilen)
    sum = plus + minus
    100 * rma(abs(plus - minus) / (sum == 0 ? 1 : sum), adxlen)
sig = adx(dilen, adxlen)
maValue = sma(close, maPeriod)
emaValue = ema(close, emaPeriod)
longCondition = sig > sig[1] and close > maValue and close > emaValue
if (longCondition)
    strategy.entry("Long", strategy.long)
exitCondition = sig < sig[1] or  close < maValue or close < emaValue
if (exitCondition)
    strategy.close("Long")
plot(maValue, color=color.blue, title="MA")
plot(emaValue, color=color.orange, title="EMA")
plot(sig, color=color.red, title="ADX")
Detail
https://www.fmz.com/strategy/440314
Last Modified
2024-01-29 11:30:15
