Name
基于ATR和斐波那契回撤止损的趋势跟踪策略ATR-Trailing-Stop-Strategy-with-Fibonacci-Retracement-Targets
Author
ChaoZhang
Strategy Description
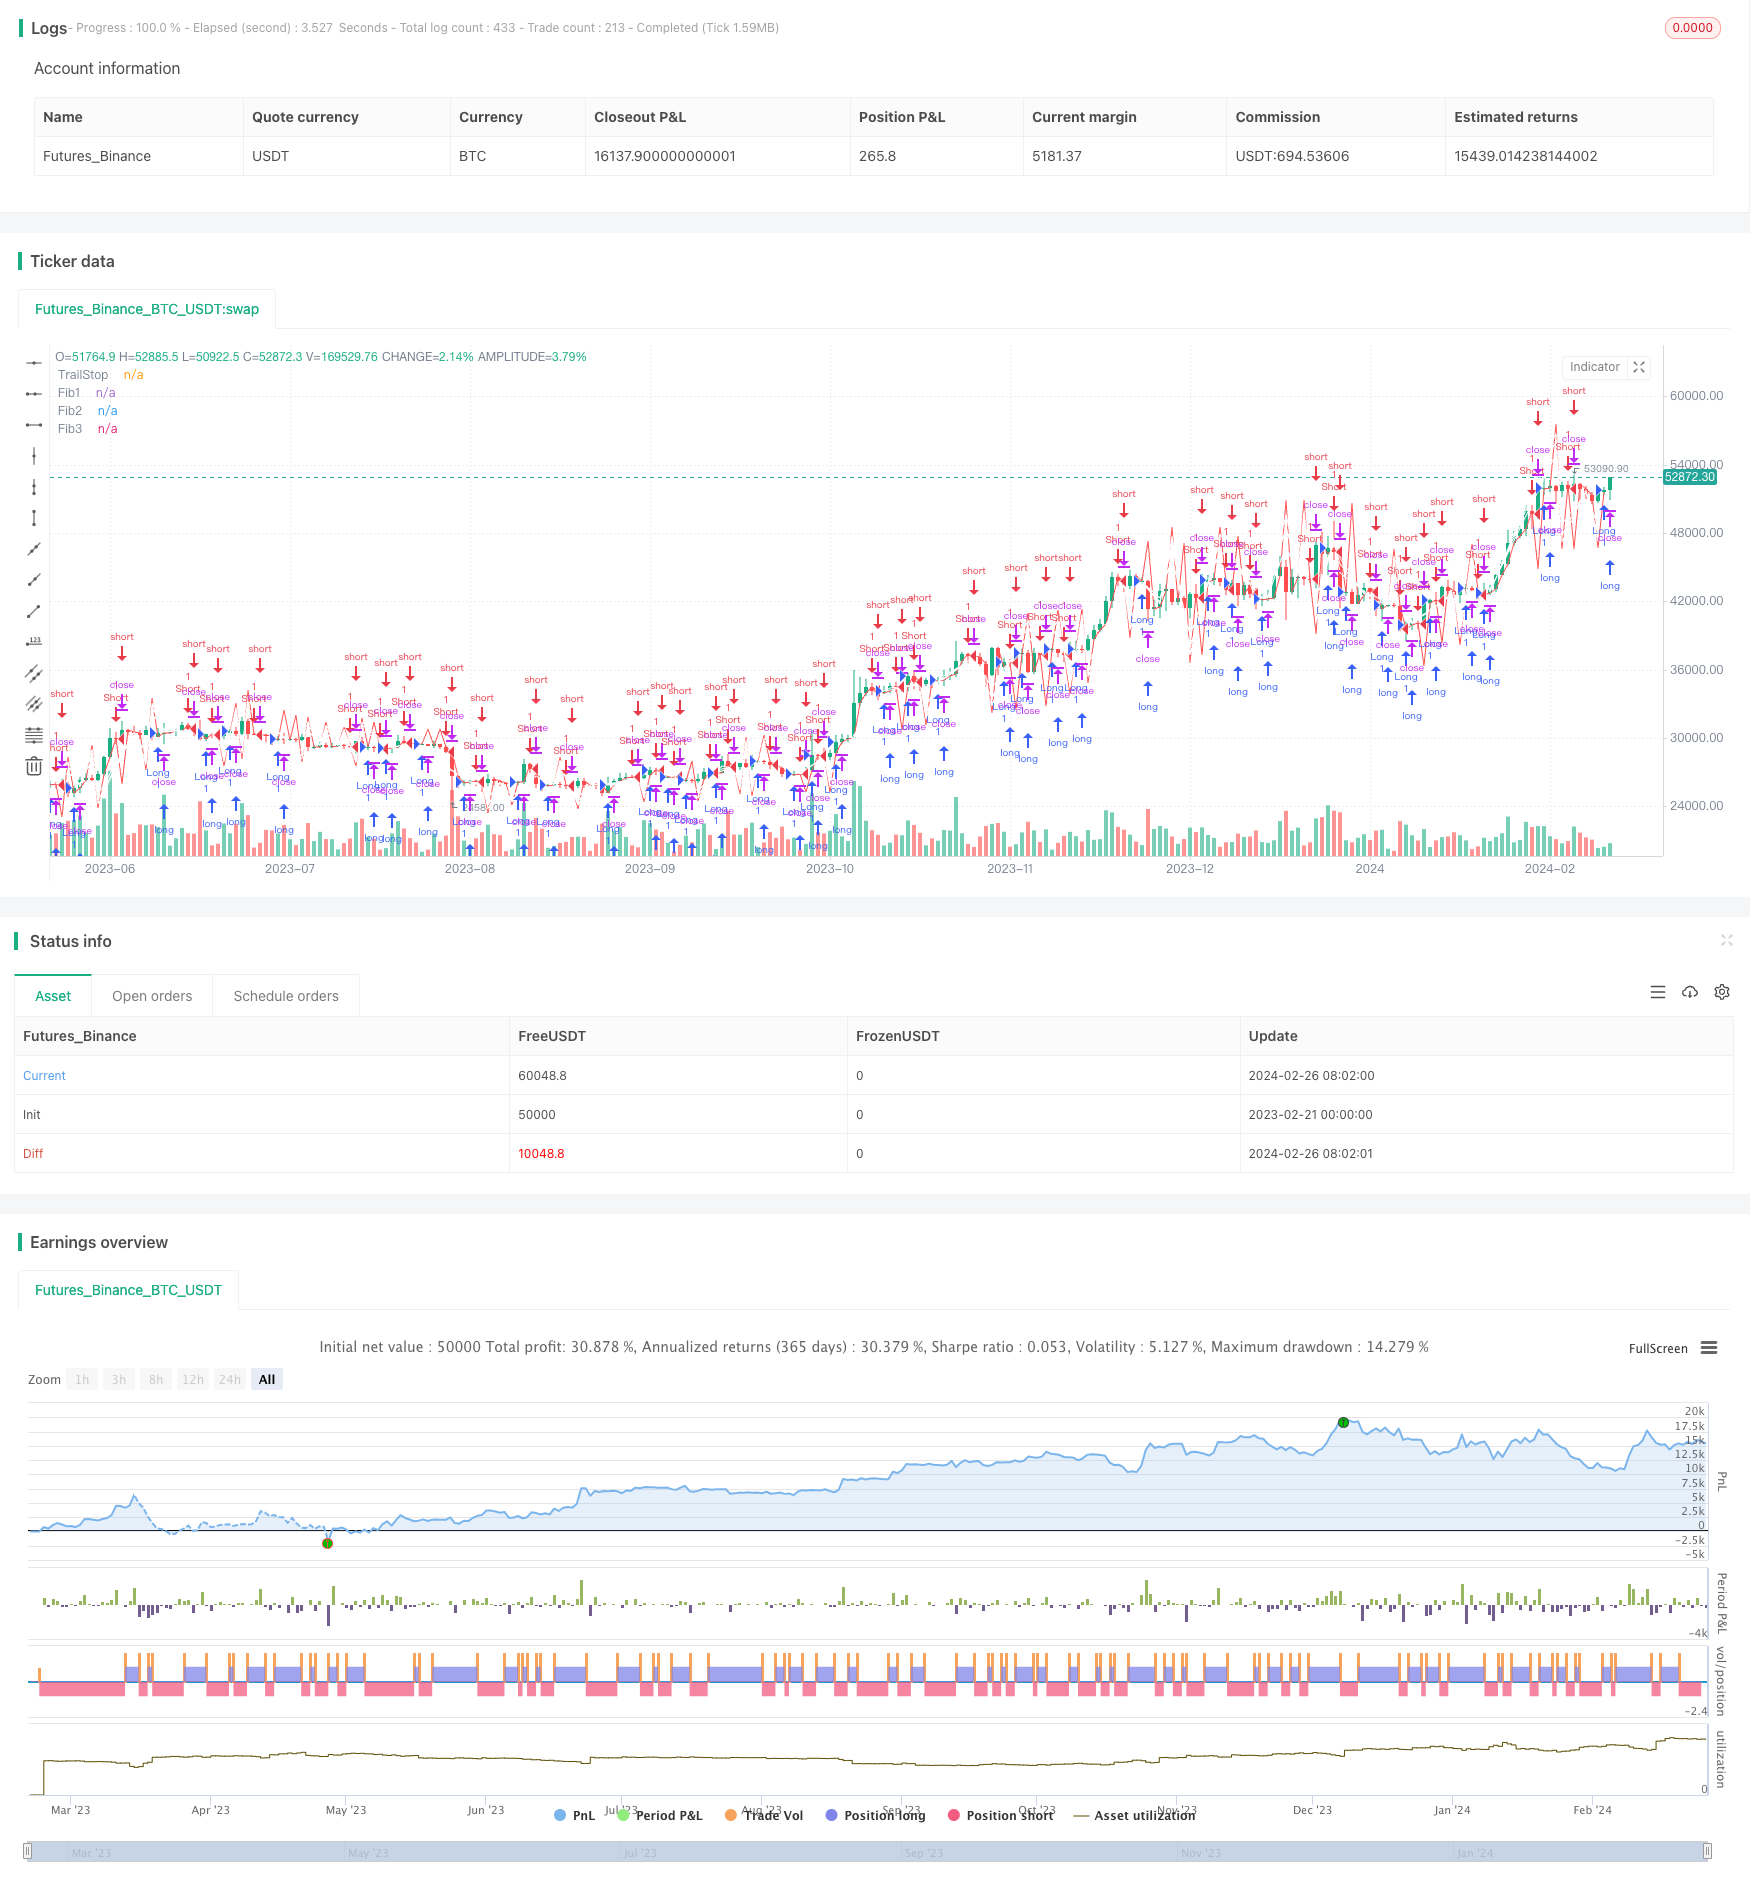
本策略结合平均真实波动范围(ATR)和斐波那契回撤线,设计一个有止损保护的趋势跟踪策略。当价格突破ATR回撤止损线时,进行趋势跟踪;同时利用斐波那契回撤线来设置价格目标,实现趋势跟踪和止损止盈的有机配合。
- 计算ATR值和ATR回撤止损线。ATR回撤止损线是ATR值乘以一个因子(如3.5)得到的。
- 计算三条斐波那契回撤线作为止盈目标。斐波那契回撤线定位是ATR回撤止损线到新高/新低点之间的斐波那契割合(如61.8%, 78.6%, 88.6%)。
- 当价格突破ATR回撤止损线时,产生买入/卖出信号,进行趋势跟踪。
- 止盈目标为三条斐波那契回撤线。
- ATR止损可以有效控制风险,防止亏损扩大。
- 斐波那契目标可以在趋势中获利较多,同时也避免追高杀跌。
- 策略操作逻辑清晰简单,容易实施。
- 可灵活调整ATR比例因子和斐波那契设置来适应不同市场。
- 在震荡行情中,ATR止损可能被频繁触发,带来操作频繁的风险。
- 存在一定的错过回调或调整的风险。
- 需要合理参数优化,如ATR周期参数等。
- 可以结合趋势判断指标,避免在震荡行情中操作。
- 可以添加重新入场机制,以减少错过回调的风险。
- 对ATR周期、ATR倍数、斐波那契参数进行测试和优化。
本策略整合ATR止损和斐波那契目标两个重要的技术分析方法,既可以在趋势中进行利润优化,也可以用止损来控制风险,是一种实用性很强的趋势跟踪策略。通过进一步优化可以使策略更稳定、更适应行情。
||
This strategy combines Average True Range (ATR) trailing stop and Fibonacci retracement lines to design a trend following strategy with stop loss protection. When price breaks through the ATR trailing stop line, the strategy starts to follow the trend. At the same time, Fibonacci retracement lines are used to set price targets, achieving an organic combination of trend following, stop loss and take profit.
- Calculate ATR value and ATR trailing stop line. The ATR trailing stop line is calculated by multiplying ATR value by a factor (e.g. 3.5).
- Calculate three Fibonacci retracement lines as profit targets. Fibonacci retracement lines are positioned between the ATR trailing stop line and the new high/low point according to Fibonacci ratios (e.g. 61.8%, 78.6%, 88.6%).
- Generate buy/sell signals when price breaks through the ATR trailing stop line to follow the trend.
- Set take profit targets at the three Fibonacci retracement lines.
- ATR stop loss can effectively control risks and prevent losses from expanding.
- Fibonacci targets allow decent profits during trends while avoiding chasing tops and bottoms.
- The strategy logic is simple and easy to implement.
- Flexibility to adjust ATR factor and Fibonacci settings to adapt to different markets.
- Frequent ATR stop loss triggers in ranging markets, leading to excessive trading.
- Possibilities of missing pullbacks and adjustments.
- Parameter optimization needed for ATR period etc.
- Incorporate trend filter to avoid trading in ranging markets.
- Add re-entry mechanism to reduce missing pullbacks.
- Test and optimize ATR period, ATR multiplier, Fibonacci parameters etc.
The strategy integrates two important technical analysis methods – ATR trailing stop and Fibonacci retracement for trend following, risk control and profit targeting. With further optimizations, it can become a very practical trend trading strategy that is more robust and adaptive to market conditions.
[/trans]
Strategy Arguments
| Argument | Default | Description |
|---|---|---|
| v_input_1 | 5 | ATR Period |
| v_input_2 | 3.5 | ATR Factor |
| v_input_3 | 61.8 | Fib1 Level |
| v_input_4 | 78.6 | Fib2 Level |
| v_input_5 | 88.6 | Fib3 Level |
Source (PineScript)
/*backtest
start: 2023-02-21 00:00:00
end: 2024-02-27 00:00:00
period: 1d
basePeriod: 1h
exchanges: [{"eid":"Futures_Binance","currency":"BTC_USDT"}]
*/

//@version=5
strategy("ATR TrailStop with Fib Targets", overlay=true)

// Input parameters
atrPeriod = input(5, title="ATR Period")
ATRFactor = input(3.5, title="ATR Factor")
Fib1Level = input(61.8, title="Fib1 Level")
Fib2Level = input(78.6, title="Fib2 Level")
Fib3Level = input(88.6, title="Fib3 Level")

// ATR Calculation
atrValue = ta.atr(atrPeriod)

// ATR TrailStop Calculation
loss = ATRFactor * atrValue
trendUp = close[1] > close[2] ? (close - loss > close[1] ? close - loss : close[1]) : close - loss
trendDown = close[1] < close[2] ? (close + loss < close[1] ? close + loss : close[1]) : close + loss
trend = close > close[2] ? 1 : close < close[2] ? -1 : 0
trailStop = trend == 1 ? trendUp : trendDown

// Fibonacci Levels Calculation
ex = trend > trend[1] ? high : trend < trend[1] ? low : na
fib1 = ex + (trailStop - ex) * Fib1Level / 100
fib2 = ex + (trailStop - ex) * Fib2Level / 100
fib3 = ex + (trailStop - ex) * Fib3Level / 100

// Plotting
plot(trailStop, title="TrailStop", color=color.red)
plot(fib1, title="Fib1", color=color.white)
plot(fib2, title="Fib2", color=color.white)
plot(fib3, title="Fib3", color=color.white)

// Buy and Sell Signals
longCondition = close > trailStop and close[1] <= trailStop
shortCondition = close < trailStop and close[1] >= trailStop

if (longCondition)
    strategy.entry("Long", strategy.long)

if (shortCondition)
    strategy.entry("Short", strategy.short)
Detail
https://www.fmz.com/strategy/443034
Last Modified
2024-02-28 17:09:12
