Name
基于ATR通道突破的量化交易策略An-ATR-Channel-Breakout-Quantitative-Trading-Strategy
Author
ChaoZhang
Strategy Description
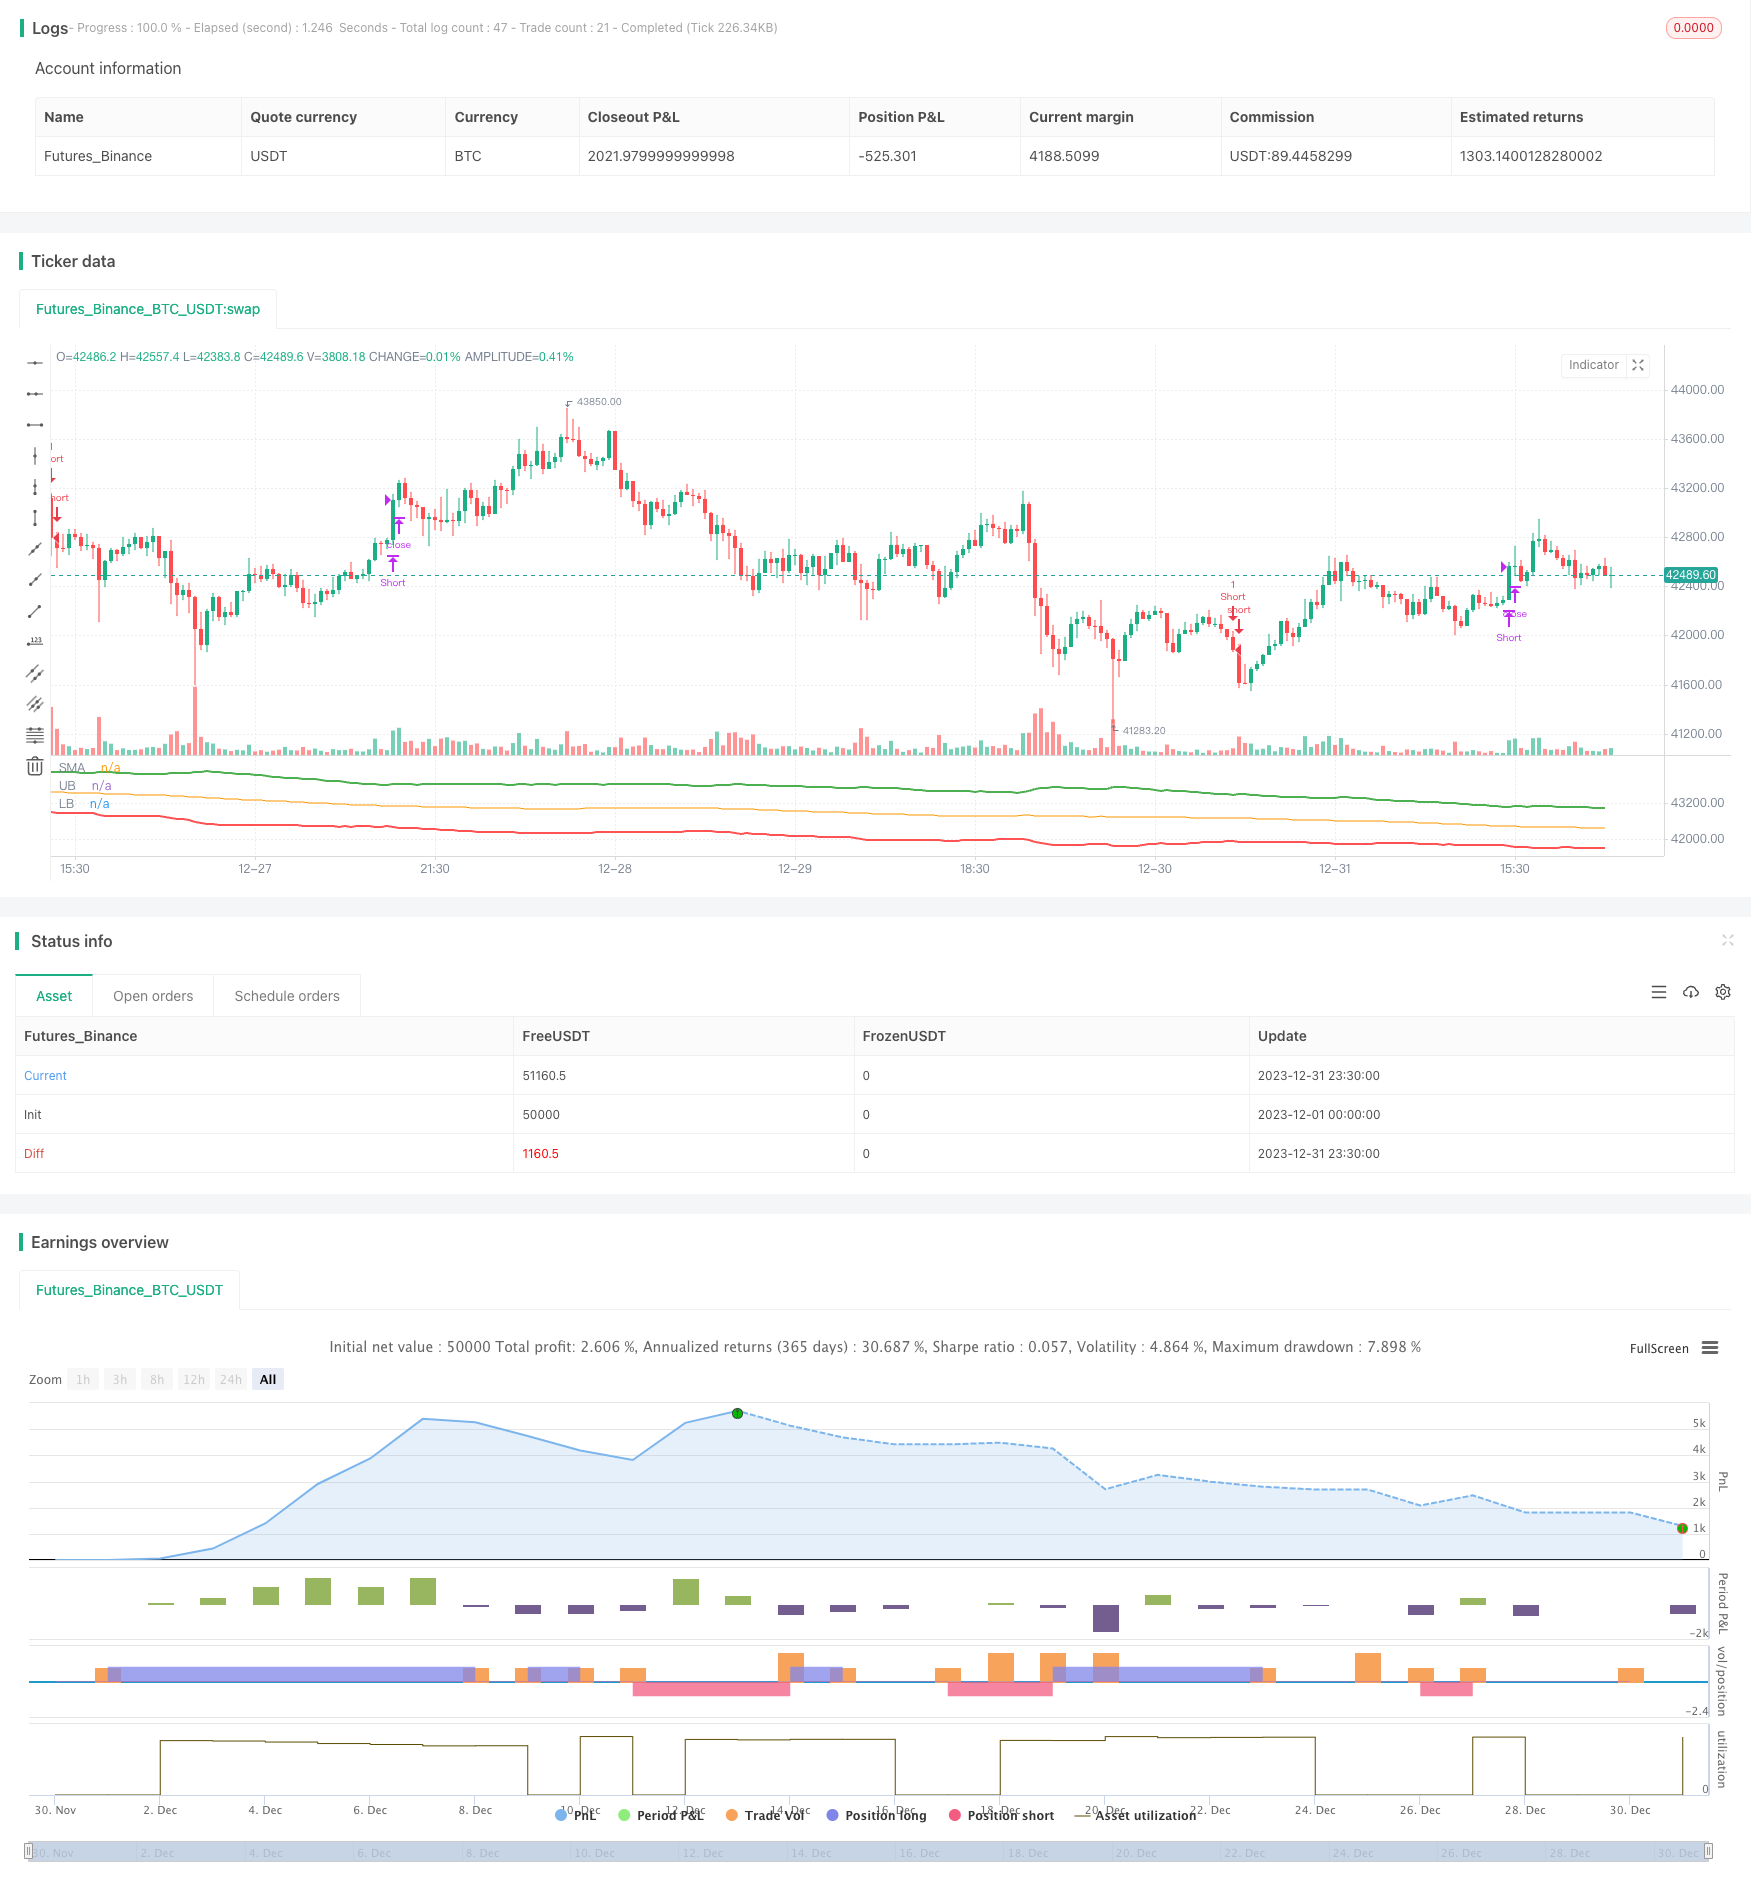
该策略基于计算平均真实波幅(ATR)形成的通道进行交易。具体来说,是计算一定周期的SMA均线,再利用ATR值确定通道上下轨,当价格突破通道上轨时做多,当价格跌破通道下轨时做空,并在价格重新跌破SMA均线时平仓。
该策略的核心逻辑基于平均真实波幅(ATR)通道。ATR指标可以有效反映市场的波动性和股价走势,通常用于确定止损线和盈利目标。策略首先计算n周期(默认150周期)的SMA均线,然后根据ATR值和参照系数确定通道上下轨的位置。具体计算公式如下:
上轨 = SMA均线 + ATR值 × 上轨系数(默认4) 下轨 = SMA均线 - ATR值 × 下轨系数(默认4)
当股价上涨突破上轨时,表示股价开始进入趋势通道,表明股价将继续上涨,此时做多;当股价下跌突破下轨时,表示股价开始反转下跌,此时做空。平仓信号为当股价重新跌破SMA均线时平掉所有的多单;当股价重新涨破SMA均线时平掉所有的空单。
-
使用平均真实波幅ATR作为通道范围参考,能更准确捕捉市场波动。ATR可以有效衡量市场波动性,从而设置更合适的通道范围。
-
SMA均线+ATR通道,双重过滤确保交易信号更加可靠。只有在价格突破通道上下轨时才发出交易信号,避免了不必要的虚假信号。
-
通过参数优化,可以在最大程度上把握股价上涨和下跌的机会,利用趋势获利。通道宽度和周期都可以优化设置。
-
策略逻辑简单清晰易于理解,容易实施。基于指标和通道判断做多做空的思路非常直观。
-
包含做多做空双向交易策略,可以在股价上涨和下跌的行情中都获得收益。
-
通道突破交易容易在关键节点发生亏损。如果突破是假突破,可能会在短期出现较大亏损。
-
SMA均线系统性风险较大,不能及时反映市场变化。价格可能已经进入下跌趋势但SMA均线尚未转折。
-
ATR和系数参数设置不当,会影响通道范围的合理性。
-
多头牛市行情下,空头交易会持续亏损。反之,空头熊市行情下,多头交易会持续亏损。
对应风险的解决方案:
-
适当调整交易频率,降低假突破的风险。或者设置第二层过滤条件,避免在关键点位发生亏损。
-
结合MACD、KDJ等其他指标,对SMA做双重确认,避免系统性风险。
-
做好参数优化,选择合适的ATR周期和通道系数,确保通道范围合理。
-
根据大级别市场结构判断,选择趋势交易方向。牛市做多,熊市做空。
该策略可以从以下几个方向进行优化:
-
增加其他技术指标过滤,避免假突破。可以在通道突破的同时检测MACD、KDJ等指标的信号,做多层确认。
-
优化ATR和通道系数参数,使通道范围更符合当前市场状态。这需要大量回测和优化来确定最佳参数组合。
-
增加自动止损策略,以控制单笔交易的最大亏损风险。移动止损是常见的可选方案。
-
可以在趋势偏离时及时止损。例如价格离开SMA均线超过一定范围时止损。
-
结合更大级别的市场结构分析指标,区分多空市做相应方向的突破交易。例如在周线级别确定趋势,然后在日内进行突破交易。
该策略基于SMA均线+ATR通道双轨形式,在价格突破通道上下轨时进行相应方向的交易,是一种典型的通道突破策略。优点是双重指标过滤,突破信号相对可靠;缺点是存在一定程度假突破的风险。通过参数优化、增加止损策略、结合趋势判断等方面进一步完善,可以使策略更加可靠、符合市场结构,从而获得更稳定的收益。该策略简单易操作,值得进行探索和优化实践。
||
This strategy trades based on channels formed using the Average True Range (ATR). Specifically, it calculates a SMA line over a certain period, then uses the ATR values to determine the upper and lower bands of the channel. It goes long when the price breaks out above the upper band, and goes short when the price breaks below the lower band. Positions are closed when the price crosses back below the SMA line.
The core logic of this strategy is based on ATR channels. The ATR indicator can effectively reflect market volatility and price movements, and is usually used to determine stop loss and take profit levels. The strategy first calculates the SMA line over n periods (default 150), then uses the ATR value and coefficient to determine the upper and lower channel bands. The specific formulas are:
Upper Band = SMA + ATR Value × Upper Band Coefficient (default 4) Lower Band = SMA - ATR Value × Lower Band Coefficient (default 4)
When the price breaks out above the upper band, it indicates the start of a trend channel and upside momentum, so a long position is taken. When the price breaks below the lower band, it signals the start of a reversal, so a short position is taken. Exits occur when the price crosses back below the SMA line, closing out all longs, or crosses back above the SMA line, closing out all shorts.
-
Using ATR as the reference for channel range can more accurately capture market volatility. ATR effectively measures market volatility for better channel sizing.
-
The dual filters of SMA and ATR channel ensure more reliable trade signals, reducing false signals.
-
Parameters can be optimized to maximize the capture of upside and downside price movements for trend trading profits. Both channel width and lookback period are tunable.
-
Simple and clear logic that is easy to understand and implement. Intuitive long/short decisions based on indicators and channel breakouts.
-
Includes both long and short trades to profit from up and down trends.
-
Channel breakout trades are prone to losses at key reversal points if breakout turns out to be false.
-
SMA has systemic risk of lagging market turns. Price may already be falling but SMA has yet to turn down.
-
Poor ATR parameter and coefficient settings can result in irrational channel ranges.
-
Persistent short losses in bull market uptrends, and persistent long losses in bear market downtrends.
Possible solutions:
-
Adjust trade frequency or add filters to avoid losses from false breakouts.
-
Add cross-confirmation with MACD, KDJ to avoid SMA systemic lag risk.
-
Optimize ATR period and coefficient to ensure reasonable channel range.
-
Determine overall market regime for trend bias. Go long in bull trending markets and short in bear trends.
Some ways this strategy can be enhanced:
-
Add additional indicator filters to reduce false breakout whipsaws, using MACD, KDJ etc. to confirm signals.
-
Optimize ATR period and channel coefficient to fit current market volatility conditions through extensive backtesting.
-
Incorporate automated stop loss to control maximum loss per trade. Trailing stops are a common implementation.
-
Cut losses quickly when price diverges away from SMA baseline.
-
Incorporate higher timeframe trend analysis to determine bull/bear bias for breakout direction. For example, use weekly to determine overall trend for daily breakout entries.
This is a classic channel breakout strategy using SMA and ATR channel bands. Its strength lies in more reliable signals from the dual filters, while weakness is the risk of false breakouts. Further improvements can be made through parameter optimization, stop losses, and trend analysis to make it more robust and aligned with market conditions. With tune-up, it can achieve more consistent profits. The simplicity of this strategy makes it worth exploring and optimizing in practice.
[/trans]
Strategy Arguments
| Argument | Default | Description |
|---|---|---|
| v_input_int_1 | 150 | SMA Length |
| v_input_int_2 | 30 | ATR Length |
| v_input_float_1 | 4 | Upperband Offset |
| v_input_float_2 | 4 | Lowerband Offset |
Source (PineScript)
/*backtest
start: 2023-12-01 00:00:00
end: 2023-12-31 23:59:59
period: 30m
basePeriod: 15m
exchanges: [{"eid":"Futures_Binance","currency":"BTC_USDT"}]
*/

// This Pine Script™ code is subject to the terms of the Mozilla Public License 2.0 at https://mozilla.org/MPL/2.0/
// © omererkan

//@version=5
strategy(title="ATR Channel Breakout")

smaLength = input.int(150, title="SMA Length")
atrLength = input.int(30, title="ATR Length")

ubOffset = input.float(4, title="Upperband Offset", step=0.50)
lbOffset = input.float(4, title="Lowerband Offset", step=0.50)


smaValue = ta.sma(close, smaLength)
atrValue = ta.atr(atrLength)

upperBand = smaValue + (ubOffset * atrValue)
lowerBand = smaValue - (lbOffset * atrValue)


plot(smaValue, title="SMA", color=color.orange)
plot(upperBand, title="UB", color=color.green, linewidth=2)
plot(lowerBand, title="LB", color=color.red, linewidth=2)


enterLong = ta.crossover(close, upperBand)
exitLong  = ta.crossunder(close, smaValue)


enterShort = ta.crossunder(close, lowerBand)
exitShort  = ta.crossover(close, smaValue)


if enterLong
    strategy.entry("Long", strategy.long)

if enterShort
    strategy.entry("Short", strategy.short)


if exitLong
    strategy.close("Long", "Close Long")

if exitShort
    strategy.close("Short", "Close Short")
Detail
https://www.fmz.com/strategy/439715
Last Modified
2024-01-23 12:00:04
