Name
基于CCI和EMA的趋势跟随交易策略CCI-and-EMA-Trend-Following-Trading-Strategy
Author
ChaoZhang
Strategy Description
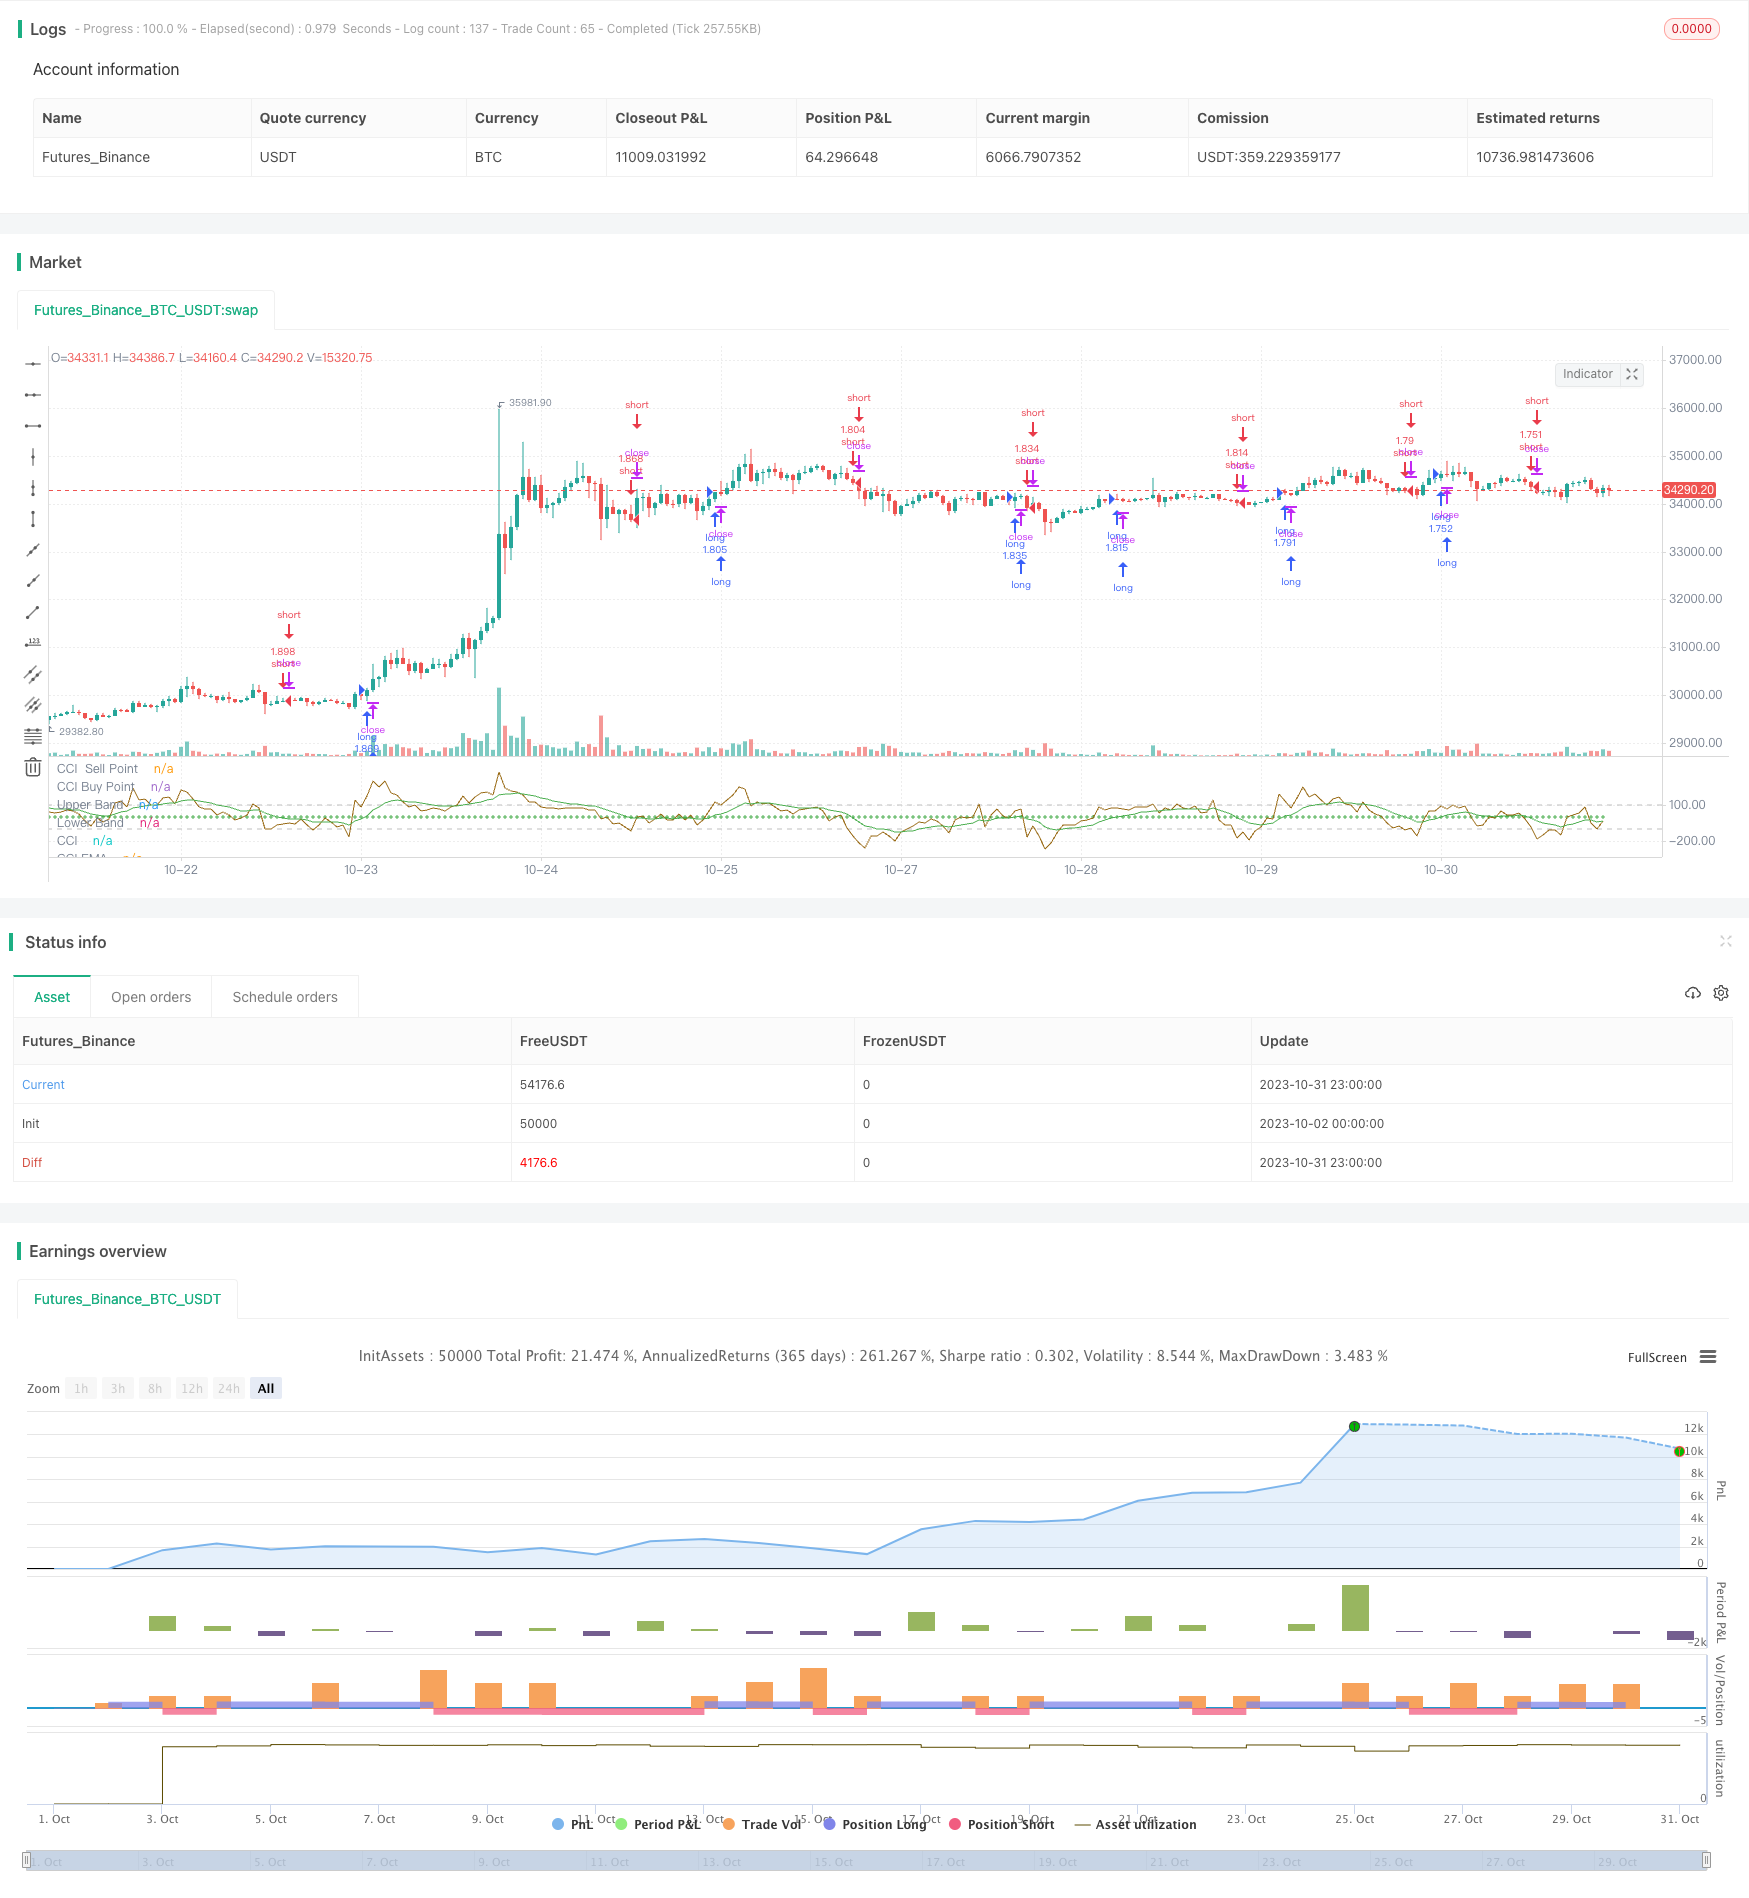
本策略的核心思想是利用CCI指标判断市场趋势方向,以及利用EMA指标对CCI进行平滑处理,实现趋势跟随交易。当CCI上穿过买点时做多,当CCI下穿过卖点时做空,达到跟随市场趋势的目的。
-
计算CCI指标。CCI指标以当日收盘价与过去20天的均线的偏离程度来判断目前的股价是否已超买或超卖。公式为:(typical price - 20日SMA) / (0.015 * 20日典型价格标准差)。
-
对CCI指标进行EMA平滑处理,得到CCI-EMA曲线,以减少CCI指标的震荡,使信号更明确。
-
设置CCI的买点和卖点。当CCI-EMA上穿过买点时,做多;当CCI-EMA下穿过卖点时,做空。
-
持仓至CCI-EMA再次触碰买点或卖点时平仓。
-
利用CCI判断市场趋势方向,再结合EMA过滤假信号,可以有效跟踪市场趋势。
-
CCI指标对价格异常敏感,可以快速捕捉趋势的转折。EMA指标能减少误报率。二者配合使用,可以在趋势开始阶段即抓住机会。
-
采用趋势跟随策略,可最大限度减少交易次数,降低交易成本和滑点损失。
-
策略回测效果较好,具有一定的实盘可行性。
-
CCI指标存在对曲线过度敏感的问题,EMA无法完全滤除所有假信号,仍存在一定的误报风险。
-
纯趋势跟随策略,在趋势震荡或反转时容易亏损。应适当配合趋势判断指标使用。
-
纯机械交易策略,无法根据市场情况灵活调整参数,存在过优化风险。
-
回测数据不足,无法完全反映实盘表现。实盘时应适当调整参数,严格控制止损。
-
优化CCI的参数,测试不同长度周期的参数效果。
-
优化EMA参数,寻找最佳的EMA周期长度。
-
测试不同的买卖点参数组合,找到最优参数。
-
结合其他指标判断趋势反转,设置止损位来避免亏损扩大。
-
添加自动参数优化功能,根据不同品种自动寻找最优参数组合。
本策略整体来说是一个较为简单的趋势跟随交易策略。它利用CCI判断趋势方向且对价格变化敏感,配合EMA进行滤波从而产生交易信号。策略具有一定的优势,但也存在一些风险需要注意。通过参数优化以及配合使用其他指标,可以进一步提高策略稳定性和实盘表现。总体来说,本策略为量化交易提供了一个简单可靠的趋势跟随策略模板。
||
The core idea of this strategy is to use the CCI indicator to determine the market trend direction and use the EMA indicator to smooth the CCI to implement trend following trading. Go long when the CCI crosses above the buy point and go short when the CCI crosses below the sell point to follow the market trend.
-
Calculate the CCI indicator. The CCI indicator judges whether the current stock price is overbought or oversold based on the degree of deviation from the 20-day moving average. The formula is: (typical price - 20D SMA) / (0.015 * 20D TP standard deviation).
-
Smooth the CCI indicator with an EMA to get a CCI-EMA curve, which reduces the fluctuation of the CCI and makes the signal clearer.
-
Set the buy and sell points for CCI. Go long when CCI-EMA crosses above the buy point, and go short when CCI-EMA crosses below the sell point.
-
Hold the position until CCI-EMA touches the buy or sell point again to close the position.
-
Using CCI to determine market trend direction combined with EMA to filter false signals can effectively follow market trends.
-
CCI is sensitive to price anomalies and can quickly capture trend reversals. EMA reduces false signals. Used together, they can seize opportunities at the beginning of trends.
-
Trend following strategies minimize transactions, reduce trading costs and slippage.
-
The backtest results are decent, giving the strategy some practical viability.
-
CCI can be overly sensitive to curves and EMA cannot completely filter all false signals, some false signals remain.
-
Pure trend following strategies are prone to losses when trends consolidate or reverse. Trend judgment indicators should be used.
-
Mechanical trading systems cannot flexibly adjust parameters based on markets. Over optimization is a risk.
-
Limited backtest data cannot fully reflect live performance. Parameters should be adjusted carefully and stops managed strictly.
-
Optimize CCI parameters by testing different length periods.
-
Optimize EMA parameters to find the optimal EMA period.
-
Test different buy/sell point combinations to find the optimal parameters.
-
Incorporate other indicators to determine trend reversal and set stop losses.
-
Add auto parameter optimization to find the optimal parameters for different products.
Overall this is a relatively simple trend following trading strategy. It uses CCI to determine trend direction and is sensitive to price changes, combined with EMA filtering to generate signals. The strategy has some advantages but also risks to note. Through parameter optimization and using other indicators, the stability and live performance can be further improved. Overall it provides a simple and reliable trend following template for quant trading.
[/trans]
Strategy Arguments
| Argument | Default | Description |
|---|---|---|
| v_input_1 | 20 | length |
| v_input_2_close | 0 | Source: close |
| v_input_3 | false | CCI Sell Point |
| v_input_4 | false | CCI Buy Buy Point |
| v_input_5 | 12 | length cci ema |
Source (PineScript)
/*backtest
start: 2023-10-02 00:00:00
end: 2023-11-01 00:00:00
period: 1h
basePeriod: 15m
exchanges: [{"eid":"Futures_Binance","currency":"BTC_USDT"}]
*/

//@version=4
strategy("CCI with EMA Strategy", overlay=false, pyramiding=1, default_qty_type= strategy.percent_of_equity, default_qty_value = 100, calc_on_order_fills=false, slippage=0,commission_type=strategy.commission.percent,commission_value=0.07)

length = input(20, minval=1)
src = input(close, title="Source")
cciSellPoint = input(0, title = 'CCI Sell Point', type = input.integer)
cciBuyPoint = input(0, title = 'CCI Buy Buy Point', type = input.integer)
lengthcci = input(12,"length cci ema", minval=1)

ma = sma(src, length)
cci = (src - ma) / (0.015 * dev(src, length))
cciema=ema(cci,lengthcci)
plot(cci, "CCI", color=#996A15)
plot(cciSellPoint, title = 'CCI  Sell Point', color = color.red, linewidth = 1, style = plot.style_cross, transp = 35)
plot(cciBuyPoint, title = 'CCI Buy Point', color = color.green, linewidth = 1, style = plot.style_cross, transp = 35)
plot(cciema, title = 'CCI EMA', color = color.green, linewidth = 1, transp = 35)
band1 = hline(100, "Upper Band", color=#C0C0C0, linestyle=hline.style_dashed)
band0 = hline(-100, "Lower Band", color=#C0C0C0, linestyle=hline.style_dashed)
fill(band1, band0, color=#9C6E1B, title="Background")

startLongTrade=  cciema >cciBuyPoint
startShortTrade= cciema <cciSellPoint

//exitLong = cciema <cciSellPoint
//exitShort = cciema >cciBuyPoint

strategy.entry("long",strategy.long, when = startLongTrade )
//strategy.close( "long", when=exitLong)
strategy.entry("short",strategy.short,when=startShortTrade )
//strategy.close("short", when=exitShort)
Detail
https://www.fmz.com/strategy/430858
Last Modified
2023-11-02 15:17:22
