Name
基于CMO和WMA的动量交易策略Momentum-Trading-Strategy-Based-on-CMO-and-WMA
Author
ChaoZhang
Strategy Description
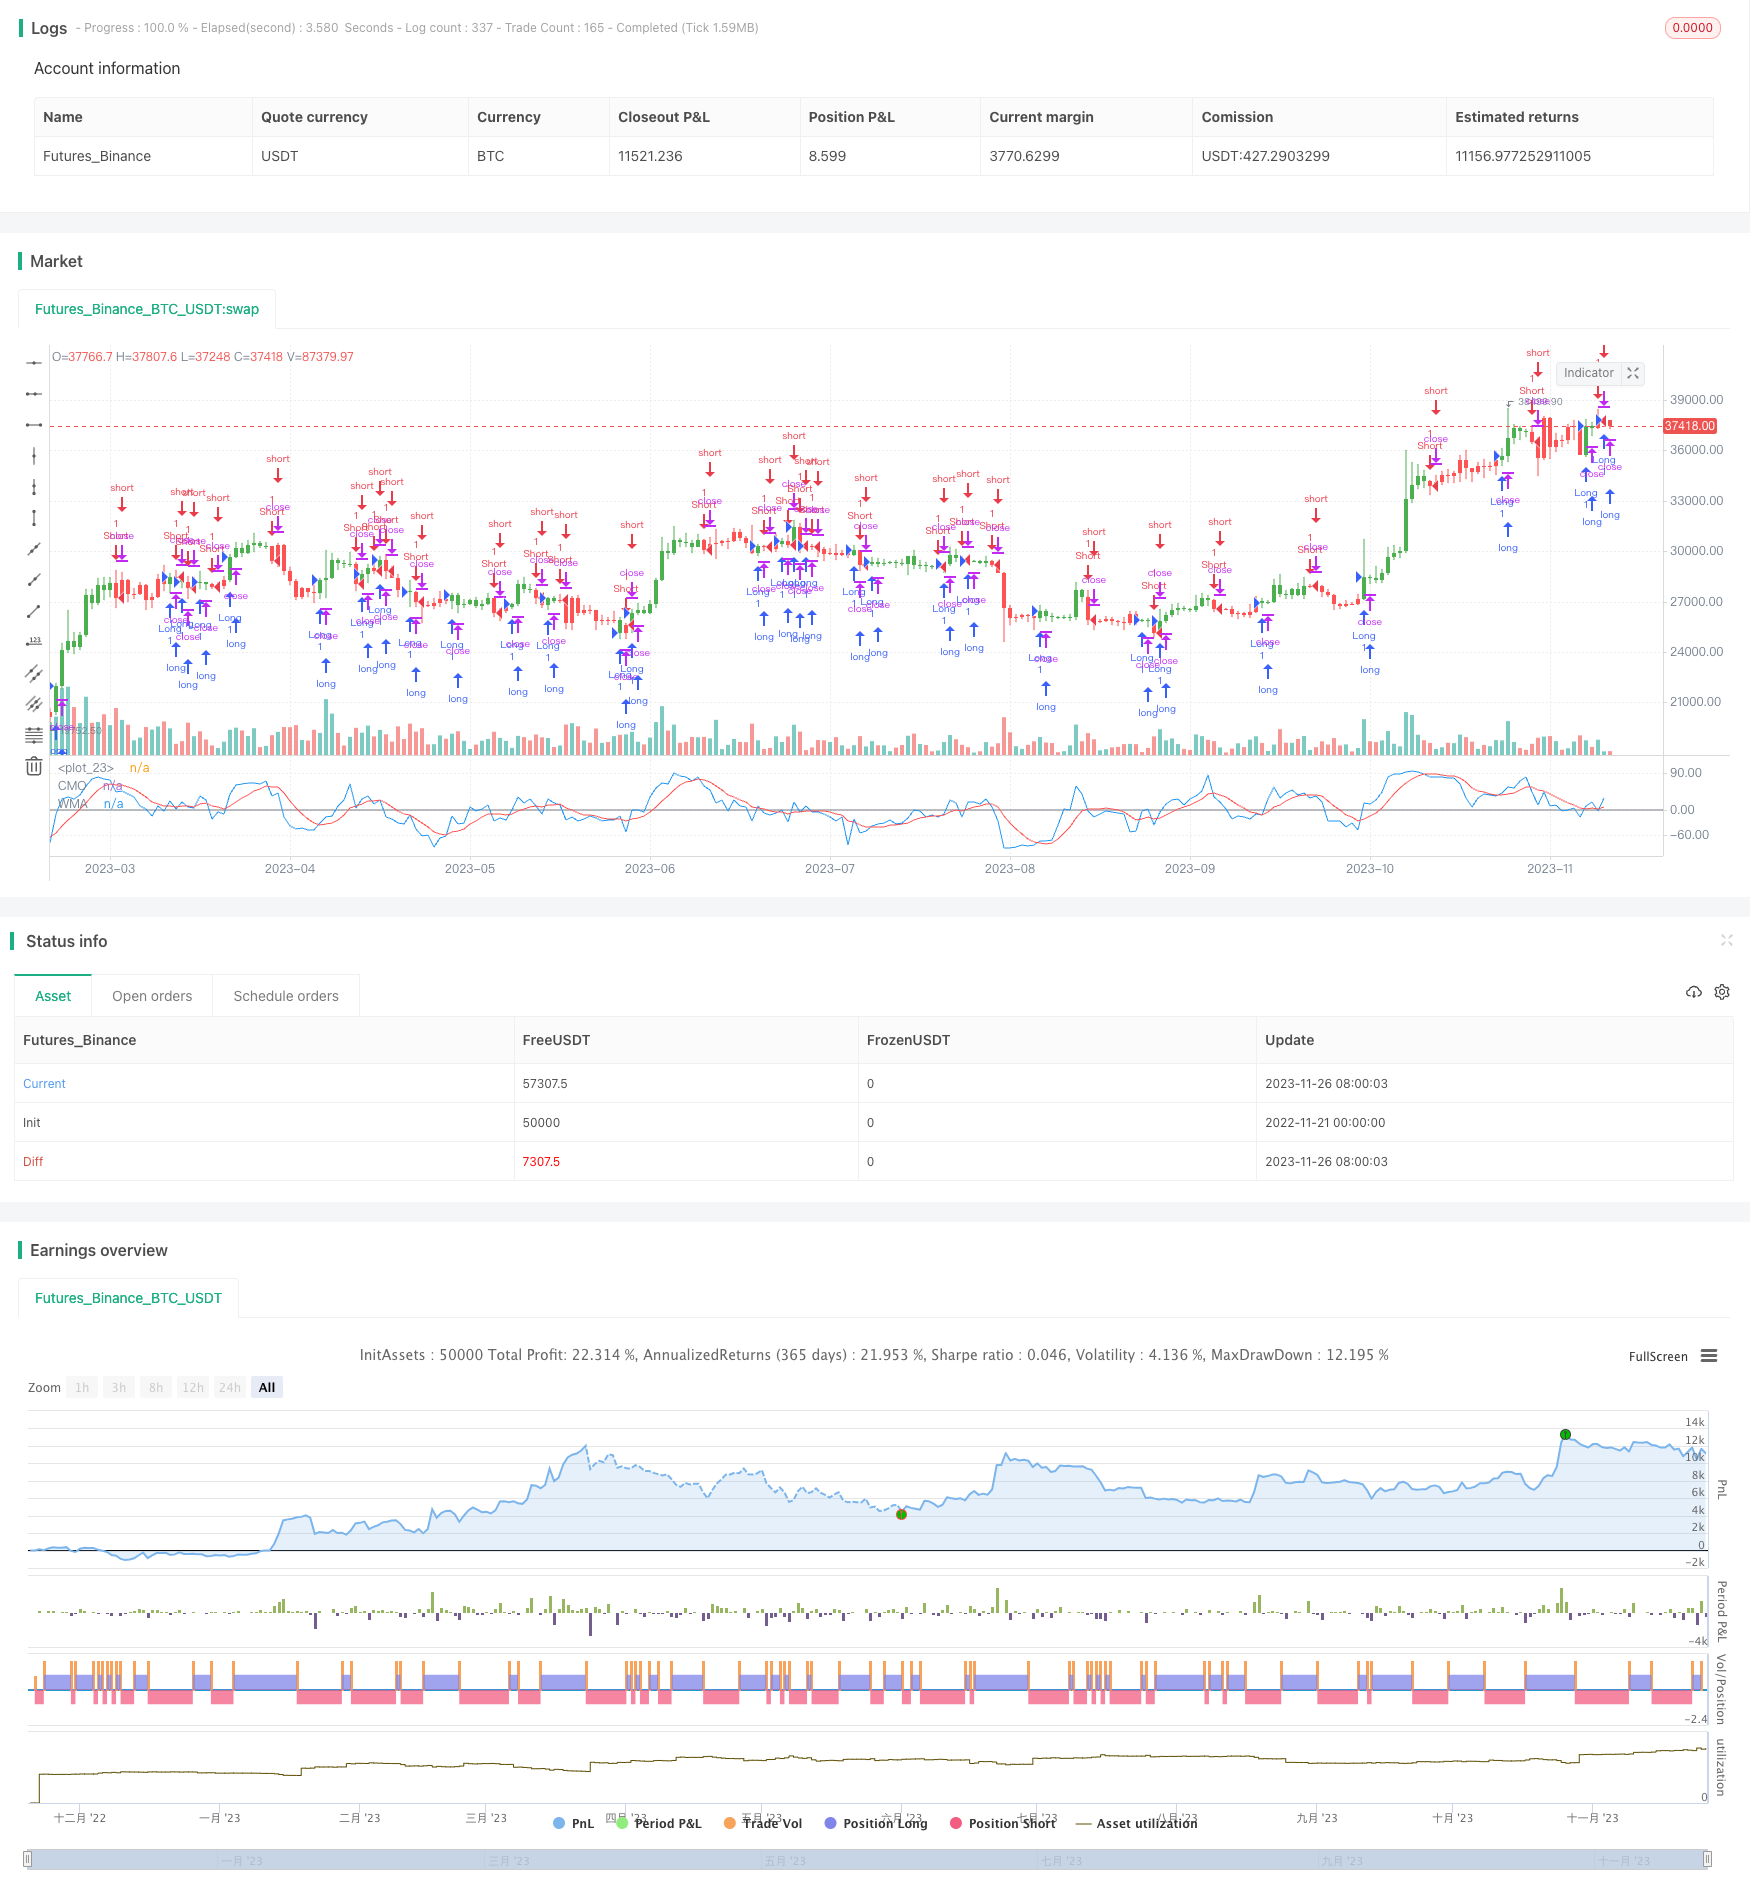
该策略名称为“基于CMO和WMA的动量交易策略”。该策略利用Chande Momentum Oscillator(CMO)和其加权移动平均线(WMA)构建交易信号。核心思想是当CMO上穿其WMA时做多,下穿其WMA时做空。同时考虑反向交易的选项。
该策略的核心指标是CMO。CMO与RSI等其他动量指标关系密切,但也有独特之处。CMO直接测量价格变化momentum。其计算基于原始未经平滑的数据,所以能反映短期极端价格变动。CMO数值范围固定在+100至-100之间,所以方便比较不同股的绝对momentum大小。
该策略首先计算 close 价格的单日变化abs(close - close[1])作为原始momentum xMom。然后计算xMom的Length天SMA,记为xSMA_mom。然后计算Length天价格变化xMomLength,即close - close[Length]。最后CMO值为xMomLength除以xSMA_mom再乘100。该CMO通过WMA(参数LengthWMA)得到平滑后CMO xWMACMO。策略信号为:当CMO上穿(下穿)其WMA时做多(空)。
该策略最大优势是捕捉价格趋势中的动量特征。CMO的有界设计使其更直接反映动量变化。相比SMA,WMA更能平滑掉短期噪声。所以该策略能有效识别中长线趋势中的入场点。另外相比单一指标,组合使用CMO和WMA更能提高稳定性。
该策略最大风险在于频繁交易带来的滑点成本。CMO和WMA都是短期参数,可能过于灵敏而产生多次无谓反转。这在品种波动较大时尤为严重。此外,固定参数无法适应市场环境的变化。
可以考虑引入自适应参数优化CMO和WMA的参数,使其能动态调整;或者增加过滤条件减少无谓交易。当然降低品种波动性通过组合也是一个选择。
该策略可以从以下几个方面进行优化:
-
增加自适应CMO参数机制。不同波动环境下找到最优参数;
-
增加自适应WMA参数机制。平滑效果随波动性变化;
-
增加过滤条件,如引入Volatility Index等,控制无谓反转;
-
考虑与其它 indictor 的组合,提高稳定性;
5.优化止损机制。设定动态止损线,主动控制单轮损失。
该策略基于CMO和WMA实现简单有效的趋势追踪。策略优势是清晰抓取价格动量特征。但也存在一定盈利后持仓能力差的缺点。通过参数优化和组合都能很好提高稳定性。总体而言,该策略具有很大改进空间和价值。
||
The strategy is named "Momentum Trading Strategy Based on CMO and WMA". It utilizes Chande Momentum Oscillator (CMO) and its Weighted Moving Average (WMA) to construct trading signals. The core idea is to go long when CMO crosses above its WMA and go short when crossing below. It also considers the option of reverse trading.
The core indicator of this strategy is CMO. CMO is closely related to other momentum indicators like RSI, but also has its uniqueness. CMO directly measures price change momentum. Its calculation is based on raw unsmoothed data, so it reflects extreme short-term price changes. The CMO value ranges from +100 to -100, which makes it convenient to compare absolute momentum strength across securities.
The strategy first calculates the one-day price change abs(close - close[1]) as the original momentum xMom. Then it calculates the SMA of xMom over Length days, denoted as xSMA_mom. After that, it calculates the price change over Length days xMomLength, namely close - close[Length]. Finally, CMO is calculated as xMomLength divided by xSMA_mom then multiplied by 100. This CMO is smoothed by a WMA (parameter LengthWMA) to derive xWMACMO. The trading signal is to go long (short) when CMO crosses above (below) its WMA.
The biggest advantage of this strategy is capturing momentum characteristics within price trends. The bounded design of CMO reflects momentum changes more directly. Compared to SMA, WMA smoothes out short-term noise better. So this strategy can effectively identify entry points within medium-to-long term trends. In addition, the combination of CMO and WMA provides better stability than a single indicator.
The biggest risk of this strategy is the high trading frequency leading to increased slippage costs. Both CMO and WMA have short-term parameters, which may cause excessive meaningless whipsaws. This is especially severe when the trading vehicle has large fluctuations. In addition, fixed parameters fail to adapt to changing market environments.
We can consider introducing adaptive optimization of CMO and WMA parameters, enabling them to adjust dynamically. Adding filter conditions to reduce unnecessary trading is another option. Lowering volatility via portfolio diversification also helps.
The strategy can be enhanced from the following aspects:
-
Add adaptive CMO parameter mechanism to find optimal parameters for different volatility regimes;
-
Add adaptive WMA parameter mechanism so the smoothing effect changes accordingly;
-
Add filter conditions such as Volatility Index to control meaningless whipsaws;
-
Consider combining with other indicators to improve stability;
-
Optimize stop loss mechanism. Set dynamic stop loss line to actively control single round loss.
The strategy realizes simple and effective trend following based on CMO and WMA. Its advantage lies in clearly capturing price momentum characteristics. But it also has some weakness in profit retention capability after opening positions. Both parameter tuning and combo can greatly improve stability. Overall, this strategy has lots of room and value for improvement.
[/trans]
Strategy Arguments
| Argument | Default | Description |
|---|---|---|
| v_input_1 | 9 | Length |
| v_input_2 | 9 | LengthWMA |
| v_input_3 | false | Trade reverse |
Source (PineScript)
/*backtest
start: 2022-11-21 00:00:00
end: 2023-11-27 00:00:00
period: 1d
basePeriod: 1h
exchanges: [{"eid":"Futures_Binance","currency":"BTC_USDT"}]
*/

//@version=2
////////////////////////////////////////////////////////////
//  Copyright by HPotter v1.0 13/02/2017
//    This indicator plots Chandre Momentum Oscillator and its WMA on the
//    same chart. This indicator plots the absolute value of CMO.
//    The CMO is closely related to, yet unique from, other momentum oriented
//    indicators such as Relative Strength Index, Stochastic, Rate-of-Change,
//    etc. It is most closely related to Welles Wilder?s RSI, yet it differs
//    in several ways:
//    - It uses data for both up days and down days in the numerator, thereby
//        directly measuring momentum;
//    - The calculations are applied on unsmoothed data. Therefore, short-term
//        extreme movements in price are not hidden. Once calculated, smoothing
//        can be applied to the CMO, if desired;
//    - The scale is bounded between +100 and -100, thereby allowing you to clearly
//        see changes in net momentum using the 0 level. The bounded scale also allows
//        you to conveniently compare values across different securities.
////////////////////////////////////////////////////////////
strategy(title="CMO & WMA", shorttitle="CMO & WMA")
Length = input(9, minval=1)
LengthWMA = input(9, minval=1)
reverse = input(false, title="Trade reverse")
hline(0, color=gray, linestyle=line)
xMom = abs(close - close[1])
xSMA_mom = sma(xMom, Length)
xMomLength = close - close[Length]
nRes = 100 * (xMomLength / (xSMA_mom * Length))
xWMACMO = wma(nRes, LengthWMA)
pos = iff(nRes > xWMACMO, 1,
	   iff(nRes <= xWMACMO, -1, nz(pos[1], 0)))
possig = iff(reverse and pos == 1, -1,
         iff(reverse and pos == -1, 1, pos))
if (possig == 1)
    strategy.entry("Long", strategy.long)
if (possig == -1)
    strategy.entry("Short", strategy.short)
barcolor(possig == -1 ? red: possig == 1 ? green : blue)
plot(nRes, color=blue, title="CMO")
plot(xWMACMO, color=red, title="WMA")
Detail
https://www.fmz.com/strategy/433583
Last Modified
2023-11-28 16:42:54
