Name
基于EMA和隐藏背离的趋势追踪策略EMA-RSI-Hidden-Divergence-Trend-Following-Strategy
Author
ChaoZhang
Strategy Description
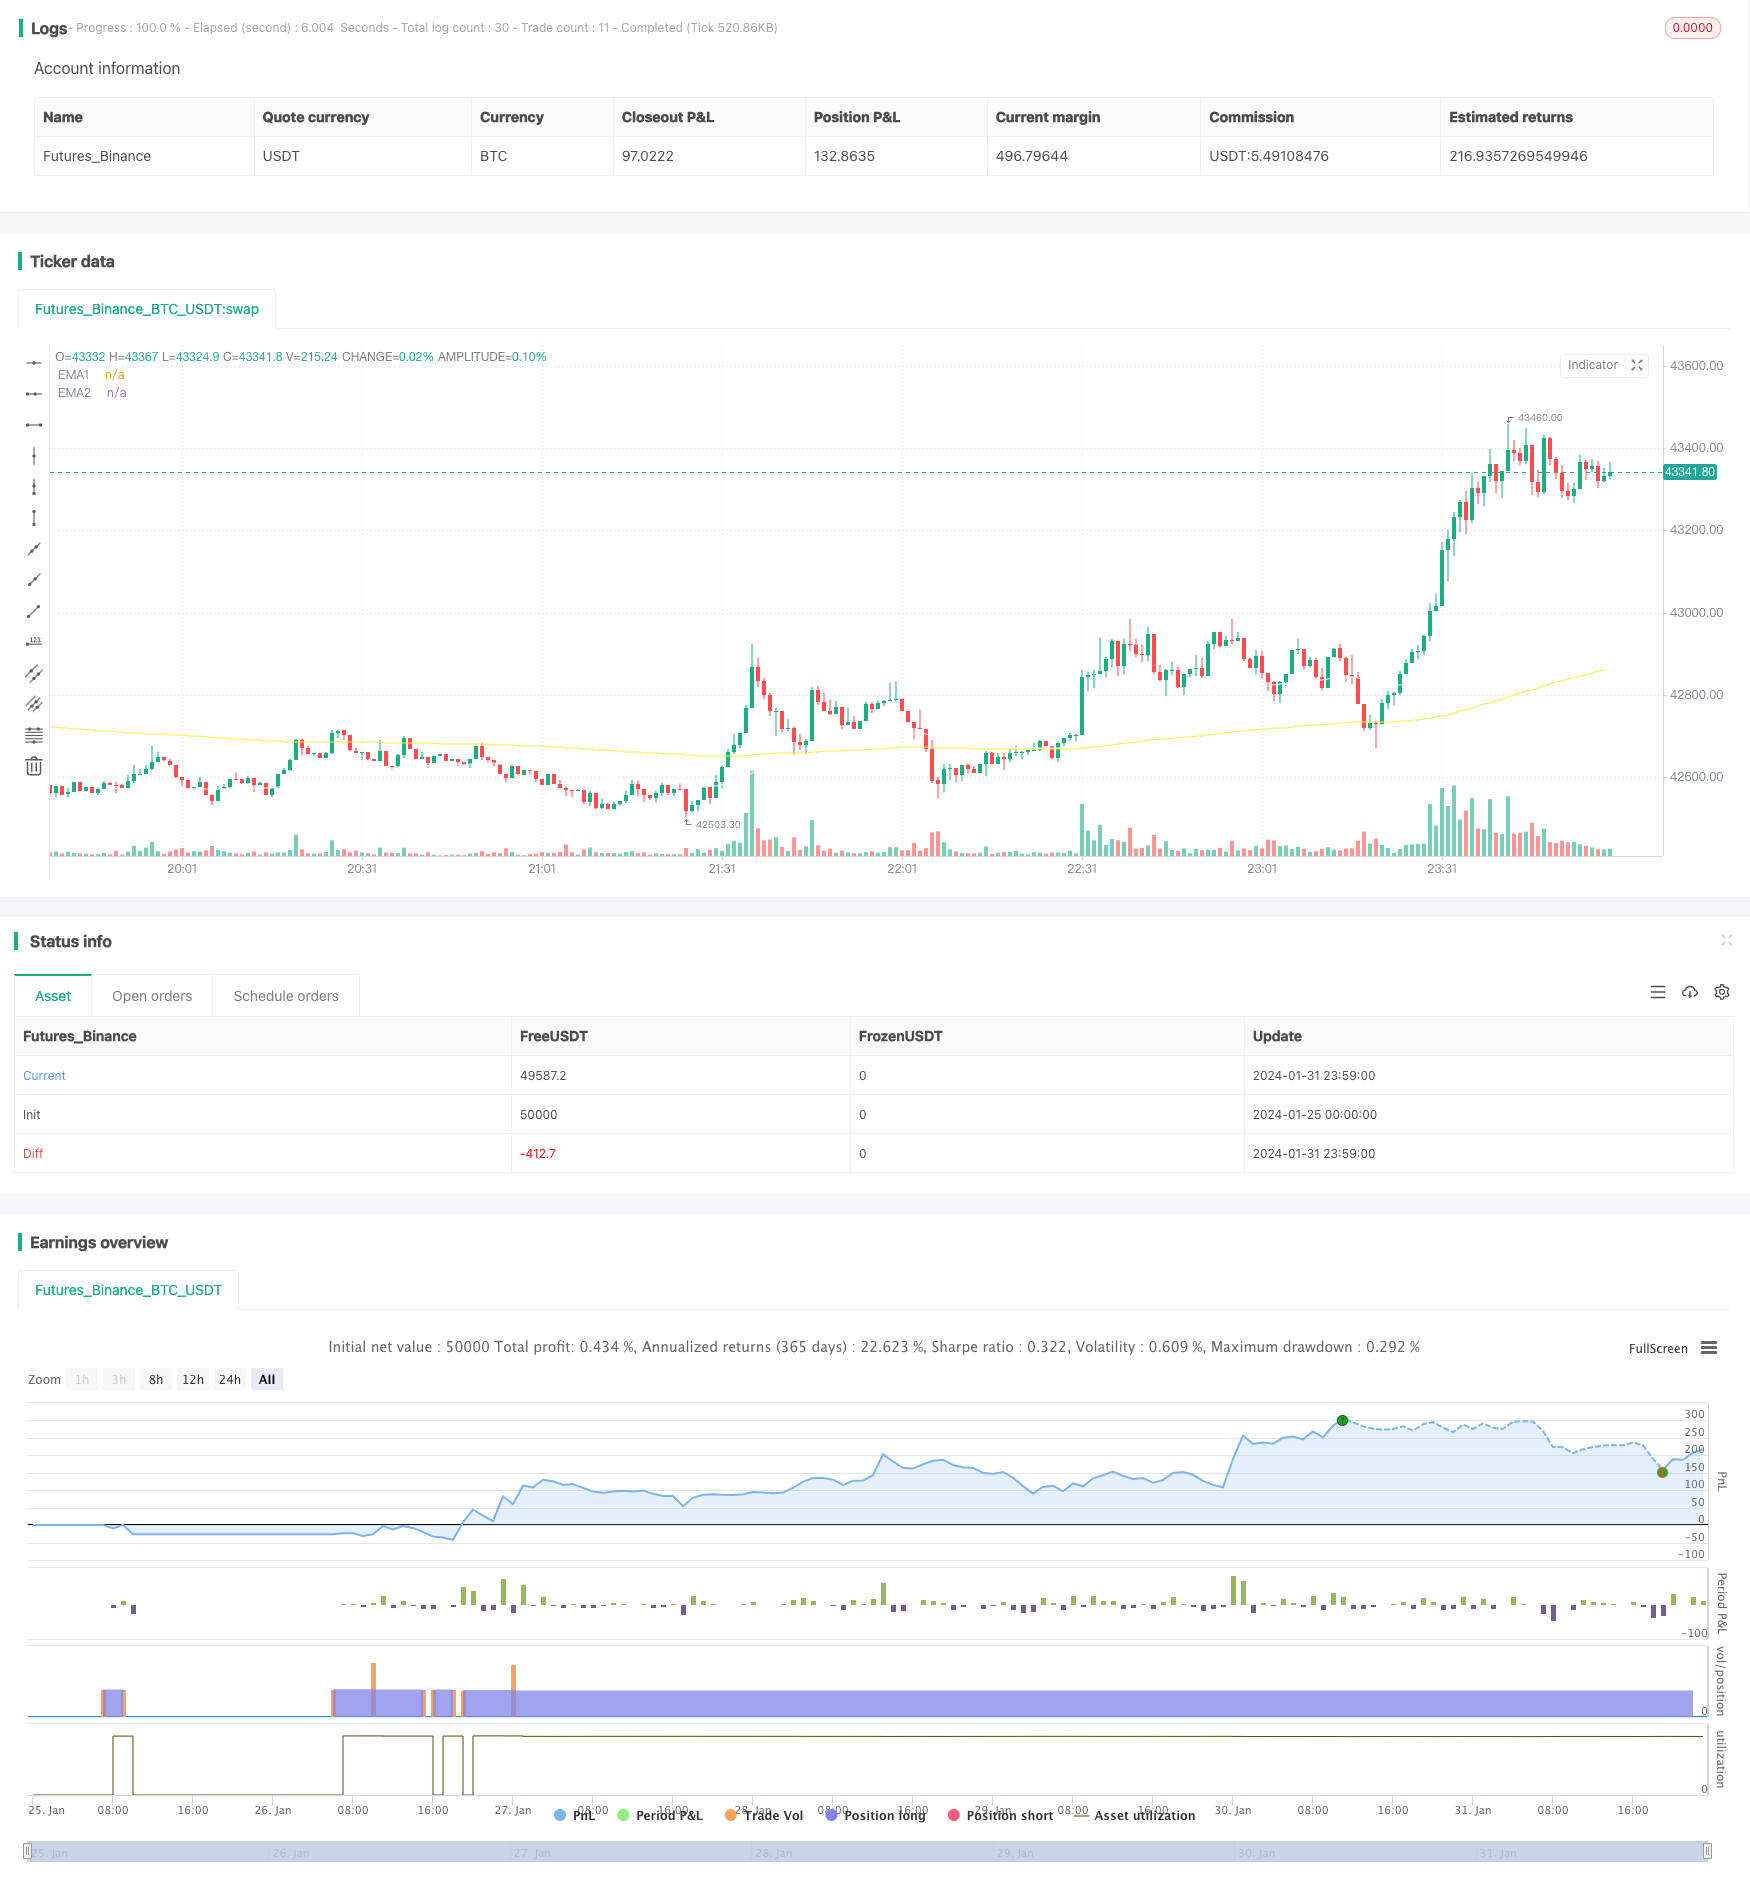
本策略基于EMA均线和RSI指标的隐藏背离信号开启多头仓位,通过识别隐藏多头背离形成的特征点,判断当前处于上升趋势的开始,作为开仓信号。同时,结合EMA均线的黄金交叉以及K线收盘价格位于EMA均线之上,可确保趋势向上。此策略适合追踪中长线趋势,在盘整结束后的重新上涨阶段打开多头仓位。
-
EMA均线策略:利用50周期与250周期EMA均线进行黄金交叉判断趋势,价格上穿50EMA时视为多头信号。
-
RSI隐藏背离策略:RSI指标出现较低低点,而价格出现较高低点的隐藏多头背离信号,预示着反转的开始。配合限定背离点数量,可过滤假信号。
-
K线收盘策略:K线收盘价格超过50EMA时开仓做多。
综合以上三个策略判断当前为趋势开始上涨点,开启做多仓位。
-
使用EMA均线判断趋势方向,配合RSI指标的反转信号,可在趋势开始阶段打开仓位。
-
双重确认机制,利用EMA、RSI和K线收盘价格的组合判断,可有效过滤假信号。
-
追踪中长线趋势,适合在盘整后判断新的上涨趋势开始。
-
EMA均线产生死叉时,需要及时平仓。
-
RSI隐藏背离信号判断需要一定的经验,参数设置不当可能错过信号或判断错误。
-
对交易品种的参数需要优化设置。
-
动态调整EMA均线的参数,优化判断趋势的精准度。
-
调整RSI参数,优化判断隐藏背离的准确性。
-
加入止损机制,利用ATR止损或百分比止损等方式控制风险。
-
开发空头交易策略,使策略可在下跌趋势中打开空头做空仓位。
本策略综合运用EMA均线判断大趋势,配合RSI指标增加判断准确性,在盘整结束后判断新的上涨趋势开始,属于较为保守的趋势追踪策略。通过优化参数设置以及加入止损手段,能够获得较好的效果。与简单的移动平均线策略相比,判断上涨趋势的准确性更高,胜率会较高,属于实用型策略。
||
This strategy opens long positions based on the EMA crossover and RSI hidden bullish divergence signals to identify the beginning of an upward trend. The combination of EMA lines, RSI indicator, and K-line closing prices provides double confirmation for ensuring an upward momentum. This strategy is suitable to follow mid-long term trends and open long positions after price consolidations.
-
EMA Strategy: Using the golden cross of 50-period EMA and 250-period EMA to determine the trend direction. A close above the 50 EMA gives a long signal.
-
RSI Hidden Divergence Strategy: The RSI forms lower lows while price forms higher lows, signaling a trend reversal at the beginning. Limiting the number of pivot points filters out false signals.
-
K-line Closing Strategy: Go long when the closing price is above the 50 EMA line.
The combination of the above three strategies identifies the start of an upward trend and opens long positions accordingly.
-
Using EMA lines to determine trend direction along with RSI reversal signals allows early entry at the beginning of trends.
-
The dual confirmation from EMA lines, RSI indicator, and K-line closing prices effectively filters out false signals.
-
Following mid-long term trends makes it suitable to identify new up trends after consolidations.
-
Close positions when the EMA lines have a death cross.
-
Identifying RSI hidden divergences needs experience, improper parameter tuning could lead to missing or false signals.
-
Parameters need optimization for different trading instruments.
-
Dynamically adjust EMA parameters for better trend determination accuracy.
-
Fine tune RSI parameters for better hidden divergence signal accuracy.
-
Add stop loss mechanisms like ATR or percentage stops to control risks.
-
Develop strategies for short positions to trade downward trends.
This strategy combines EMA lines for trend determination and RSI signals for increase accuracy. It identifies new upward trends after consolidations. With proper parameter tuning and risk management, it could achieve good results. Compared to simple moving average strategies, it has higher accuracy in catching trends with better win rates. Overall it is a practical trend following strategy.
[/trans]
Strategy Arguments
| Argument | Default | Description |
|---|---|---|
| v_input_1 | true | FromMonth |
| v_input_2 | true | FromDay |
| v_input_3 | 2020 | FromYear |
| v_input_4 | true | ToMonth |
| v_input_5 | true | ToDay |
| v_input_6 | 9999 | ToYear |
| v_input_7 | 50 | EMA1 |
| v_input_8 | 250 | EMA2 |
| v_input_9 | 4 | K |
| v_input_10 | 4 | D |
| v_input_11 | 3 | Smooth |
| v_input_12 | 14 | RSI Period |
| v_input_13_close | 0 | RSI Source: close |
| v_input_14 | true | Pivot Lookback Right |
| v_input_15 | 19 | Pivot Lookback Left |
| v_input_16 | 20 | Max of Lookback Range |
| v_input_17 | 4 | Min of Lookback Range |
| v_input_18 | 1.6 | Profitfactor |
| v_input_19 | 38 | Lowest Low Lookback |
Source (PineScript)
/*backtest
start: 2024-01-25 00:00:00
end: 2024-02-01 00:00:00
period: 1m
basePeriod: 1m
exchanges: [{"eid":"Futures_Binance","currency":"BTC_USDT"}]
*/

//@version=4

strategy(title="EMA RSI ATR Hidden Div Strat", shorttitle="Hidden Div Strat", overlay = true, pyramiding = 0, max_bars_back=3000, calc_on_order_fills = false, commission_type =  strategy.commission.percent, commission_value = 0, default_qty_type = strategy.percent_of_equity, default_qty_value = 10, initial_capital=5000, currency=currency.USD)

// Time Range
FromMonth=input(defval=1,title="FromMonth",minval=1,maxval=12)
FromDay=input(defval=1,title="FromDay",minval=1,maxval=31)
FromYear=input(defval=2020,title="FromYear",minval=2016)
ToMonth=input(defval=1,title="ToMonth",minval=1,maxval=12)
ToDay=input(defval=1,title="ToDay",minval=1,maxval=31)
ToYear=input(defval=9999,title="ToYear",minval=2017)
start=timestamp(FromYear,FromMonth,FromDay,00,00)
finish=timestamp(ToYear,ToMonth,ToDay,23,59)
window()=>true

// Bar's time happened on/after start date?
afterStartDate = time >= start and time<=finish?true:false

//EMA'S
emasrc = close

len1 = input(50, minval=1, title="EMA1")
ema1 = ema(emasrc, len1)
col1 = color.white

len2 = input(250, minval=1, title="EMA2")
ema2 = ema(emasrc, len2)
col2 = color.yellow

//Plots
plot(ema1, title="EMA1", linewidth=1, color=col1)
plot(ema2, title="EMA2", linewidth=1, color=col2)

//Stoch
periodK = input(4, title="K", minval=1)
periodD = input(4, title="D", minval=1)
smoothK = input(3, title="Smooth", minval=1)
k = sma(stoch(close, high, low, periodK), smoothK)
d = sma(k, periodD)

//Hidden Divergence Indikator

len = input(title="RSI Period", minval=1, defval=14)
src = input(title="RSI Source", defval=close)
lbR = input(title="Pivot Lookback Right", defval=1)
lbL = input(title="Pivot Lookback Left", defval=19)
rangeUpper = input(title="Max of Lookback Range", defval=20)
rangeLower = input(title="Min of Lookback Range", defval=4)
hiddenBullColor = color.new(color.green, 80)
textColor = color.white
noneColor = color.new(color.white, 100)
osc = rsi(src, len)

plFound = na(pivotlow(osc, lbL, lbR)) ? false : true
phFound = na(pivothigh(osc, lbL, lbR)) ? false : true
_inRange(cond) =>
	bars = barssince(cond == true)
	rangeLower <= bars and bars <= rangeUpper

//------------------------------------------------------------------------------
// Hidden Bullish
// Osc: Lower Low

oscLL = osc[lbR] < valuewhen(plFound, osc[lbR], 1) and _inRange(plFound[1])

// Price: Higher Low

priceHL = low[lbR] > valuewhen(plFound, low[lbR], 1)
hiddenBullCond = priceHL and oscLL and plFound

//buy Conditions
buyhiddenbull = hiddenBullCond[1] or hiddenBullCond[2] or hiddenBullCond[3] or hiddenBullCond[4] or hiddenBullCond[5] or hiddenBullCond[6] or hiddenBullCond[7] or hiddenBullCond[8] or hiddenBullCond[9] or hiddenBullCond[10]
emacondition = ema1 > ema2
upcondition = close[1] > ema1[1] and ema2[1] and close[2] > ema1[2] and ema2[2] and close[3] > ema1[3] and ema2[3]
crossup = k[0] >= d[0] and k[1] <= d[1]
longcondition = emacondition and upcondition and crossup and buyhiddenbull

if (afterStartDate)
    strategy.entry("Long", strategy.long, when = longcondition)

//TakeProfit, StopLoss lowest low
profitfactor = input(title="Profitfactor", type=input.float, step=0.1, defval=1.6)
loLen = input(title="Lowest Low Lookback", type=input.integer,
  defval=38, minval=2)
stop_level = lowest(low, loLen)[1]
bought = strategy.position_size[1] < strategy.position_size
barsbought = barssince(bought)

if strategy.position_size>0
    profit_level = strategy.position_avg_price + ((strategy.position_avg_price - stop_level[barsbought])*profitfactor)
    strategy.exit(id="TP/ SL", stop=stop_level[barsbought], limit=profit_level)
Detail
https://www.fmz.com/strategy/440847
Last Modified
2024-02-02 16:54:27
