Name
基于EMA均线交叉的短期量化交易策略Quantitative-Trading-Strategy-Based-on-EMA-Crossover
Author
ChaoZhang
Strategy Description
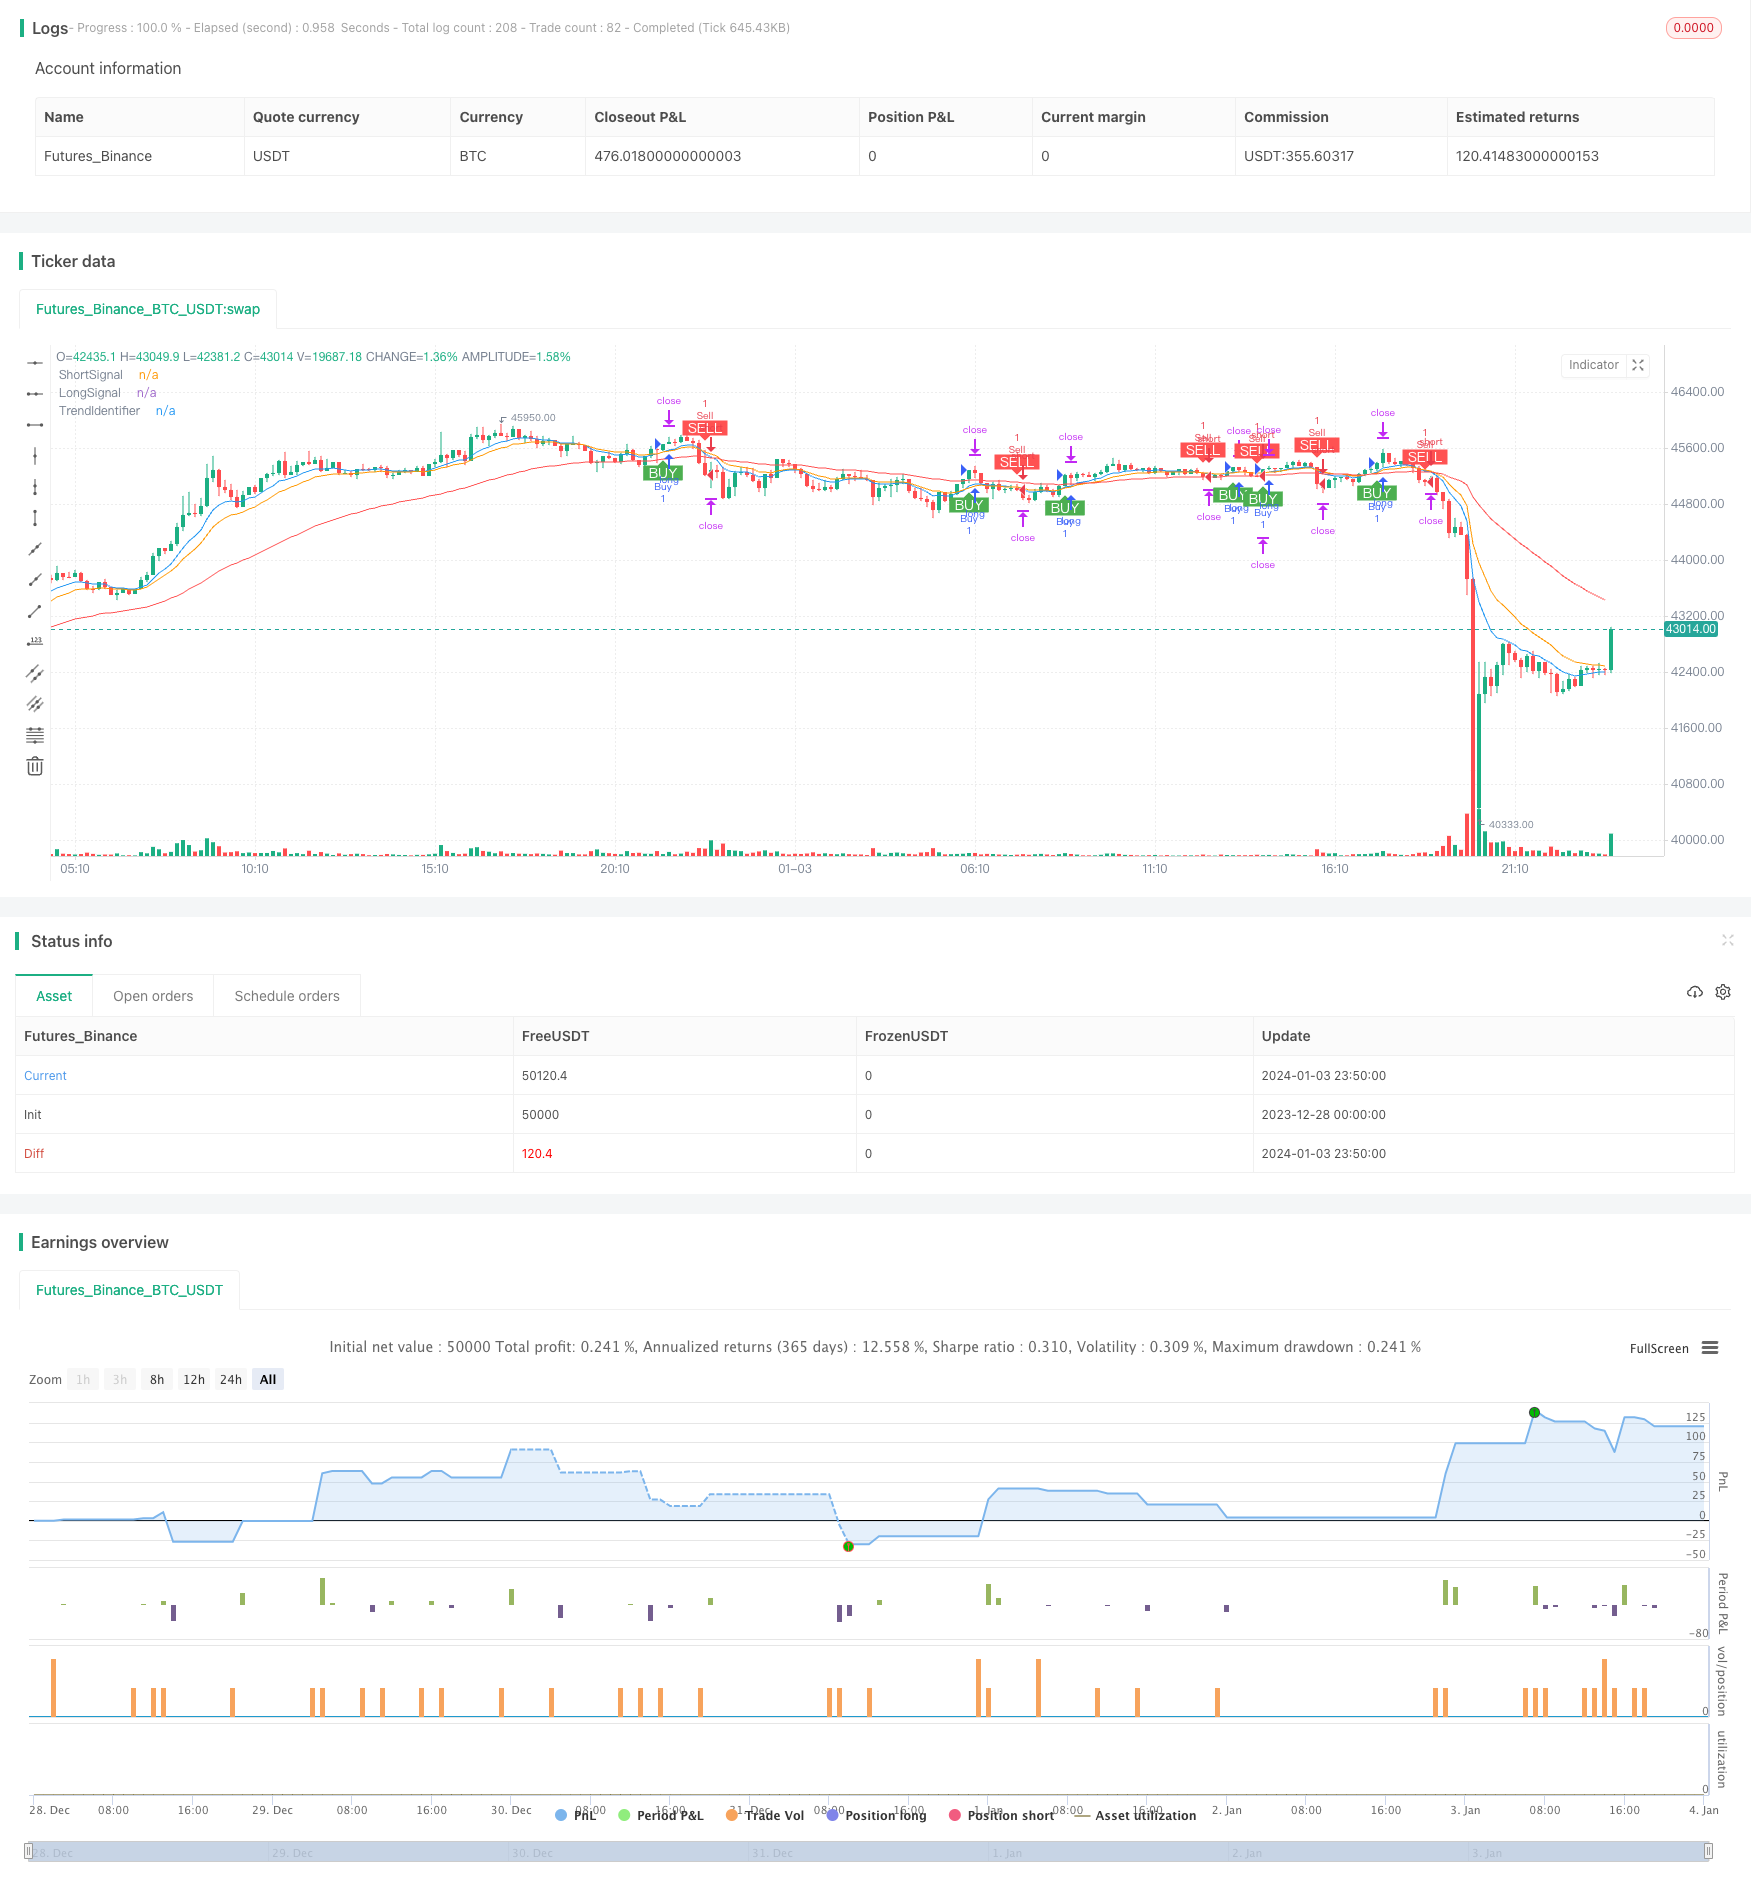
本策略名为“基于EMA均线交叉的短期量化交易策略”。该策略运用9日线、15日线与50日线的EMA均线交叉原理,在1分钟到5分钟的短期时间周期内进行交易,以捕捉短期价格趋势,实现快速进入和退出。
该策略使用9日EMA均线、15日EMA均线和50日EMA均线。9日EMA均线和15日EMA均线的交叉用于生成买入和卖出信号。当9日EMA均线上穿15日EMA均线时,产生买入信号;当9日EMA均线下穿15日EMA均线时,产生卖出信号。50日EMA均线用于判断整体趋势方向,只有在价格高于50日EMA均线时才会产生买入信号,只有在价格低于50日EMA均线时才会产生卖出信号。
通过快速EMA均线的交叉以及长期EMA均线的支持,可以捕捉短期价格移动的同时避免逆势操作。 Tak两个短周期均线交叉可确保及时捕捉近期价格变动; 长周期均线可有效过滤震荡局面,避免头痛医头、脚痛医脚。
-
捕捉短期价格趋势:通过两个快速EMA均线的交叉,可以快速捕捉短期价格的变动,实现快进快出。
-
过滤震荡:通过长EMA均线判断整体趋势方向,有效防止逆势操作,避免不必要的止损。
-
参数可调:用户可以根据自己的需要调整EMA均线的周期参数,适应不同的市场环境。
-
易于入门:相对简单的均线交叉思路,容易理解使用。
-
过于灵敏:两个短周期EMA均线过于灵敏,可能产生大量的错误信号。
-
忽略长期趋势:长EMA均线无法完全过滤震荡,依然存在一定概率的逆势操作风险。
-
参数依赖:优化的参数组合依赖于历史数据,无法保证对未来数据同样适用。
-
止损位置不佳:固定的止损点难以把握,可能过于宽松或过于激进。
-
加入 stochastic指标 过滤信号,使用KDJ指标的超买超卖信号辅助EMA均线交叉信号。
-
增加自适应止损机制,根据市场波动程度智能调整止损点。
-
增加参数优化模块,通过遗传算法不断迭代寻找最优参数组合。
-
加入机器学习模型判断趋势和信号准确性,提高策略的稳定性。
本策略通过两个快速EMA均线的交叉产生交易信号,并用一个长周期EMA均线判断整体趋势,目标捕捉短期价格移动。这种短线策略易于理解使用,但也存在一定弊端,如产生过多错误信号、忽略长期趋势等。这些问题都需要通过添加辅助指标、自适应机制和参数优化等方式加以改进,使策略在实盘中更稳定可靠。
||
This strategy is named "Quantitative Trading Strategy Based on EMA Crossover". It utilizes the crossover principles of 9-day, 15-day and 50-day EMA lines to trade within short timeframes between 1-minute and 5-minute, in order to capture short-term price trends for quick entry and exit.
The strategy employs 9-day EMA, 15-day EMA and 50-day EMA. The crossover between 9-day EMA and 15-day EMA generates buy and sell signals. When 9-day EMA crosses above 15-day EMA, a buy signal is generated. When 9-day EMA crosses below 15-day EMA, a sell signal is generated. The 50-day EMA line judges the overall trend direction - buy signals are only generated when price is above 50-day EMA, and sell signals below it.
By utilizing fast EMA crossover and long-term EMA support, the strategy aims to capture short-term price actions while avoiding counter trend operations. The crossover of two fast EMAs ensures timely catching of recent price changes; the long period EMA effectively filters out market noise to prevent loss-making contrarian trades.
-
Captures short-term trends: The crossover of two fast EMAs quickly seizes short-term price movements for swift entry and exit.
-
Filters out noise: Long EMA line judges overall direction to avoid ineffective contrarian trades and unnecessary stop loss.
-
Customizable parameters: Users can tweak EMA periods to adapt to different market conditions per their needs.
-
Easy to adopt: Relatively straightforward EMA crossover logic for facile utilization.
-
Too sensitive: Two fast EMAs may generate excessive false signals.
-
Ignores long-term trends: Long EMA cannot fully filter noise - some contrarian risks remain.
-
Parameter dependency: Optimized parameter reliance on historical data cannot guarantee future viability.
-
Suboptimal stop loss: Fixed stop loss difficult to calibrate - likely too loose or too tight.
-
Add Stochastics indicator to filter signals and employ KDJ overbought-oversold levels to augment EMA crossover signals.
-
Build in adaptive stop loss mechanism based on market volatility levels for intelligent adjustment of stop loss points.
-
Establish parameter optimization module via genetic algorithms for continual iteration towards optimum parameter combinations.
-
Integrate machine learning models to judge trend and signal accuracy, improving strategy resilience.
The strategy generates trade signals through crossover of two fast EMAs, and a long EMA line to determine overall direction, aiming to seize short-term price movements. Such short-term strategies are easy to use but have flaws e.g. excessive false signals, ignoring long-term trends. Solutions include adding auxiliary indicators, adaptive mechanisms and parameter optimization to improve real-life stability.
[/trans]
Source (PineScript)
/*backtest
start: 2023-12-28 00:00:00
end: 2024-01-04 00:00:00
period: 10m
basePeriod: 1m
exchanges: [{"eid":"Futures_Binance","currency":"BTC_USDT"}]
*/

//@version=4
strategy("EMA Crossover Strategy", overlay=true)

// Define the EMAs
shortEma = ema(close, 9)
mediumEma = ema(close, 15)
longEma = ema(close, 50)

// Plot EMAs
plot(shortEma, title="ShortSignal", color=color.blue)
plot(mediumEma, title="LongSignal", color=color.orange)
plot(longEma, title="TrendIdentifier", color=color.red)

// Define the crossover conditions
buyCondition = crossover(shortEma, mediumEma) and close > longEma
sellCondition = crossunder(shortEma, mediumEma) and close < longEma

// Plot labels for crossovers with black text color
plotshape(series=buyCondition, title="Buy Signal", location=location.belowbar, color=color.green, style=shape.labelup, text="BUY", textcolor=color.white)
plotshape(series=sellCondition, title="Sell Signal", location=location.abovebar, color=color.red, style=shape.labeldown, text="SELL", textcolor=color.white)

// Define the strategy conditions
if (buyCondition)
    strategy.entry("Buy", strategy.long)
    strategy.exit("Take Profit", "Buy")

if (sellCondition)
    strategy.entry("Sell", strategy.short)
    strategy.exit("Take Profit", "Sell")

// Run the strategy
strategy.exit("TP/SL", profit=1, loss=0.5)
Detail
https://www.fmz.com/strategy/437765
Last Modified
2024-01-05 14:01:25
