Name
基于EMA平均线双向动态止损的跨行情趋势追踪策略Trend-Following-Strategy-Based-on-Dynamic-Stop-Loss-of-Dual-EMA-Crossover
Author
ChaoZhang
Strategy Description
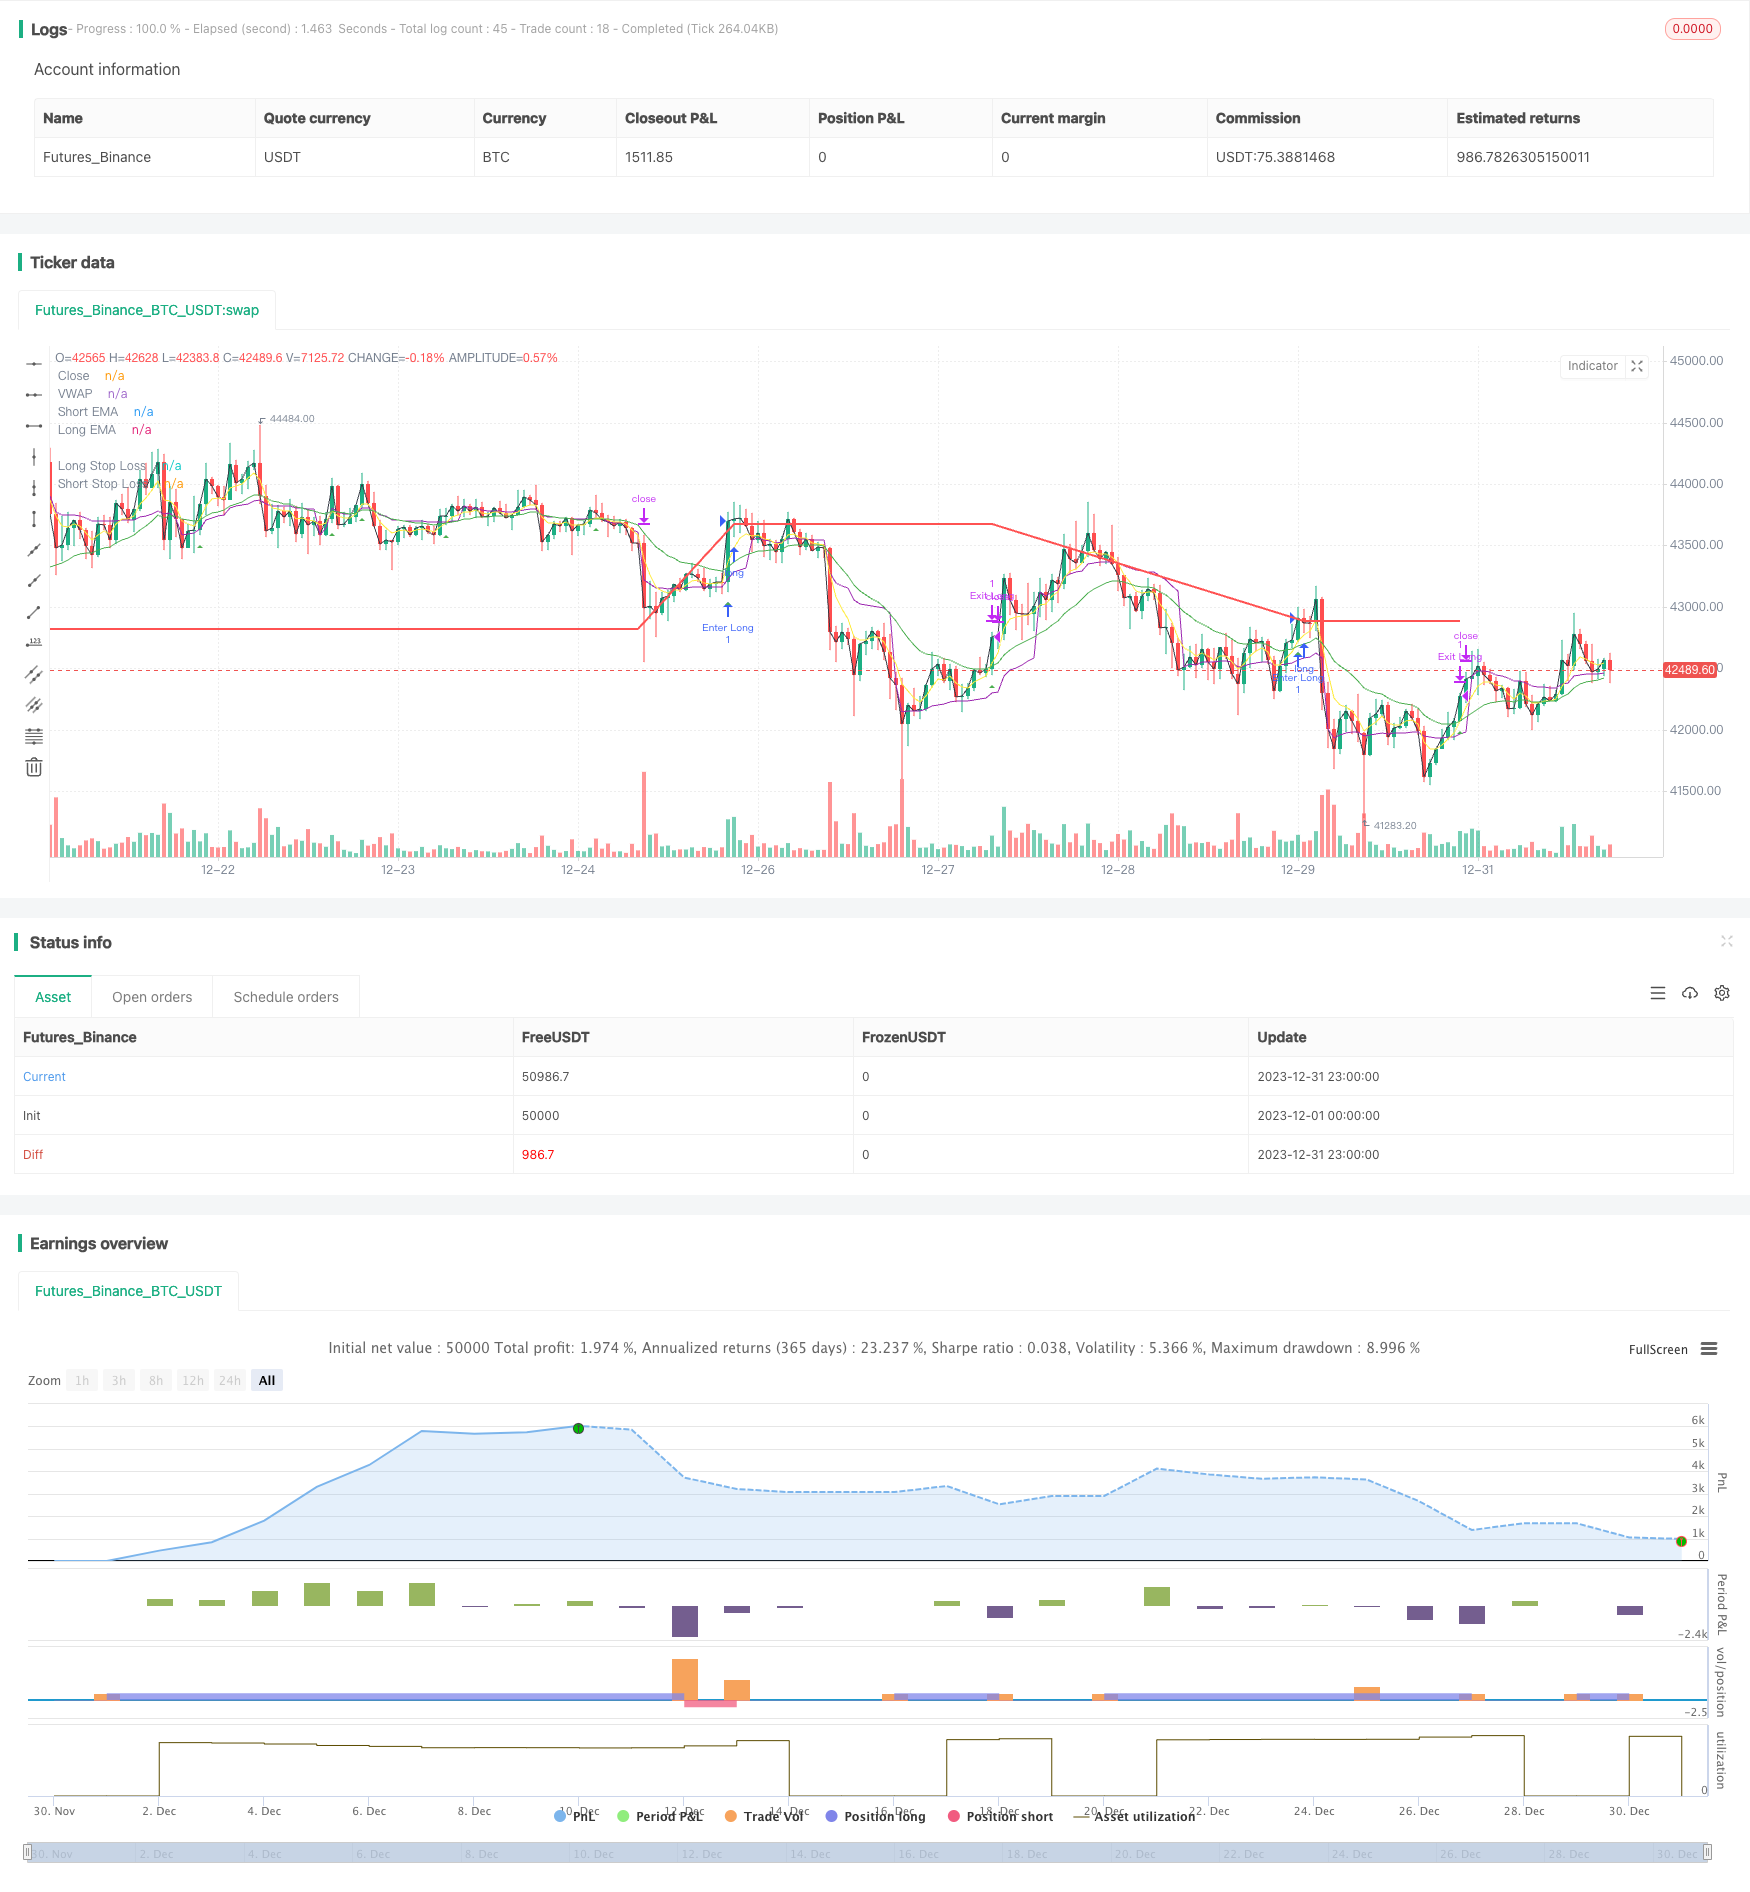
本策略基于EMA平均线的金叉死叉进行双向追踪,并设置动态的长短仓止损线,实现对趋势行情的捕捉。
- 计算快速EMA线(5日)和慢速EMA线(20日)
- 当快速线从下方向上穿过慢速线时,做多;当快速线从上方向下穿过慢速线时,做空
- 做多后,设置动态止损线为入场价*(1-长仓止损百分比);做空后,设置动态止损线为入场价*(1+短仓止损百分比)
- 一旦价格触发相应的止损线,则止损出场
- EMA平均线追踪趋势的能力较强,双向穿越形成计时器,可以有效锁定趋势机会
- 动态计算止损线,实现盈利后随行就市,可以最大程度锁定趋势利润
- 采用vwap作为附加过滤条件,避免被套,提高信号质量
- 纯趋势策略,行情震荡时容易被套
- 止损过于宽松,可能造成亏损放大
- EMA均线生成信号的滞后性可能错过行情最佳点位
可以通过采用ATR进行风险管控,优化短期止损策略,或者结合其他指标过滤噪音交易等方法进行优化。
- 结合ATR或DONCH等动态止损指标,设置更适应市场的止损线
- 增加其他技术指标过滤信号,如MACD、KDJ等,减少误入误出
- 优化参数,寻找最佳的快慢均线长度组合
- 可以尝试机器学习方法寻找最优参数
本策略整体来说是一个非常典型的趋势跟踪策略。双EMA形成金叉死叉,动态止损,可以有效锁定趋势获利。同时也存在一定的滞后性风险和止损过宽的风险。通过参数优化、风险管理、信号过滤等方法可以获得更好的策略表现。
||
This strategy utilizes the golden cross and dead cross of EMA lines for dual-directional trend following, and sets up dynamic stop loss lines for long and short positions to capture trending moves in the market.
- Calculate fast EMA line (5-day) and slow EMA line (20-day)
- Go long when fast line crosses above slow line from below; Go short when fast line crosses below slow line from above
- After long entry, set dynamic stop loss at entry price * (1 - long stop loss percentage); After short entry, set dynamic stop loss at entry price * (1 + short stop loss percentage)
- Exit position with stop loss once price hits the stop loss level
- EMA lines have stronger capabilities in tracking trends. Dual-crossover works as a timing tool to effectively catch trend opportunities
- Dynamic stop loss moves along with profit, maximizing trend catching profit
- Additional filter with vwap avoids being trapped in whipsaws and improves signal quality
- As a pure trend following strategy, it’s vulnerable to ranging markets with whipsaws
- Overly loose stop loss may lead to magnified losses
- Lagging nature of EMA crossover signals may miss best entry points
Enhancements like ATR-based risk management, optimizing stop loss rules, adding filter indicators etc. can help improve the strategy.
- Incorporate dynamic stop loss indicators like ATR or DONCH to set better adaptive stops
- Add more filter indicators like MACD, KDJ to avoid bad trades
- Optimize parameters to find best EMA lengths combination
- Utilize machine learning methods to discover optimal parameters
In conclusion, this is a very typical trend following strategy. Dual EMA crossover with dynamic stop loss can effectively lock in trend profits. Meanwhile the risks like lagging signals and overwide stops still exist. Through parameter tuning, risk management, filter additions etc., further refinement can lead to better results. [/trans]
Strategy Arguments
| Argument | Default | Description |
|---|---|---|
| v_input_1 | 5 | Short EMA Length |
| v_input_2 | 20 | Long EMA Length |
| v_input_3 | true | Price EMA Length |
| v_input_float_1 | 0.05 | Long Stop Loss (%) |
| v_input_float_2 | 0.05 | Short Stop Loss (%) |
Source (PineScript)
/*backtest
start: 2023-12-01 00:00:00
end: 2023-12-31 23:59:59
period: 1h
basePeriod: 15m
exchanges: [{"eid":"Futures_Binance","currency":"BTC_USDT"}]
*/

//@version=5

strategy("EMA Crossover Strategy", shorttitle="EMAC", overlay=true,calc_on_every_tick=true)

// Input parameters
shortEmaLength = input(5, title="Short EMA Length")
longEmaLength = input(20, title="Long EMA Length")
priceEmaLength = input(1, title="Price EMA Length")

// Set stop loss level with input options (optional)
longLossPerc = input.float(0.05, title="Long Stop Loss (%)",
     minval=0.0, step=0.1) * 0.01

shortLossPerc = input.float(0.05, title="Short Stop Loss (%)",
     minval=0.0, step=0.1) * 0.01

// Calculating indicators
shortEma = ta.ema(close, shortEmaLength)
longEma = ta.ema(close, longEmaLength)
//priceEma = ta.ema(close, priceEmaLength)
vwap = ta.vwap(close)

// Long entry conditions
longCondition = ta.crossover(shortEma, longEma) and close > vwap
// Short entry conditions
shortCondition = ta.crossunder(shortEma, longEma) and close > vwap

// STEP 2:
// Determine stop loss price
longStopPrice  = strategy.position_avg_price * (1 - longLossPerc)
shortStopPrice = strategy.position_avg_price * (1 + shortLossPerc)


if (longCondition)
    strategy.entry("Enter Long", strategy.long)
    strategy.exit("Exit Long",from_entry = "Enter Long",stop= longStopPrice)
plotshape(series=longCondition, title="Long Signal", color=color.green, style=shape.triangleup, location=location.belowbar)


if (shortCondition)
    strategy.entry("Enter Short", strategy.short)
    strategy.exit("Exit Short", from_entry = "Enter Short",stop = shortStopPrice)
plotshape(series=shortCondition, title="Short Signal", color=color.red, style=shape.triangledown, location=location.abovebar)

// Stop loss levels
//longStopLoss = (1 - stopLossPercent) * close
//shortStopLoss = (1 + stopLossPercent) * close

// Exit conditions
//strategy.exit("Long", from_entry="Long", loss=longStopLoss)
//strategy.exit("Short", from_entry="Short", loss=shortStopLoss)

// Plotting indicators on the chart
plot(shortEma, color=color.yellow, title="Short EMA")
plot(longEma, color=color.green, title="Long EMA")
plot(close, color=color.black, title="Close")
plot(vwap, color=color.purple, title="VWAP")

// Plot stop loss values for confirmation
plot(strategy.position_size > 0 ? longStopPrice : na,
     color=color.red, style=plot.style_line,
     linewidth=2, title="Long Stop Loss")

plot(strategy.position_size < 0 ? shortStopPrice : na,
     color=color.blue, style=plot.style_line,
     linewidth=2, title="Short Stop Loss")
// Plotting stop loss lines
//plot(longStopLoss, color=color.red, title="Long Stop Loss", linewidth=2, style=plot.style_line)
//plot(shortStopLoss, color=color.aqua, title="Short Stop Loss", linewidth=2, style=plot.style_line)
Detail
https://www.fmz.com/strategy/440294
Last Modified
2024-01-29 09:57:20
