Name
基于EMA黄金交叉交易策略EMA-Crossover-Trading-Strategy
Author
ChaoZhang
Strategy Description
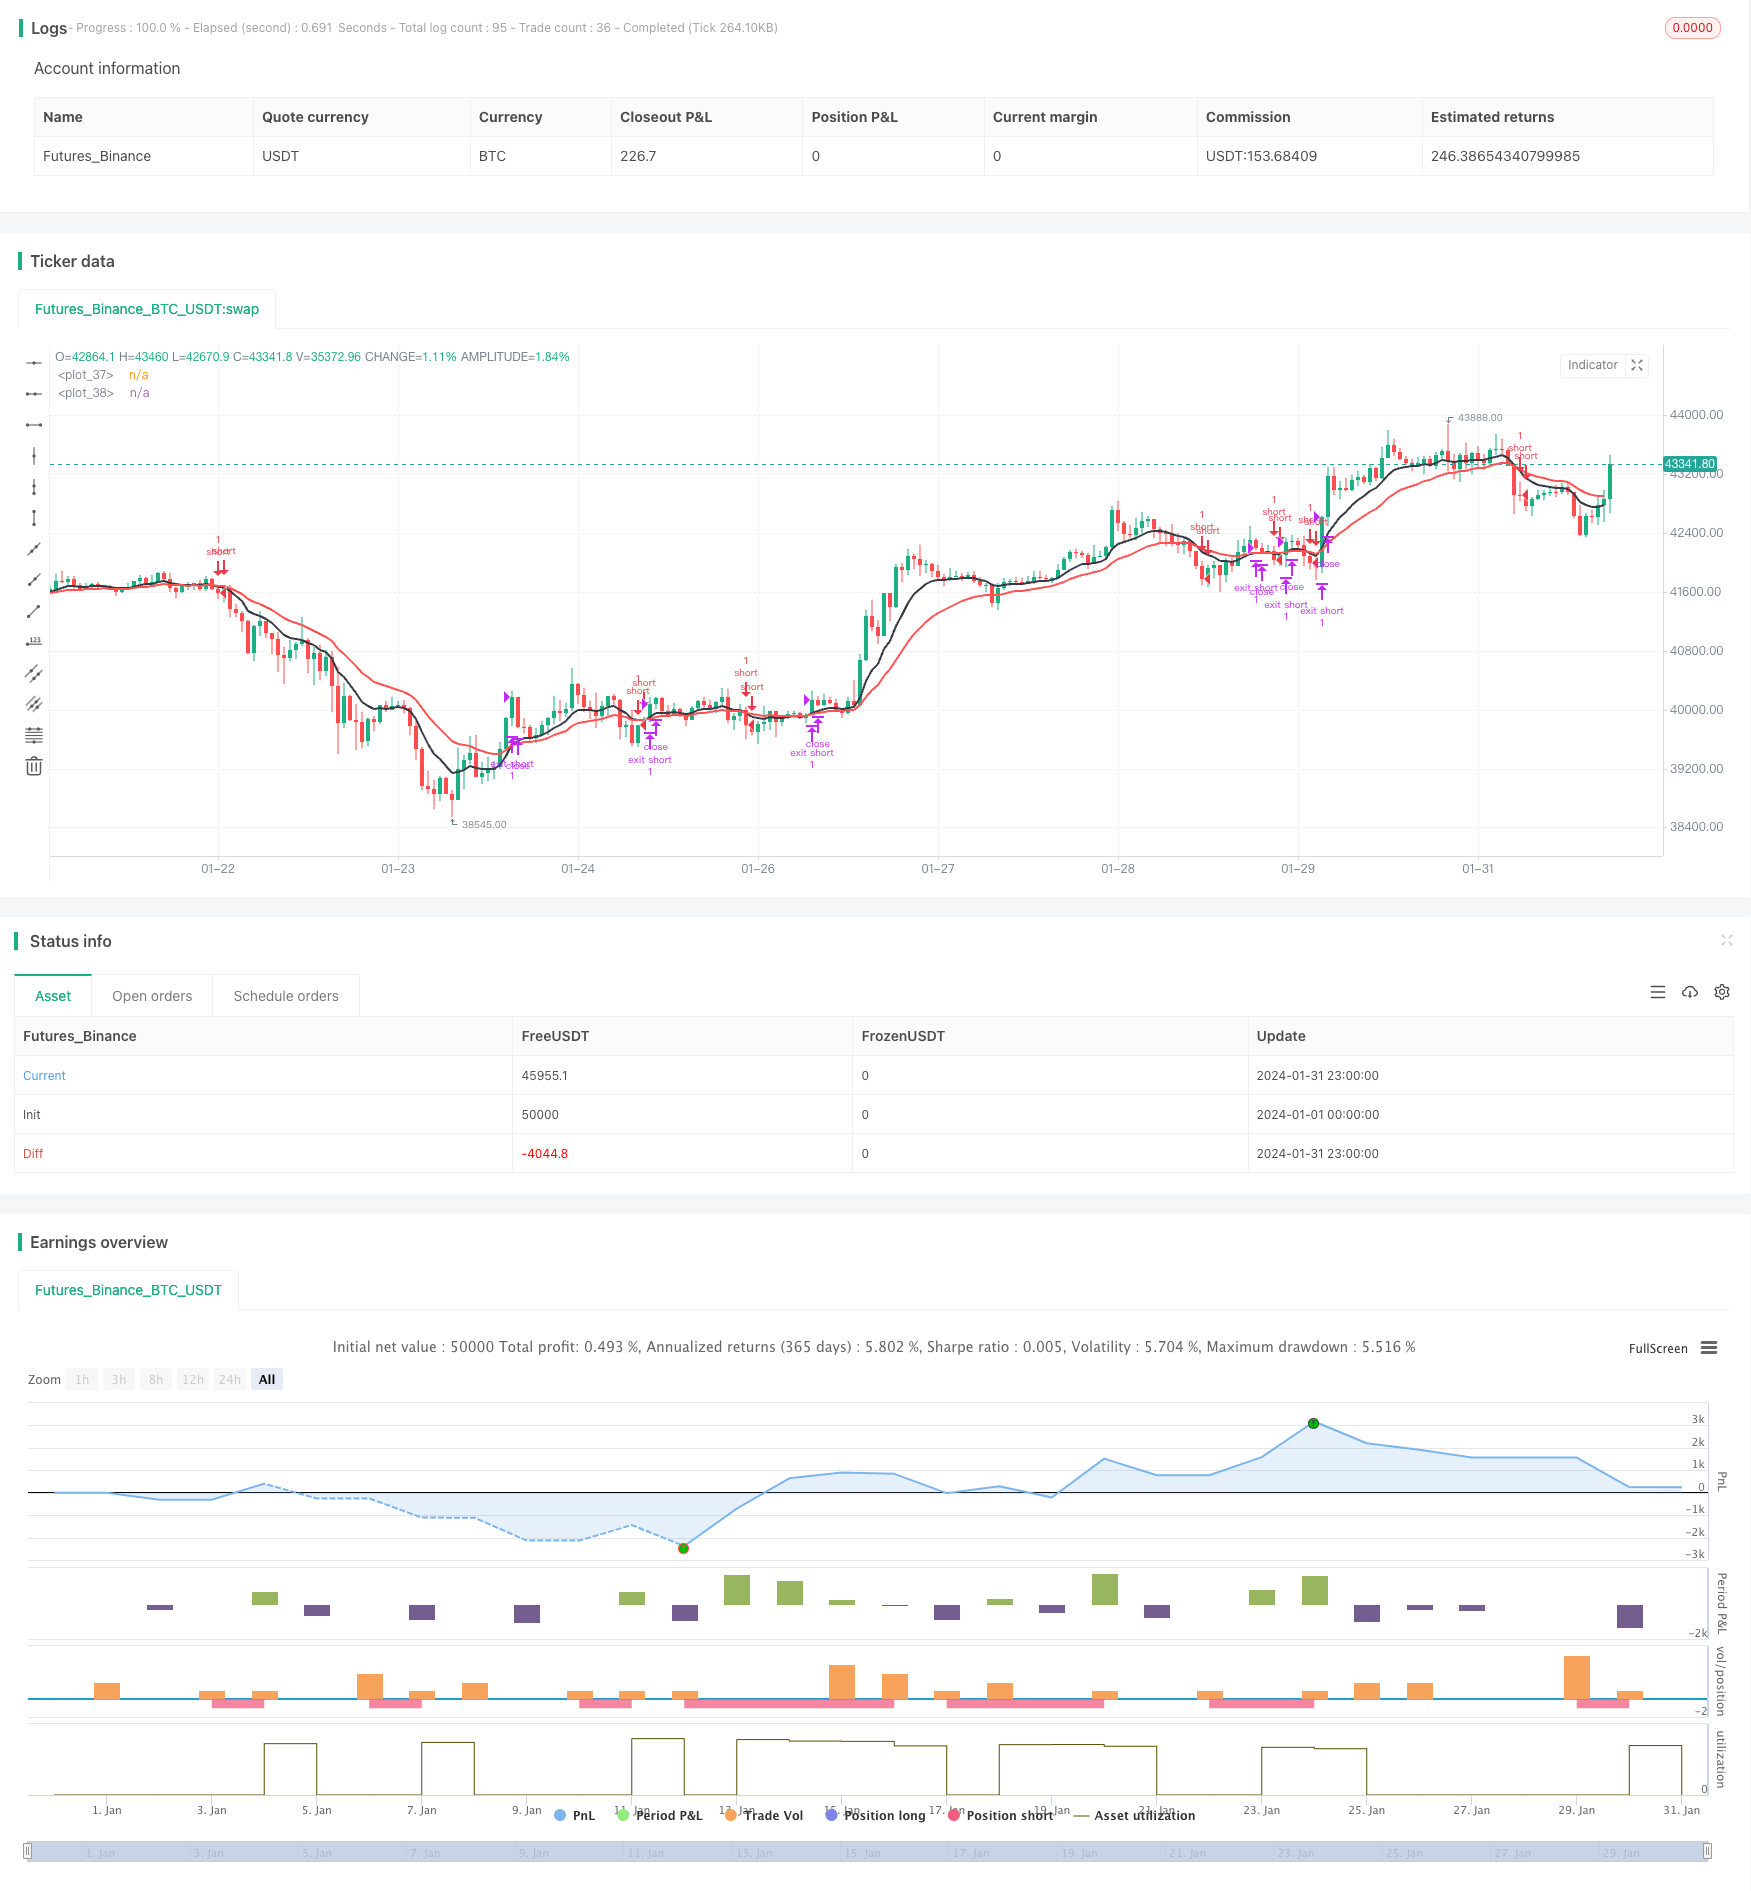
EMA黄金交叉交易策略通过计算不同周期的EMA均线,判断它们的交叉情况,以发出买入和卖出信号。当短周期EMA上穿长周期EMA时,产生买入信号;当短周期EMA下穿长周期EMA时,产生卖出信号。
该策略的核心是计算两条不同周期的EMA均线,包括一条较短周期的EMA均线,默认周期为9;以及一条较长周期的EMA均线,默认周期为20。代码通过调用pine脚本中的ema内置函数分别计算出这两条线。然后通过判断两条EMA线是否发生交叉,来产生交易信号。具体来说,如果快线从下方上穿慢线,就产生买入信号;如果快线从上方下穿慢线,就产生卖出信号。
交叉信号的判断是通过pine脚本中的crossover和crossunder两个内置函数实现的。crossover函数判断快线是否从下方上穿慢线,返回布尔值;crossunder函数判断快线是否从上方下穿慢线,返回布尔值。根据这两个函数的返回值,代码提交对应的买入或者卖出指令。
除此之外,代码还提供了一些辅助条件,比如设置开始和结束日期,限制只做多或只做空等,这有助于进行更精细的回测或优化。
该策略最大的优势就是非常简单直接,容易理解和实现,适合初学者学习。另外,移动平均线本身作为一种趋势跟踪指标,可以有效跟踪市场趋势,利用趋势产生额外收益。最后,该策略参数较少,容易调整,这也是其优势之一。
该策略主要面临噪音交易和趋势反转的风险。EMA线容易受到短期市场波动的影响,可能会产生错误信号,从而导致不必要的交易,这会增加交易频率和成本。另一方面,交叉信号发出时,趋势可能已经接近反转点,这时进行交易的风险较大。此外,参数设置不当也会影响策略表现。
可以通过调整EMA周期,或增加其他过滤条件等方法来减少噪音交易。同时设置止损来控制单笔损失。优化参数可以使策略更稳定。当然,任何交易策略都无法完全避免亏损,需要承担一定风险。
该策略可以从以下几个方向进行优化:
- 优化EMA周期参数,寻找最佳参数组合
- 增加其他指标过滤,如MACD、RSI等,减少假信号
- 增加趋势判断指标,避免趋势反转
- 结合股票基本面选择标的
- 调整持仓管理,如根据ATR设置止损位
EMA黄金交叉是一种简单有效的趋势跟踪策略。它利用EMA交叉产生交易信号,可以自动捕捉价格趋势, profit from trends in price. 该策略容易理解和调整,非常适合初学者学习,也可作为模块集成到更复杂的策略中。但是,任何策略都存在风险,需要妥善管理。通过不断优化和丰富,可以使该策略更稳定可靠。
||
The EMA Crossover trading strategy generates buy and sell signals by calculating EMA lines of different periods and detecting their crossover situations. When the faster EMA crosses above the slower EMA, a buy signal is generated. When the faster EMA crosses below the slower EMA, a sell signal is generated.
The core of this strategy is to compute two EMA lines with different periods, including a faster EMA with a default period of 9, and a slower EMA with a default period of 20. The code calculates these two lines by calling the built-in ema function in Pine Script. It then generates trading signals by detecting if the two EMA lines cross. Specifically, if the faster EMA crosses above the slower EMA, a buy signal is triggered. If the faster EMA crosses below the slower EMA, a sell signal is triggered.
The crossover situations are detected using the crossover and crossunder built-in functions in Pine Script. The crossover function checks if the faster EMA crosses above the slower EMA and returns a boolean value. The crossunder function checks if the faster EMA crosses below the slower EMA and returns a boolean value. Based on the return values of these two functions, the code submits corresponding buy or sell orders.
In addition, the code provides some auxiliary conditions such as setting start/end dates, restricting only long or short trades, etc. These features help conduct more sophisticated backtests or optimizations.
The biggest advantage of this strategy is that it is very simple and straightforward, easy to understand and implement, making it suitable for beginners to learn. Also, as a trend following indicator, moving averages can effectively track market trends and generate additional profits by exploiting the momentum. Lastly, this strategy has few parameters, which makes it easy to tune and optimize.
The main risks this strategy faces are whipsaw trades and trend reversals. EMA lines are susceptible to short-term market fluctuations, which may generate false signals and trigger unnecessary trades, increasing trading frequency and costs. On the other hand, when crossover signals trigger, the trend may be nearing its reversal point, making trades riskier. Inappropriate parameter settings can also impact strategy performance.
Methods like adjusting EMA periods, adding filters can help reduce whipsaws. Stop loss orders control single trade loss. Parameter optimization improves robustness. However, no trading strategies can completely avoid losses, so one must be ready to take on risks.
This strategy can be improved in the following aspects:
- Optimize EMA periods to find best parameter sets
- Add indicators like MACD, RSI as filters to reduce false signals
- Incorporate trend metrics to avoid trend reversals
- Select stocks based on fundamentals
- Adjust position sizing, set stops based on ATR
The EMA crossover is a simple yet effective trend following strategy. It uses EMA crosses to generate trading signals, automatically capturing price trends. This easy to understand and adjustable strategy is perfect for beginners to learn. It can also be integrated into more complex strategies. However, all strategies bear risks and need prudent management. Continued enhancements in terms of optimization and enriching market conditions can make this strategy more robust. [/trans]
Strategy Arguments
| Argument | Default | Description |
|---|---|---|
| v_input_1 | 9 | Fast EMA |
| v_input_2 | 20 | Slow EMA |
| v_input_3 | 0 | Trade Direction: Both |
| v_input_4 | timestamp(01 Jan 1970 00:00) | Start Date |
| v_input_5 | timestamp(31 Dec 2170 23:59) | End Date |
Source (PineScript)
/*backtest
start: 2024-01-01 00:00:00
end: 2024-01-31 23:59:59
period: 1h
basePeriod: 15m
exchanges: [{"eid":"Futures_Binance","currency":"BTC_USDT"}]
*/

// This source code is subject to the terms of the Mozilla Public License 2.0 at https://mozilla.org/MPL/2.0/
// This strategy has been created for illustration purposes only and should not be relied upon as a basis for buying, selling, or holding any asset or security.
// © kirilov

//@version=4
strategy(
     "EMA Cross Strategy",
     overlay=true,
     calc_on_every_tick=true,
     currency=currency.USD
     )

// INPUT:

// Options to enter fast and slow Exponential Moving Average (EMA) values
emaFast = input(title="Fast EMA", type=input.integer, defval=9, minval=1, maxval=9999)
emaSlow = input(title="Slow EMA", type=input.integer, defval=20, minval=1, maxval=9999)

// Option to select trade directions
tradeDirection = input(title="Trade Direction", options=["Long", "Short", "Both"], defval="Both")

// Options that configure the backtest date range
startDate = input(title="Start Date", type=input.time, defval=timestamp("01 Jan 1970 00:00"))
endDate = input(title="End Date", type=input.time, defval=timestamp("31 Dec 2170 23:59"))


// CALCULATIONS:

// Use the built-in function to calculate two EMA lines
fastEMA = ema(close, emaFast)
slowEMA = ema(close, emaSlow)


// PLOT:

// Draw the EMA lines on the chart
plot(series=fastEMA, color=color.black, linewidth=2)
plot(series=slowEMA, color=color.red, linewidth=2)


// CONDITIONS:

// Check if the close time of the current bar falls inside the date range
inDateRange = true

// Translate input into trading conditions
longOK  = (tradeDirection == "Long") or (tradeDirection == "Both")
shortOK = (tradeDirection == "Short") or (tradeDirection == "Both")

// Decide if we should go long or short using the built-in functions
longCondition = crossover(fastEMA, slowEMA)
shortCondition = crossunder(fastEMA, slowEMA)


// ORDERS:

// Submit entry (or reverse) orders
if (longCondition and inDateRange)
    strategy.entry(id="long", long=true, when = longOK)
if (shortCondition and inDateRange)
    strategy.entry(id="short", long=false, when = shortOK)

// Submit exit orders in the cases where we trade only long or only short
if (strategy.position_size > 0 and shortCondition)
    strategy.exit(id="exit long", stop=close)
if (strategy.position_size < 0 and longCondition)
    strategy.exit(id="exit short", stop=close)
Detail
https://www.fmz.com/strategy/442564
Last Modified
2024-02-22 17:48:09
