Name
基于EMA-MA交叉的交易策略EMA-MA-Crossover-Options-Trading-Strategy
Author
ChaoZhang
Strategy Description
[trans]
该策略是一个基于指数移动平均线(EMA)和移动平均线(MA)的交叉来产生交易信号的短线期权交易策略。当快速EMA上穿慢速MA时,产生买入信号;当快速EMA下穿慢速MA时,产生卖出信号。
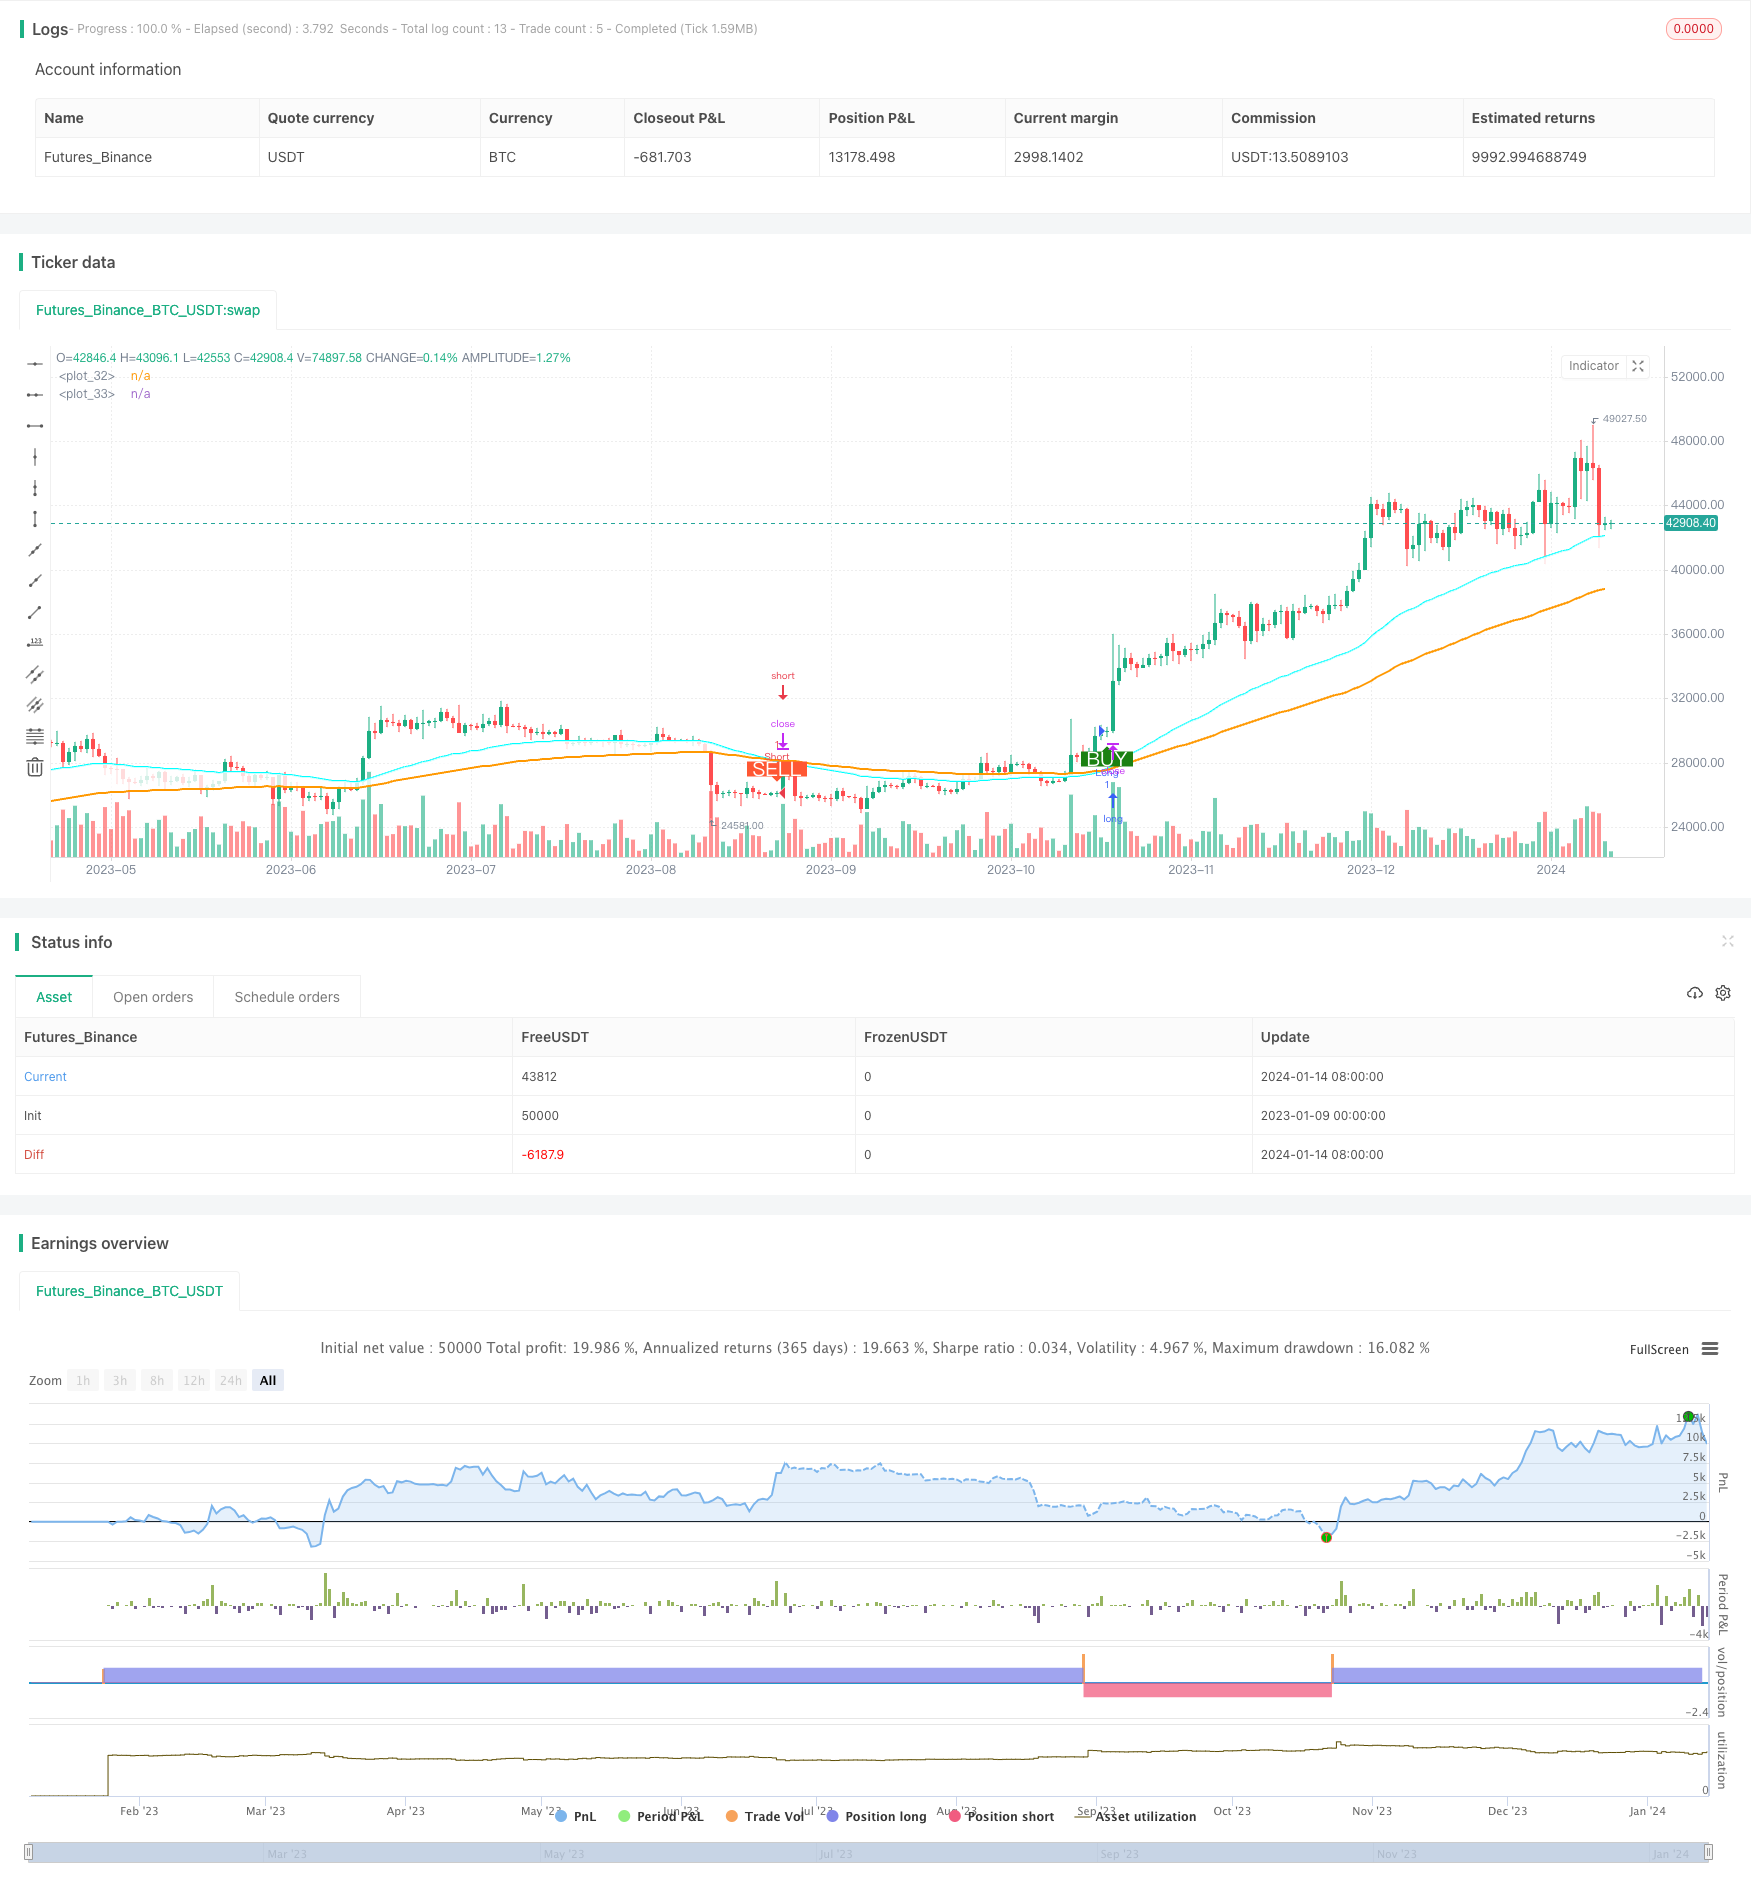
该策略使用两个不同参数的EMA和MA进行计算,分别是一个快速EMA和一个慢速MA。快速EMA参数设置为50,慢速MA参数设置为100。EMA指数移动平均线能更快地响应价格变动,而MA简单移动平均线响应价格变动更加缓慢。
当短期价格上涨加速时,快速EMA会先于慢速MA向上突破,产生买入信号。这表示市场短期看涨情绪增加,可以考虑买入或买入看涨期权。
当短期价格下跌加速时,快速EMA会先于慢速MA向下突破,产生卖出信号。这表示市场短期看跌情绪增加,可以考虑卖出或买入看跌期权。
通过快慢EMA/MA的交叉来判断短期价格变化趋势和市场情绪,实施适时的期权交易,能抓住较短线的价格波动获利。
该策略有以下主要优势:
-
响应迅速,能及时抓住短线价格波动。通过快速EMA和慢速MA的交叉形成信号,快速发现短期涨跌变化。
-
实现简单,容易实施。仅需观察两条移动平均线的交叉情况,无需复杂计算。
-
灵活运用,可交易期权或正股。可根据信号买入看涨期权、卖出看跌期权,也可以直接做多或做空正股。
-
可控风险,止损机制明确。可 preset 止损点,控制单笔损失。
该策略也存在一些风险需要注意:
-
可能出现错误信号和震荡行情的风险。快慢EMA/MA可能多次交叉摆动,令交易频繁开仓平仓,增加交易成本和实施难度。可适当放宽止损幅度,避免过频交易。
-
大盘持续疲软时容易产生亏损。策略以抓短线为主,遇持续下跌行情,止损可能频繁触发。这时可考虑暂停使用策略,转至观望状态,等待大盘回暖。
-
需关注重大事件造成的股价异常波动的风险。重大事件发生时,股价可能出现异常波动,导致止损被突破或产生巨额亏损。这需要充分考量是否在该阶段使用策略交易。
该策略可从以下几个方向进行优化:
-
基于波动率的止损调整。采用动态止损,根据股价波动率实时调整止损幅度。降低止损被冲击的概率。
-
整合多个时间周期EMA。如加入日线及周线EMA,判断大周期趋势,避免逆势交易。
-
RSI指标过滤。加入RSI指标判断超买超卖区,过滤掉部分噪音信号。
-
机器学习波动率预测。采用LSTM等深度学习模型,预测股价波动率和风险,动态调整持仓和止损。
该短线EMA/MA交叉策略,通过快速EMA和慢速MA的交叉来判断价格短期趋势和市场情绪,可快速响应价格变化,及时抓取短线交易机会。策略实施简单,但也存在一些噪音信号和持续亏损的风险。可通过止损优化、整合多时间周期、RSI过滤以及机器学习等方式进行升级,在控制风险前提下,提高策略收益。
||
This is a short-term option trading strategy based on exponential moving average (EMA) and moving average (MA) crossovers to generate trading signals. It produces buy signals when the fast EMA crosses over the slow MA from below, and sell signals when the fast EMA crosses below the slow MA.
The strategy employs two EMAs/MAs with different parameters, one fast EMA and one slow MA. The fast EMA period is set to 50 and the slow MA period is set to 100. The EMA responds faster to price changes while the MA reacts more slowly.
When short-term price surge accelerates, the fast EMA will penetrate the slow MA from below, generating buy signals. This indicates increasing bullish sentiment, making it suitable to consider buying or buying call options.
When short-term price decline accelerates, the fast EMA will break below the slow MA, producing sell signals. This shows increasing bearish sentiment, indicating opportunities to sell or buy put options.
By capturing crossovers between fast and slow EMA/MA to determine short-term trend and market emotions, timely option trades can be executed to profit from relatively short-term price fluctuations.
The main advantages of this strategy are:
-
Fast response to capture short-term swings. Crossovers between fast EMA and slow MA quickly detect short-term up and down price reversals.
-
Simple to implement. Only need to monitor crossover of the two moving averages without complex calculation.
-
Flexible application for trading options or stocks. Can go long/short based on signals, or trade options accordingly.
-
Controllable risk with clear stop loss. Preset stop loss points to limit loss per trade.
Some risks to note:
-
Potential whipsaw signals and ranging markets may cause excessive trading and increased costs. Can widen stop loss to avoid over-trading.
-
Vulnerable in sustained market downtrends with consecutive stop loss triggers. Consider pausing strategy during protracted bear phase for capital preservation.
-
Price spikes from significant news events may stop out positions prematurely or substantially magnify losses. Carefully assess appropriateness of employing strategy around major events.
Some ways to enhance the strategy:
-
Dynamic stop loss based on volatility. Adjust stop loss in real-time according to price fluctuation levels to minimize forced exit probabilities.
-
Integrate multiple timeframe EMAs. Add daily and weekly EMAs to gauge overall trend to avoid counter-trend trades.
-
RSI filter. Utilize RSI to identify overbought and oversold levels to filter out some noise signals.
-
Machine learning volatility prediction. Employ LSTM models to predict price volatility and risk, dynamically adjusting position sizing and stop loss.
This short-term EMA/MA crossover strategy captures short-term trend changes and market emotions for timely trades by monitoring fast EMA and slow MA crossovers. Despite its ease of implementation, risks include excessive whipsaws and sustained drawdowns. Enhancements around stop loss optimization, multiple timeframes, signal filtering, and machine learning prediction can aid risk control and profitability improvements.
[/trans]
Strategy Arguments
| Argument | Default | Description |
|---|---|---|
| v_input_1 | 100000 | Buy quantity |
| v_input_2 | 2019 | Backtest Start Year |
| v_input_3 | true | Backtest Start Month |
| v_input_4 | true | Backtest Start Day |
| v_input_5 | false | Backtest Start Hour |
| v_input_6 | false | Backtest Start Minute |
| v_input_7 | 2099 | Backtest Stop Year |
| v_input_8 | true | Backtest Stop Month |
| v_input_9 | 30 | Backtest Stop Day |
| v_input_10 | true | Color Background? |
| v_input_11 | 50 | Select EMA 1 |
| v_input_12 | 100 | Select EMA 2 |
Source (PineScript)
/*backtest
start: 2023-01-09 00:00:00
end: 2024-01-15 00:00:00
period: 1d
basePeriod: 1h
exchanges: [{"eid":"Futures_Binance","currency":"BTC_USDT"}]
*/

//@version=4
strategy("Backtest single EMA cross", overlay=true)

qty = input(100000, "Buy quantity")

testStartYear = input(2019, "Backtest Start Year")
testStartMonth = input(1, "Backtest Start Month")
testStartDay = input(1, "Backtest Start Day")
testStartHour = input(0, "Backtest Start Hour")
testStartMin = input(0, "Backtest Start Minute")
testPeriodStart = timestamp(testStartYear, testStartMonth, testStartDay, testStartHour, testStartMin)
testStopYear = input(2099, "Backtest Stop Year")
testStopMonth = input(1, "Backtest Stop Month")
testStopDay = input(30, "Backtest Stop Day")
testPeriodStop = timestamp(testStopYear, testStopMonth, testStopDay, 0, 0)
testPeriodBackground = input(title="Color Background?", type=input.bool, defval=true)
testPeriodBackgroundColor = testPeriodBackground and time >= testPeriodStart and time <= testPeriodStop ?
   #00FF00 : na
testPeriod() => true


ema1 = input(50, title="Select EMA 1")
ema2 = input(100, title="Select EMA 2")

expo = ema(close, ema1)
ma = ema(close, ema2)

avg_1 = avg(expo, ma)
s2 = cross(expo, ma) ? avg_1 : na
//plot(s2, style=plot.style_line, linewidth=3, color=color.red, transp=0)

p1 = plot(expo, color=#00FFFF, linewidth=2, transp=0)
p2 = plot(ma, color=color.orange, linewidth=2, transp=0)
fill(p1, p2, color=color.white, transp=80)


longCondition = crossover(expo, ma)

shortCondition = crossunder(expo, ma)

exitlongCondition = crossunder(expo, ma)

exitshortCondition = crossover(expo, ma)


if testPeriod()
    strategy.entry("Long", strategy.long, when=longCondition)
    strategy.entry("Short", strategy.short, when=shortCondition)

plotshape(longCondition, title = "Buy Signal", text ="BUY", textcolor = #FFFFFF , style=shape.labelup, size = size.normal, location=location.belowbar, color = #1B8112, transp = 0)
plotshape(shortCondition, title = "Sell Signal", text ="SELL", textcolor = #FFFFFF, style=shape.labeldown, size = size.normal, location=location.abovebar, color = #FF5733, transp = 0)
Detail
https://www.fmz.com/strategy/438931
Last Modified
2024-01-16 14:14:42
