Name
基于EMARSI和MACD的多时间框架交易策略EMA-RSI-and-MACD-Based-Multi-Timeframe-Trading-Strategy
Author
ChaoZhang
Strategy Description
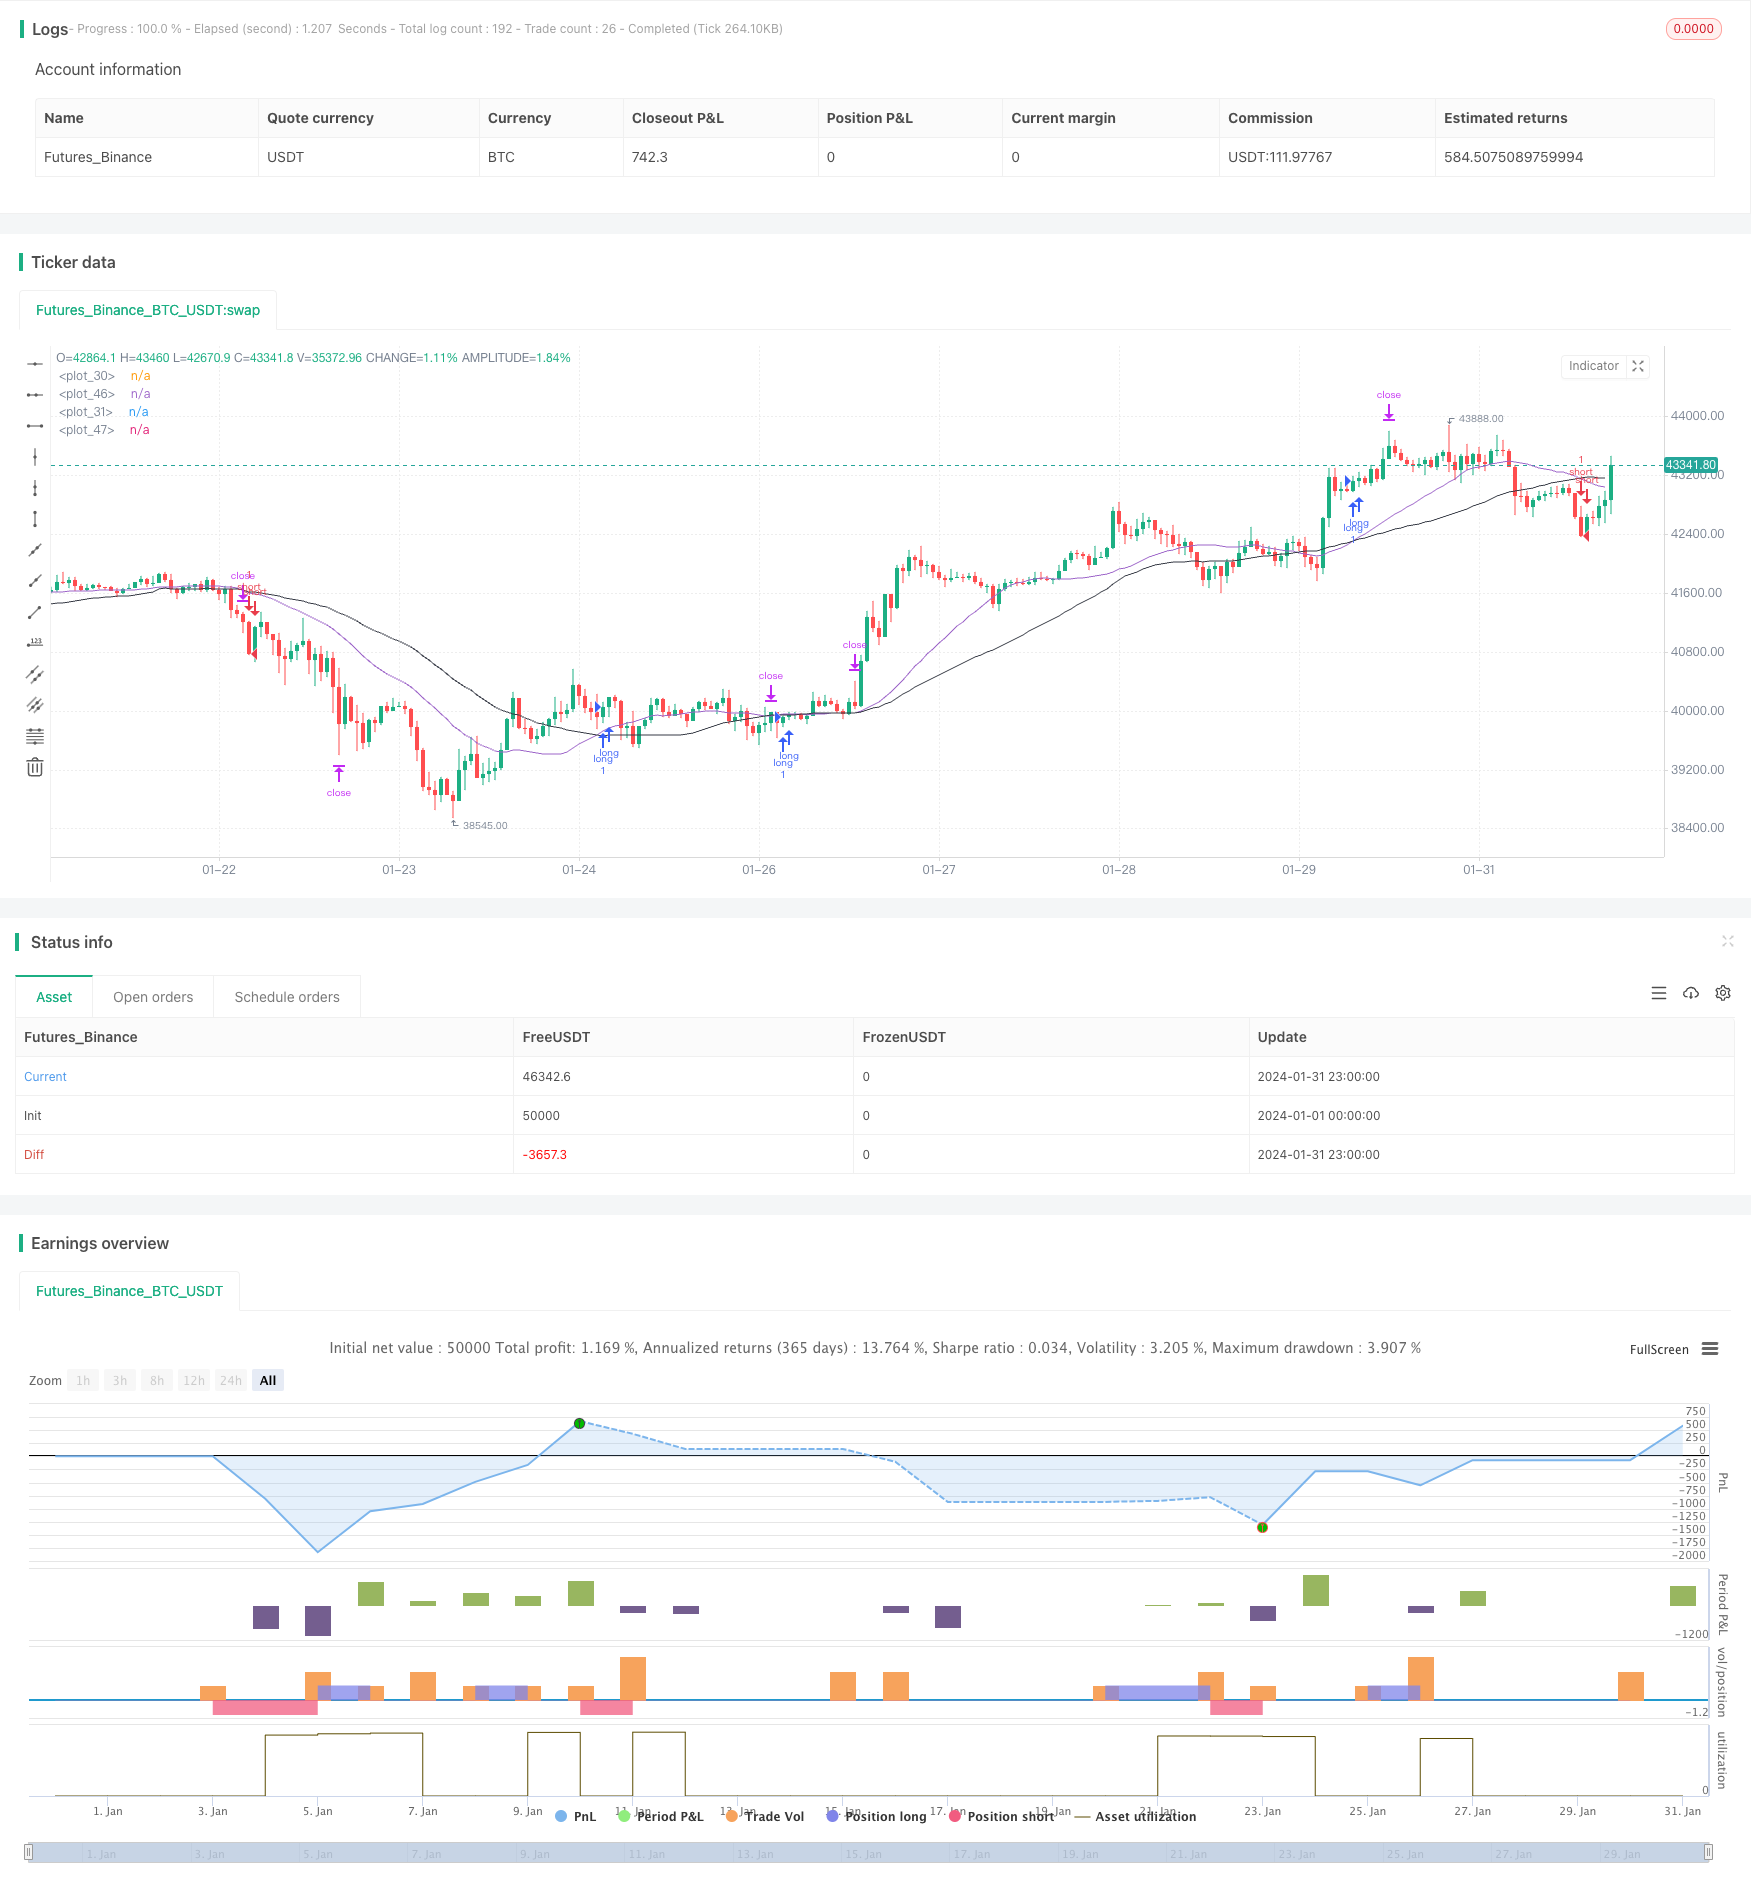
本策略结合了移动平均线(EMA)、相对强弱指标(RSI)和移动平均聚散指标(MACD)三个指标,在多个时间框架内寻找交易机会,实现自动化交易。该策略可以有效跟踪市场趋势,降低交易风险。
该策略主要是基于EMA、RSI和MACD三个指标实现的。其交易逻辑如下:
-
使用25日EMA和45日EMA形成金叉和死叉,作为交易信号。当短期EMA上穿长期EMA时买入,短期EMA下穿长期EMA时卖出。
-
结合RSI指标避免假突破。只有当RSI大于50时,才对金叉形成的买入信号进行交易;只有当RSI小于50时,才对死叉形成的卖出信号进行交易。
-
在RSI指标不同参数下寻找更多交易机会,包括RSI>30、RSI<30等条件。
-
MACD指标可以作为辅助判断指标,对EMA交易信号进行确认。
通过在不同时间框架内找到更多交易机会,可以提高策略盈利能力。同时,结合多个指标可以减少错误交易的发生,有效控制风险。
该策略最大的优势在于结合多个指标,在多个时间框架内进行交易,可以提高盈利概率。主要优势有:
-
使用EMA金叉死叉可以有效跟踪市场趋势变化,及时捕捉交易机会。
-
RSI指标可以避免假突破,降低交易风险。
-
在多个RSI参数下寻找交易机会,增加入场次数,提高收益。
-
MACD指标可以对EMA交易信号进行二次验证,进一步减少风险。
-
多时间框架交易, LoginFormationTransactionModelTransactionModel翻倍获利机会。
该策略也存在一定的风险,主要集中在以下几个方面:
-
EMA指标存在时滞,可能错过短线交易机会。
-
多指标组合交易,参数设置不当可能导致超优化。
-
多时间框架交易可能加重亏损,需要严格的止损管理。
-
实战中需关注交易成本控制,避免过高frequency交易。
该策略还有进一步优化的空间,主要集中在以下几个方面:
-
对EMA参数进行测试优化,寻找最优参数组合。
-
测试更多辅助指标的加入,如BOLL通道、KD指标等。
-
加入自适应止损机制,可以根据市场波动率调整止损位置。
-
对开仓手数进行优化,不同参数下可采用不同的交易手数。
-
优化入场条件逻辑,避免冲突信号或加大信号过滤力度。
本策略整合了多种指标信号,在多个时间周期内进行交易,既具有跟踪趋势的能力,也能抓住短线机会。同时,严格的入场过滤机制也使策略具有一定的风险控制能力。总的来说,该策略收益稳定,具有实战运用价值,值得推荐。
||
This strategy combines the moving average (EMA), relative strength index (RSI) and moving average convergence divergence (MACD) indicators to find trading opportunities across multiple timeframes and enable automated trading. It can effectively track market trends and reduce trading risks.
The strategy is mainly based on the EMA, RSI and MACD indicators. The trading logic is as follows:
-
Use 25-day EMA and 45-day EMA to form golden crosses and death crosses as trading signals. Buy when the short term EMA crosses above the long term EMA, and sell when the short term EMA crosses below the long term EMA.
-
Incorporate the RSI indicator to avoid false breakouts. Only take buy signals from golden crosses when RSI is greater than 50; only take sell signals from death crosses when RSI is less than 50.
-
Find more trading opportunities under different RSI parameter settings, including RSI>30, RSI<30 etc.
-
MACD indicator can be used as an auxiliary judgement tool to confirm the EMA trading signals.
By finding more trading chances across different timeframes, the strategy's profitability can be improved. Meanwhile, the integration of multiple indicators helps reduce erroneous trades and effectively control risks.
The biggest strength of this strategy lies in the combination of multiple indicators and trading across timeframes, which improves the odds of winning trades. The main advantages are:
-
EMA crosses can effectively track trend changes in the market and timely capture trading opportunities.
-
RSI indicator helps avoid false breakouts and reduce trading risks.
-
More entry opportunities via different RSI parameter settings improve profitability.
-
MACD provides secondary confirmation of EMA signals to further decrease risks.
-
Multi timeframe trading doubles profit making chances.
There are also some risks with this strategy:
-
EMA has lags that may lead to missing short-term trading chances.
-
Improper parameter tuning in the multi-indicator combo may cause over-optimization.
-
Multi timeframe trading may compound losses, demanding strict stop loss management.
-
Transaction costs need monitoring in live trading environments to avoid over-trading.
There is room for further optimization of the strategy:
-
Test and optimize EMA parameters for best combination.
-
Test more auxiliary indicators like BOLL bands, KD etc.
-
Incorporate adaptive stop loss mechanism based on market volatility.
-
Optimize position sizing under different parameter settings.
-
Improve entry logic to eliminate conflicting signals or increase filtering power.
This strategy integrates signals across indicators and timeframes, capable of both tracking trends and capturing short-term opportunities. Meanwhile, the strict entry mechanisms also equip the strategy with decent risk control capacities. In general, this is a strategy with stable returns and practical value, worth recommending.
[/trans]
Source (PineScript)
/*backtest
start: 2024-01-01 00:00:00
end: 2024-01-31 23:59:59
period: 1h
basePeriod: 15m
exchanges: [{"eid":"Futures_Binance","currency":"BTC_USDT"}]
*/

// This Pine Script™ code is subject to the terms of the Mozilla Public License 2.0 at https://mozilla.org/MPL/2.0/
// © Aqualizer

//@version=5
strategy("Aserin Buy and Sell", overlay=true)

shortSMA = ta.sma(close, 25)
longSMA = ta.sma(close, 45)
rsi = ta.rsi(close, 7)
ta.macd(close,12, 26, 9)
atr = ta.atr(3)
longCondition = ta.crossover(shortSMA, longSMA)
shortCondition = ta.crossunder(shortSMA, longSMA)

if (longCondition)
    strategy.entry("long", strategy.long, 100, when = rsi > 50)
if (shortCondition)
    strategy.entry("short", strategy.short, 100, when = rsi < 50)

if (longCondition)
    strategy.entry("long", strategy.long, 100, when = rsi > 30)
if (shortCondition)
    strategy.entry("short", strategy.short, 100, when = rsi < 30)

if (longCondition)
    strategy.entry("long", strategy.long, 100, when = rsi > 20)
if (shortCondition)
    strategy.entry("short", strategy.short, 100, when = rsi < 50)

plot(shortSMA)
plot(longSMA, color=color.black)

if (longCondition)
    stopLoss = low - atr * 2,45
    takeProfit = high + atr * 2,45
    strategy.entry("long", strategy.long, 1, when = rsi > 30)

    strategy.exit("exit", "long", stop=stopLoss, limit=takeProfit)

if (shortCondition)
    stopLoss = high + atr * 3
    takeProfit = low - atr * 3
    strategy.entry("short", strategy.short, 1, when = rsi < 30)
    strategy.exit("exit", "short", stop=stopLoss, limit=takeProfit)

plot(shortSMA)
plot(longSMA, color=color.black)
Detail
https://www.fmz.com/strategy/442232
Last Modified
2024-02-20 14:25:24
