Name
基于ICHIMOKU形态和STOCH指标的趋势跟踪策略ICHIMOKU-Cloud-and-STOCH-Indicator-Based-Trend-Tracking-Strategy
Author
ChaoZhang
Strategy Description
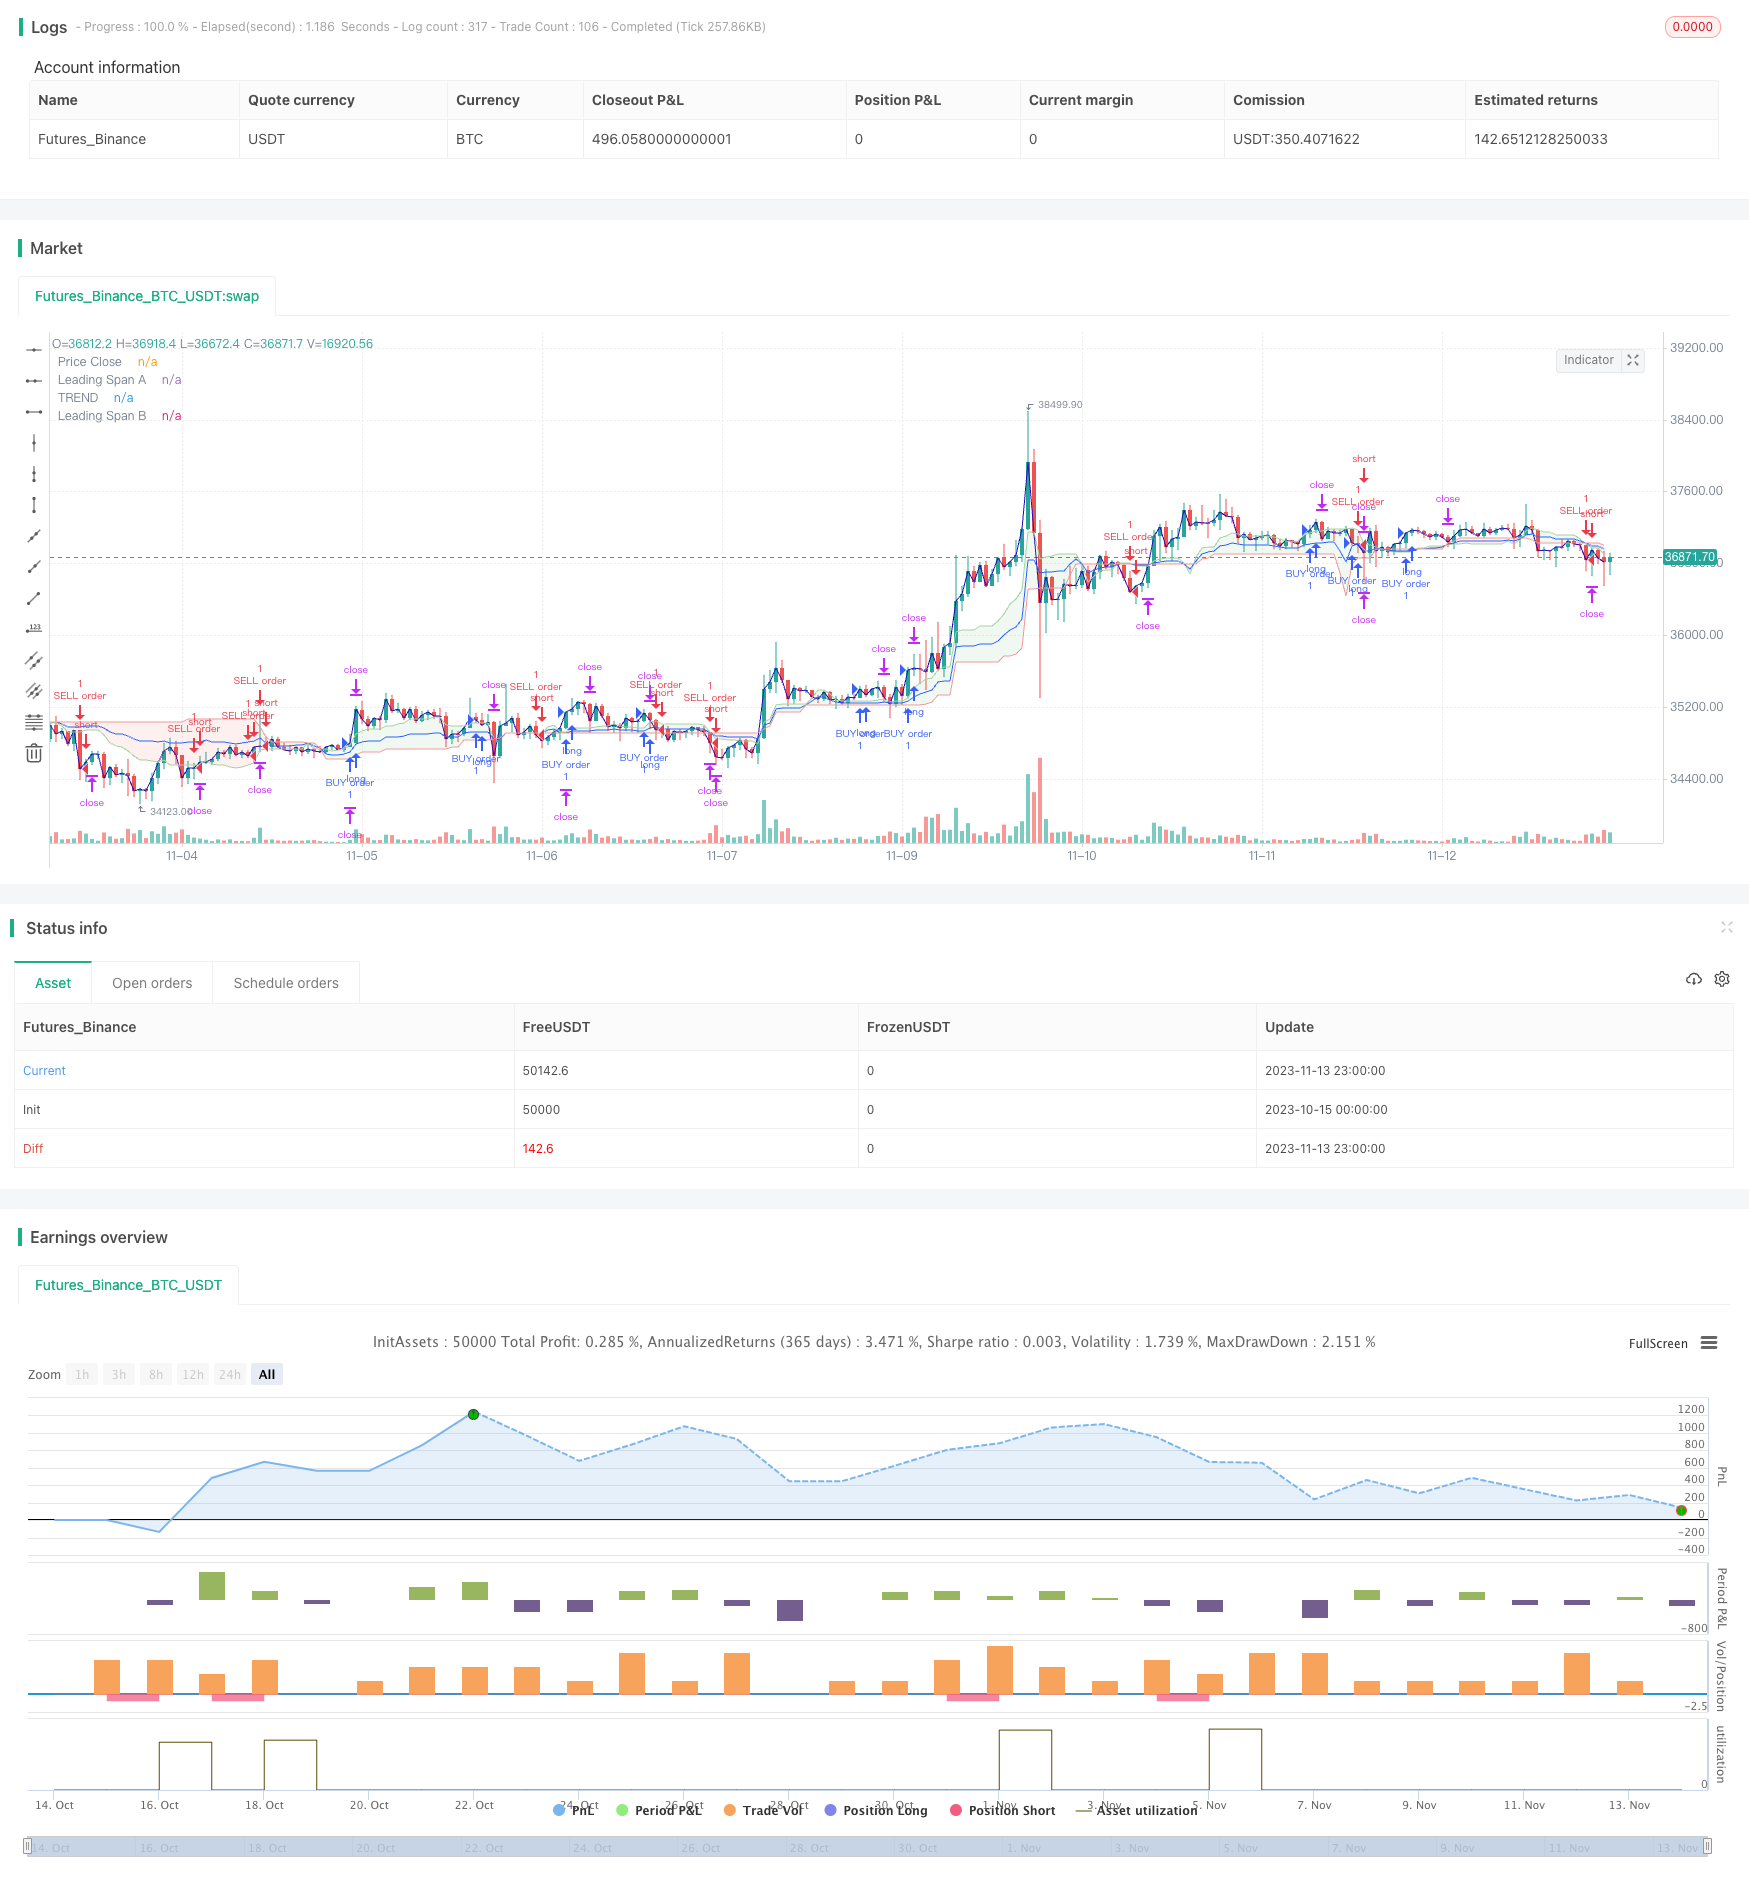
本策略基于ICHIMOKU云图形态指标和STOCH随机指标,实现对趋势的判断和跟踪。策略名为“云图Stoch趋势跟踪策略”。
该策略主要通过ICHIMOKU云图和STOCH指标判断当前趋势方向,以及过冲超买超卖情况。
当Conversion Line转换线上穿Base Line基准线而Stoch指标从超卖区域反弹时,认为处于看涨行情,该策略采取看涨方向;当Conversion Line下穿Base Line而Stoch指标从超买区域回落时,认为处于看跌行情,该策略采取看跌方向。
代码中,Conversion Line转换线定义为近N1个K线的最高价和最低价的平均值;Base Line基准线定义为近N2个K线的最高价和最低价的平均值。当转换线上穿基准线时产生看涨信号。
Stoch指标中,定义了超买线和超卖线阈值,以及平滑参数K和D。Stoch从超卖区域反弹时产生看涨信号,从超买区域回落时产生看跌信号。
综合两种指标,该策略实现对趋势方向的判断。
该策略结合图形形态指标和超买超卖指标,能够有效判断趋势方向。
相较于单一使用趋势判断指标,该策略综合考虑了趋势和过冲情况,可以更准确判断入场时机。
ICHIMOKU云图能够识别中长线趋势,而Stoch指标可以发现短期超买超卖情况,二者互补形成系统性判断。
该策略主要存在以下风险:
-
当出现突发黑天鹅事件时,指标失效的系统性风险。
-
存在一定的滞后性,可能错过部分行情或反向开仓的风险。
-
多因子的综合判断存在一定主观性,参数设置不当可能导致失误的风险。
-
交易频繁时,交易成本会对盈利产生一定影响。
对应优化措施:
-
结合新闻事件判断,避免主要政策事件出现时的盲目交易。
-
适当缩短周期参数,降低滞后判断的概率。
-
做回测优化参数,提高参数设置的科学性。
-
适当加大止盈止损幅度,降低交易频率。
该策略主要可从以下方面进行优化:
-
优化ICHIMOKU转换线和基准线的周期参数,使之更符合不同市场的特点。
-
优化Stoch指标的K、D平滑参数,以及超买超卖阈值参数。
3.增加其他指标判断,形成多因子模型,提高策略系统性。
-
优化止盈止损点位,降低交易频率的同时保证盈利。
-
增加对突发事件的判断模块,避免在重大事件出现时失效。
本策略基于ICHIMOKU云图和Stoch指标,实现对趋势方向和超买超卖情况的综合判断,能够有效跟踪趋势行情。由于考虑了图形形态和量化指标,使得策略更具系统性。未来可通过优化参数、增加其他指标以及突发事件判断模块等方式进一步优化该策略。
||
This strategy is based on the ICHIMOKU cloud chart pattern indicator and the STOCH random indicator to determine and track trends. The strategy name is "ICHIMOKU Cloud Stoch Trend Tracking Strategy".
The strategy mainly judges the current trend direction and overbought/oversold situations through the ICHIMOKU cloud chart and the STOCH indicator.
When the Conversion Line crosses above the Base Line and the Stoch indicator bounces back from the oversold area, it is considered a bullish trend and the strategy takes a bullish direction. When the Conversion Line crosses below the Base Line and the Stoch indicator falls back from the overbought area, it is considered a bearish trend and the strategy takes a bearish direction.
In the code, the Conversion Line is defined as the average of the highest and lowest prices of the last N1 bars; The Base Line is defined as the average of the highest and lowest prices of the last N2 bars. A bullish signal is generated when the conversion line crosses above the base line.
The Stoch indicator defines overbought and oversold threshold lines, as well as smoothing parameters K and D. A bullish signal is generated when the Stoch bounces back from the oversold area, and a bearish signal is generated when it falls back from the overbought area.
By combining the two indicators, the strategy determines the trend direction.
The strategy combines chart pattern indicators and overbought/oversold indicators to effectively determine the trend direction.
Compared to using a single trend judgment indicator, this strategy comprehensively considers both trend and overrun situations, and can more accurately determine entry timing.
The ICHIMOKU cloud chart can identify medium and long term trends, while the Stoch indicator can discover short-term overbought/oversold situations. The two complement each other to form systematic judgments.
The main risks of this strategy are:
-
The risk of indicator failure in case of black swan events.
-
There is some lag, which may miss part of the trend or reverse opening positions.
-
The combined multiple factors judgment has some subjectivity, and improper parameter settings may cause mistakes.
-
High trading frequency may impact profits due to transaction costs.
Corresponding optimization measures:
-
Combine news events to avoid blind trading during major policy events.
-
Appropriately shorten cycle parameters to reduce lag probability.
-
Optimize parameters through backtesting to improve scientific settings.
-
Appropriately increase take profit and stop loss ranges to reduce trading frequency.
The main optimization directions for this strategy are:
-
Optimize the cycle parameters of the ICHIMOKU conversion line and base line to better fit different market characteristics.
-
Optimize the K, D smoothing parameters and overbought/oversold threshold values of the Stoch indicator.
-
Increase other indicators to form a multifactor model and improve system reliability.
-
Optimize take profit and stop loss points to reduce trading frequency while ensuring profitability.
-
Add a module to judge emergencies and avoid failure during major events.
This strategy combines ICHIMOKU cloud charts and Stoch indicators to make comprehensive judgments on trend direction and overbought/oversold situations, which can effectively track trending markets. By considering chart patterns and quantitative indicators, the strategy is more systematic. Future optimizations may include adjusting parameters, adding other indicators, adding emergency judgment modules, etc.
[/trans]
Strategy Arguments
| Argument | Default | Description |
|---|---|---|
| v_input_int_1 | 20 | length |
| v_input_1 | 5 | smoothK |
| v_input_2 | 3 | smoothD |
| v_input_3 | 25 | OverBought |
| v_input_4 | 65 | OverSold |
| v_input_5 | 1800 | Profit |
| v_input_6 | 1200 | Stop |
| v_input_int_2 | 9 | Conversion Line Length |
| v_input_int_3 | 26 | Base Line Length |
| v_input_int_4 | 52 | Leading Span B Length |
| v_input_int_5 | true | Lagging Span |
Source (PineScript)
/*backtest
start: 2023-10-15 00:00:00
end: 2023-11-14 00:00:00
period: 1h
basePeriod: 15m
exchanges: [{"eid":"Futures_Binance","currency":"BTC_USDT"}]
*/

//@version=5
strategy("ICHI + STOCH V1", overlay=true)
length = input.int(20, minval=1)
smoothK = input(5)
smoothD = input(3)
OverBought = input(25)
OverSold = input(65)
Profit = input(1800)
Stop = input(1200)
k = ta.sma(ta.stoch(close, high, low, length), smoothK)
d = ta.sma(k, smoothD)
co = ta.crossover(k,d)
cu = ta.crossunder(k,d)
conversionPeriods = input.int(9, minval=1, title="Conversion Line Length")
basePeriods = input.int(26, minval=1, title="Base Line Length")
laggingSpan2Periods = input.int(52, minval=1, title="Leading Span B Length")
displacement = input.int(1, minval=1, title="Lagging Span")
conversionLine = math.avg(ta.lowest(conversionPeriods), ta.highest(conversionPeriods))
baseLine = math.avg(ta.lowest(basePeriods), ta.highest(basePeriods))
leadLine1 = math.avg(conversionLine, baseLine)
leadLine2 = math.avg(ta.lowest(laggingSpan2Periods), ta.highest(laggingSpan2Periods))
TREND = ta.ema(math.avg(leadLine1,leadLine2),displacement)
//plot(conversionLine, color=#2962FF, title="Conversion Line")
//plot(baseLine, color=#B71C1C, title="Base Line")
//plot(close, offset = -displacement + 1, color=#43A047, title="Lagging Span")
plot(TREND, color=#2962FF, title="TREND")
p1 = plot(leadLine1,style=plot.style_line, offset = displacement - 1, color=#A5D6A7,
	 title="Leading Span A")

p2 = plot(leadLine2,style=plot.style_line, offset = displacement - 1, color=#EF9A9A,
	 title="Leading Span B")
fill(p1, p2, color = leadLine1 > leadLine2 ? color.rgb(67, 160, 71, 90) : color.rgb(244, 67, 54, 90))
close_price = ta.sma(close,1)
pc = plot(close_price,style=plot.style_line, color=#2a0ab9,
	 title="Price Close")
if (not na(k) and not na(d))
	if (co and k < OverSold)and(close_price > TREND)
		strategy.entry("BUY order", strategy.long, comment="BUY order")
		strategy.exit("exitBUY", "BUY order", profit = Profit, loss = Stop)
	if (cu and k > OverBought)and(close_price < TREND)
		strategy.entry("SELL order", strategy.short, comment="SELL order")
		strategy.exit("exitSELL", "SELL order", profit = Profit, loss = Stop)
//plot(strategy.equity, title="equity", color=color.red, linewidth=2, style=plot.style_areabr)
Detail
https://www.fmz.com/strategy/432182
Last Modified
2023-11-15 11:19:29
