Name
基于Ichimoku云图的量化交易策略Quant-Trading-Strategy-Based-on-Ichimoku-Cloud
Author
ChaoZhang
Strategy Description
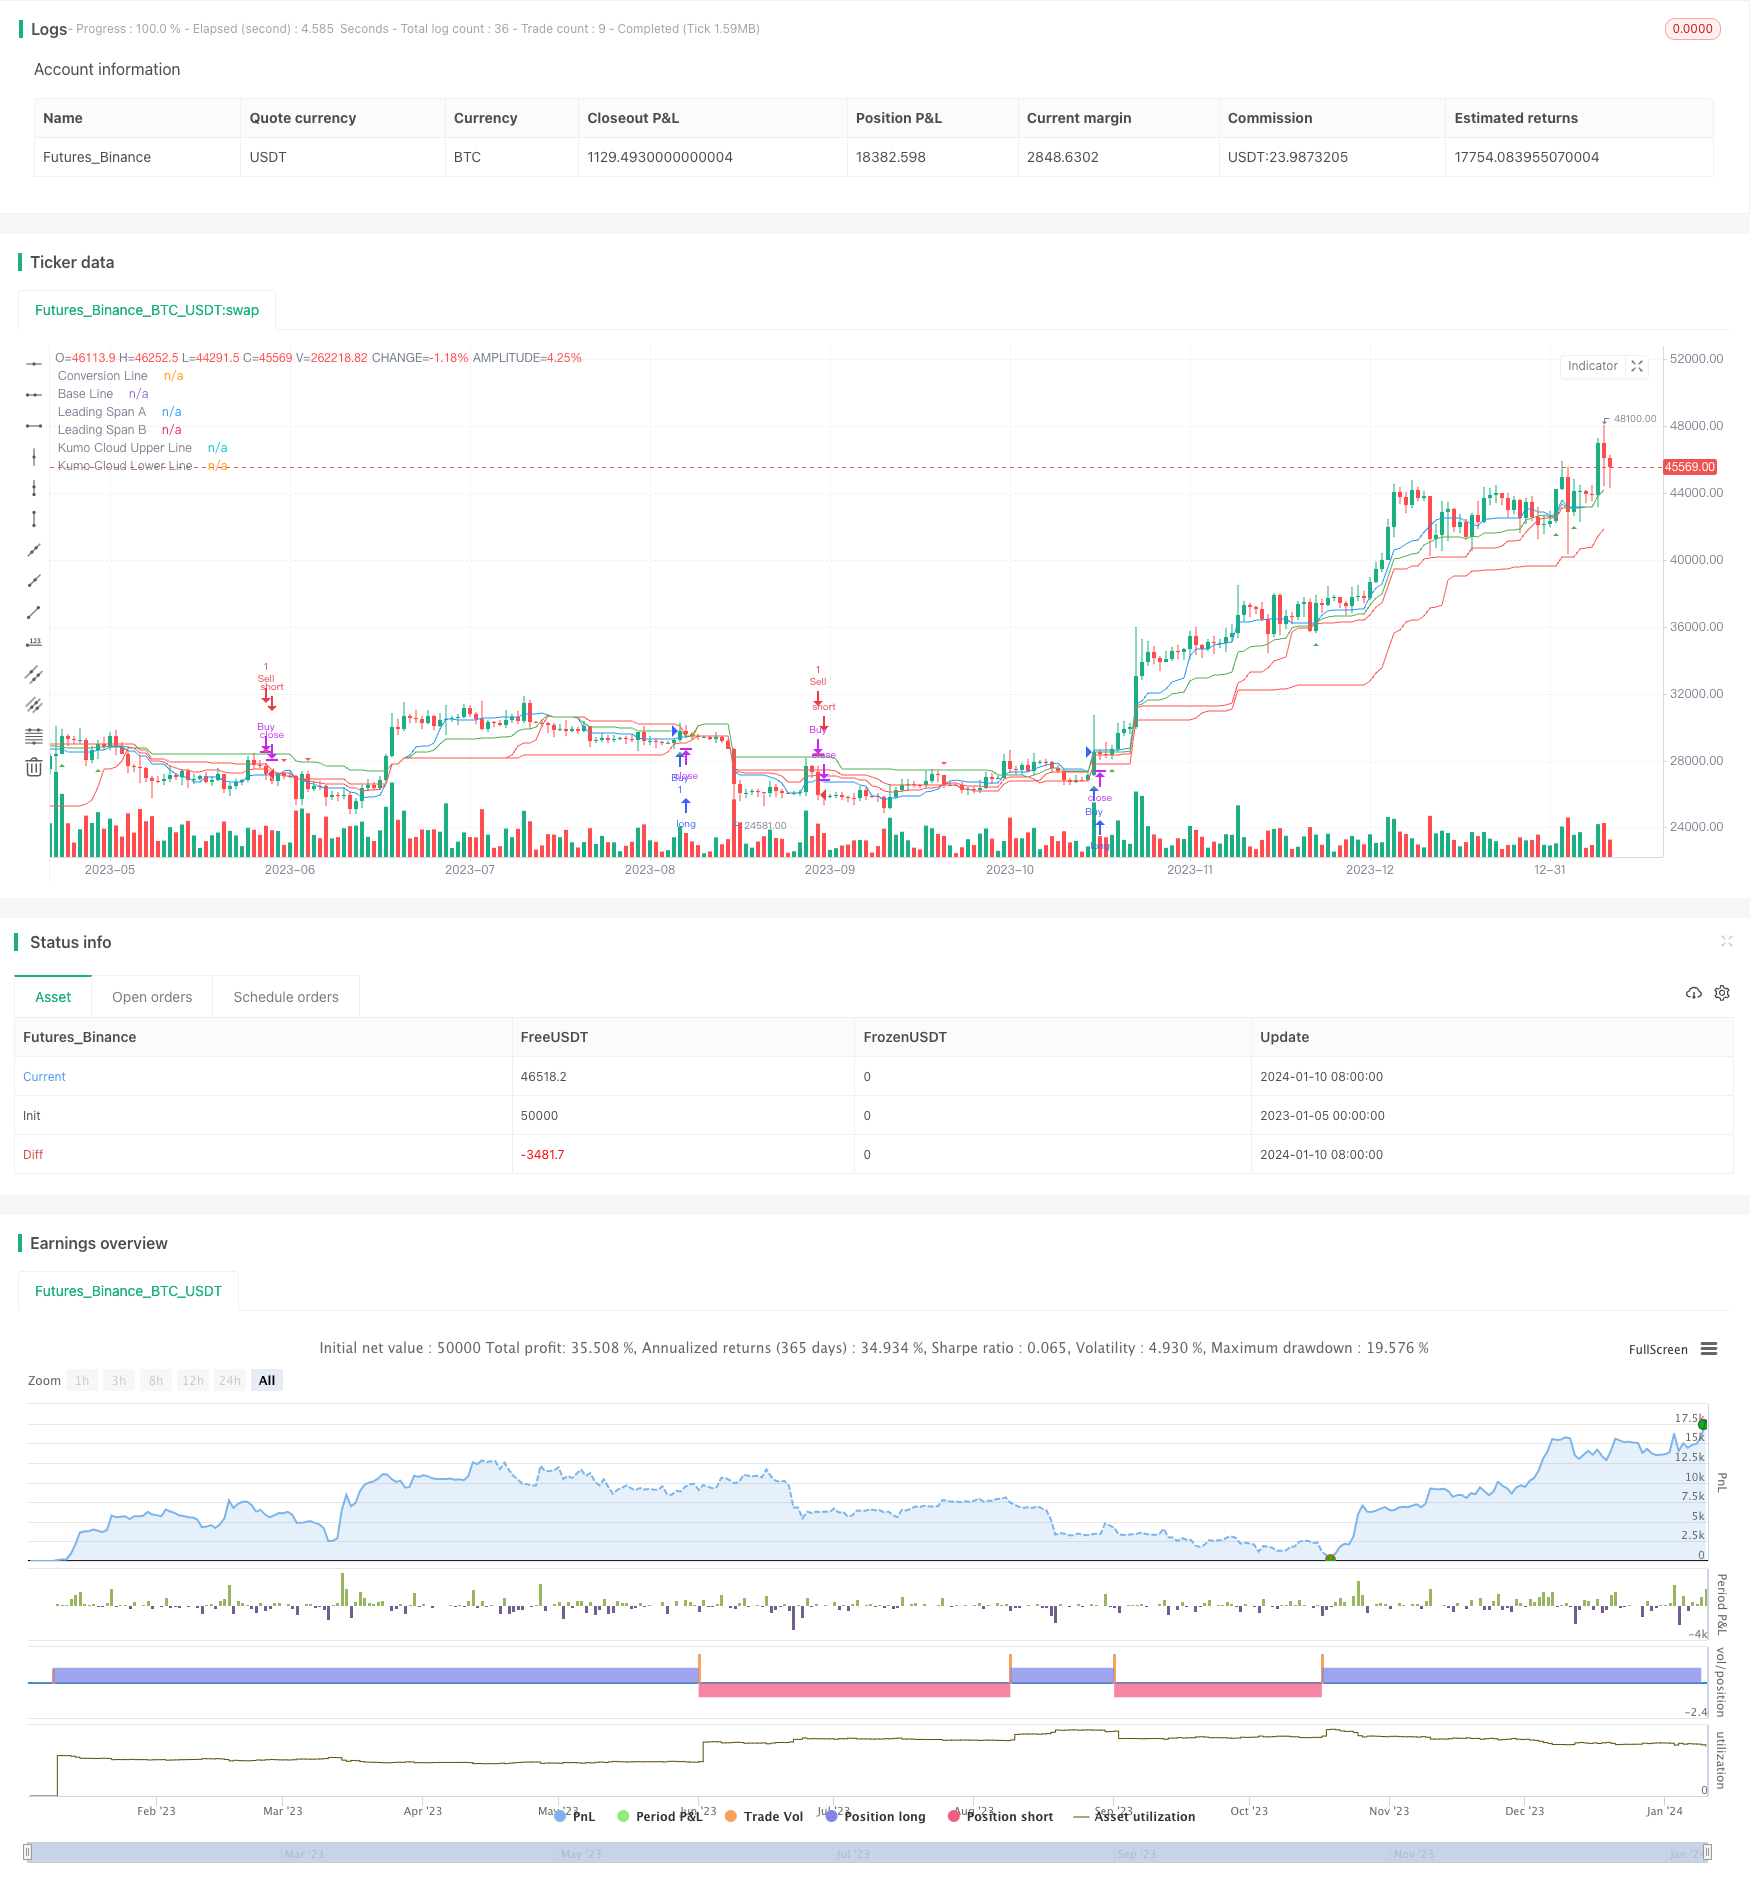
本策略基于Ichimoku云图指标设计了一个量化交易系统,主要用于具有良好趋势的资产。该策略融合了停损、止损、追踪止损等功能,旨在实现稳定的盈利。
Ichimoku云图由转換线、基准线、前沿线1、前沿线2和云图组成。本策略的交易信号来自于价格与云图的关系。具体来说,当价格上穿前沿线1时产生买入信号;当价格下穿前沿线1时产生卖出信号。此外,前沿线2也会作为辅助判断指标。
本策略还设定了基于ATR指标的止损位和止盈位。ATR指标可以有效地捕捉市场的波动程度。止损位为ATR的2倍,止盈位为ATR的4倍。这可以有效控制单笔损失并锁定部分利润。
最后,本策略采用了追踪止损机制。具体来说,对于做多单,会以ATR的2倍作为后撤位,实时调整止损线以锁定利润;对于做空单,会以ATR的2倍作为后撤位,实时调整止损线以锁定利润。
- 基于Ichimoku云图指标,可以有效捕捉趋势
- 结合ATR指标进行止损止盈,可以控制风险
- 采用追踪止损机制,可以很好地锁定利润
- 策略逻辑简单清晰,容易理解和验证
- 可 parametrization,根据不同市场调整参数
- Ichimoku云图对Paramer设置比较敏感,不恰当的设置可能错过交易机会或者产生错误信号
- 追踪止损如果设置的幅度过大,可能会过早止损
- 强势股可能会突破ATR指标给出的止损线或者追踪止损线
- 交易成本也会对盈利能力产生一定影响
对应风险的解决方法:
- 对Ichimoku云图的参数进行优化,找到最适合的设置
- 评估合理的追踪止损幅度,不能过大也不能过小
- 对强势股票可以适当放宽止损范围
- 选择具有低廉手续费的券商
- 结合其他技术指标进行信号过滤,减少错误交易
- 基于历史数据/回测对参数进行优化
- 不同品种参数设置可以进行分别优化
- 可以考虑动态调整止损幅度
- 结合算法进行特征工程,建立更可靠的交易信号
本策略总体来说是一个稳定的趋势跟踪策略。基于Ichimoku云图指标判断趋势方向;利用ATR指标设定止损止盈;采用追踪止损锁定利润。优点是逻辑简洁,容易理解;可以控制单笔损失;可以有效跟踪趋势。但也存在一些参数设置敏感以及止损被突破的风险。通过不断优化参数以及策略本身,可以获得更好的表现。
||
This strategy designs a quantitative trading system based on the Ichimoku Cloud indicator, mainly for assets with good trends. The strategy integrates functions such as stop loss, take profit, and trailing stop loss to achieve stable profits.
The Ichimoku Cloud consists of conversion line, base line, leading span 1, leading span 2 and cloud charts. The trading signals of this strategy come from the relationship between price and cloud charts. Specifically, a buy signal is generated when the price crosses above the leading span 1; A sell signal is generated when the price crosses below the leading span 1. In addition, the leading span 2 also serves as an auxiliary judgment indicator.
This strategy also sets stop loss and take profit based on the ATR indicator. The ATR indicator can effectively capture the degree of market fluctuation. The stop loss is set to 2 times the ATR, and the take profit is set to 4 times the ATR. This can effectively control single loss and lock in some profits.
Finally, the strategy adopts a trailing stop loss mechanism. Specifically, for long positions, it will use 2 times the ATR as the callback amplitude to adjust the stop loss line in real time to lock in profits; for short positions, it will use 2 times the ATR as the callback amplitude to adjust the stop loss line in real time to lock in profits.
- Based on the Ichimoku cloud chart indicator, it can effectively capture trends
- With ATR-based stop loss and take profit, it can control risks
- Adopt trailing stop loss mechanism to lock in profits well
- The strategy logic is simple and clear, easy to understand and verify
- parametrization is available, parameters can be adjusted according to different markets
- Ichimoku cloud maps are very sensitive to parameter settings, improper settings may miss trading opportunities or generate wrong signals
- If the trailing stop loss amplitude is set too large, stop loss may occur prematurely
- Strong stocks may break through the stop loss line or trailing stop loss line given by the ATR indicator
- Transaction costs will also have some impact on profitability
Solutions to corresponding risks:
- Optimize the parameters of Ichimoku cloud maps to find the most appropriate settings
- Evaluate reasonable trailing stop loss amplitude, neither too large nor too small
- For strong stocks, appropriately relax the stop loss range
- Choose brokers with low commissions
- Combine other technical indicators for signal filtering to reduce wrong trades
- Optimize parameters based on historical data/backtesting
- Parameters for different varieties can be optimized separately
- Consider dynamically adjusting the stop loss amplitude
- Combine algorithms to do feature engineering to build more reliable trading signals
In general, this strategy is a stable trend tracking strategy. Judge the trend direction based on the Ichimoku cloud indicator; set stop loss and take profit using the ATR indicator; use trailing stop loss to lock in profits. The advantages are simple logic, easy to understand; single loss can be controlled; trend can be tracked effectively. But there are also some risks of parameter sensitivity and stop loss being broken through. By continuously optimizing parameters and the strategy itself, better performance can be obtained.
[/trans]
Strategy Arguments
| Argument | Default | Description |
|---|---|---|
| v_input_1 | 9 | Conversion Line Length |
| v_input_2 | 26 | Base Line Length |
| v_input_3 | 52 | Leading Span B Length |
| v_input_4 | 26 | Lagging Span |
| v_input_5 | 14 | ATR Length |
Source (PineScript)
/*backtest
start: 2023-01-05 00:00:00
end: 2024-01-11 00:00:00
period: 1d
basePeriod: 1h
exchanges: [{"eid":"Futures_Binance","currency":"BTC_USDT"}]
*/

//@version=5
strategy("Ichimoku Cloud Strategy with SL, TP, and Trailing Stop", overlay=true)

conversionPeriods = input(9, "Conversion Line Length")
basePeriods = input(26, "Base Line Length")
laggingSpan2Periods = input(52, "Leading Span B Length")
displacement = input(26, "Lagging Span")
atrLength = input(14, title="ATR Length")

donchian(len) => math.avg(ta.lowest(len), ta.highest(len))
conversionLine = donchian(conversionPeriods)
baseLine = donchian(basePeriods)
leadLine1 = math.avg(conversionLine, baseLine)
leadLine2 = donchian(laggingSpan2Periods)

// Plot the Ichimoku Cloud components
plot(conversionLine, color=color.blue, title="Conversion Line")
plot(baseLine, color=color.red, title="Base Line")
plot(leadLine1, color=color.green, title="Leading Span A")
plot(leadLine2, color=color.orange, title="Leading Span B")
plot(leadLine1 > leadLine2 ? leadLine1 : leadLine2, color=color.green, title="Kumo Cloud Upper Line")
plot(leadLine1 < leadLine2 ? leadLine1 : leadLine2, color=color.red, title="Kumo Cloud Lower Line")

// ATR for stop loss and take profit
atrValue = ta.atr(atrLength)
stopLoss = atrValue * 2
takeProfit = atrValue * 4

// Strategy entry and exit conditions
longCondition = ta.crossover(close, leadLine1) and close > leadLine2
shortCondition = ta.crossunder(close, leadLine1) and close < leadLine2

// Plot buy and sell signals
plotshape(series=longCondition ? leadLine1 : na, title="Buy Signal", location=location.belowbar, color=color.green, style=shape.triangleup, size=size.small)
plotshape(series=shortCondition ? leadLine1 : na, title="Sell Signal", location=location.abovebar, color=color.red, style=shape.triangledown, size=size.small)

// Execute strategy orders with stop loss and take profit
strategy.entry("Buy", strategy.long, when=longCondition)
strategy.close("Buy", when=shortCondition) // Close buy position when sell condition is met
strategy.entry("Sell", strategy.short, when=shortCondition)
strategy.close("Sell", when=longCondition) // Close sell position when buy condition is met

// Trailing stop
strategy.cancel("Trailing Stop")
var float trailingStopPrice = na
if (longCondition)
    trailingStopPrice := math.max(trailingStopPrice, close - atrValue * 2)
    strategy.exit("Trailing Stop", from_entry="Buy", trail_offset=atrValue * 2, trail_price=trailingStopPrice)
else if (shortCondition)
    trailingStopPrice := math.min(trailingStopPrice, close + atrValue * 2)
    strategy.exit("Trailing Stop", from_entry="Sell", trail_offset=atrValue * 2, trail_price=trailingStopPrice)
Detail
https://www.fmz.com/strategy/438492
Last Modified
2024-01-12 14:20:43
