Name
基于KDJ和RSI的买卖点策略KDJ-RSI-Crossover-Buy-Sell-Signals-Strategy
Author
ChaoZhang
Strategy Description
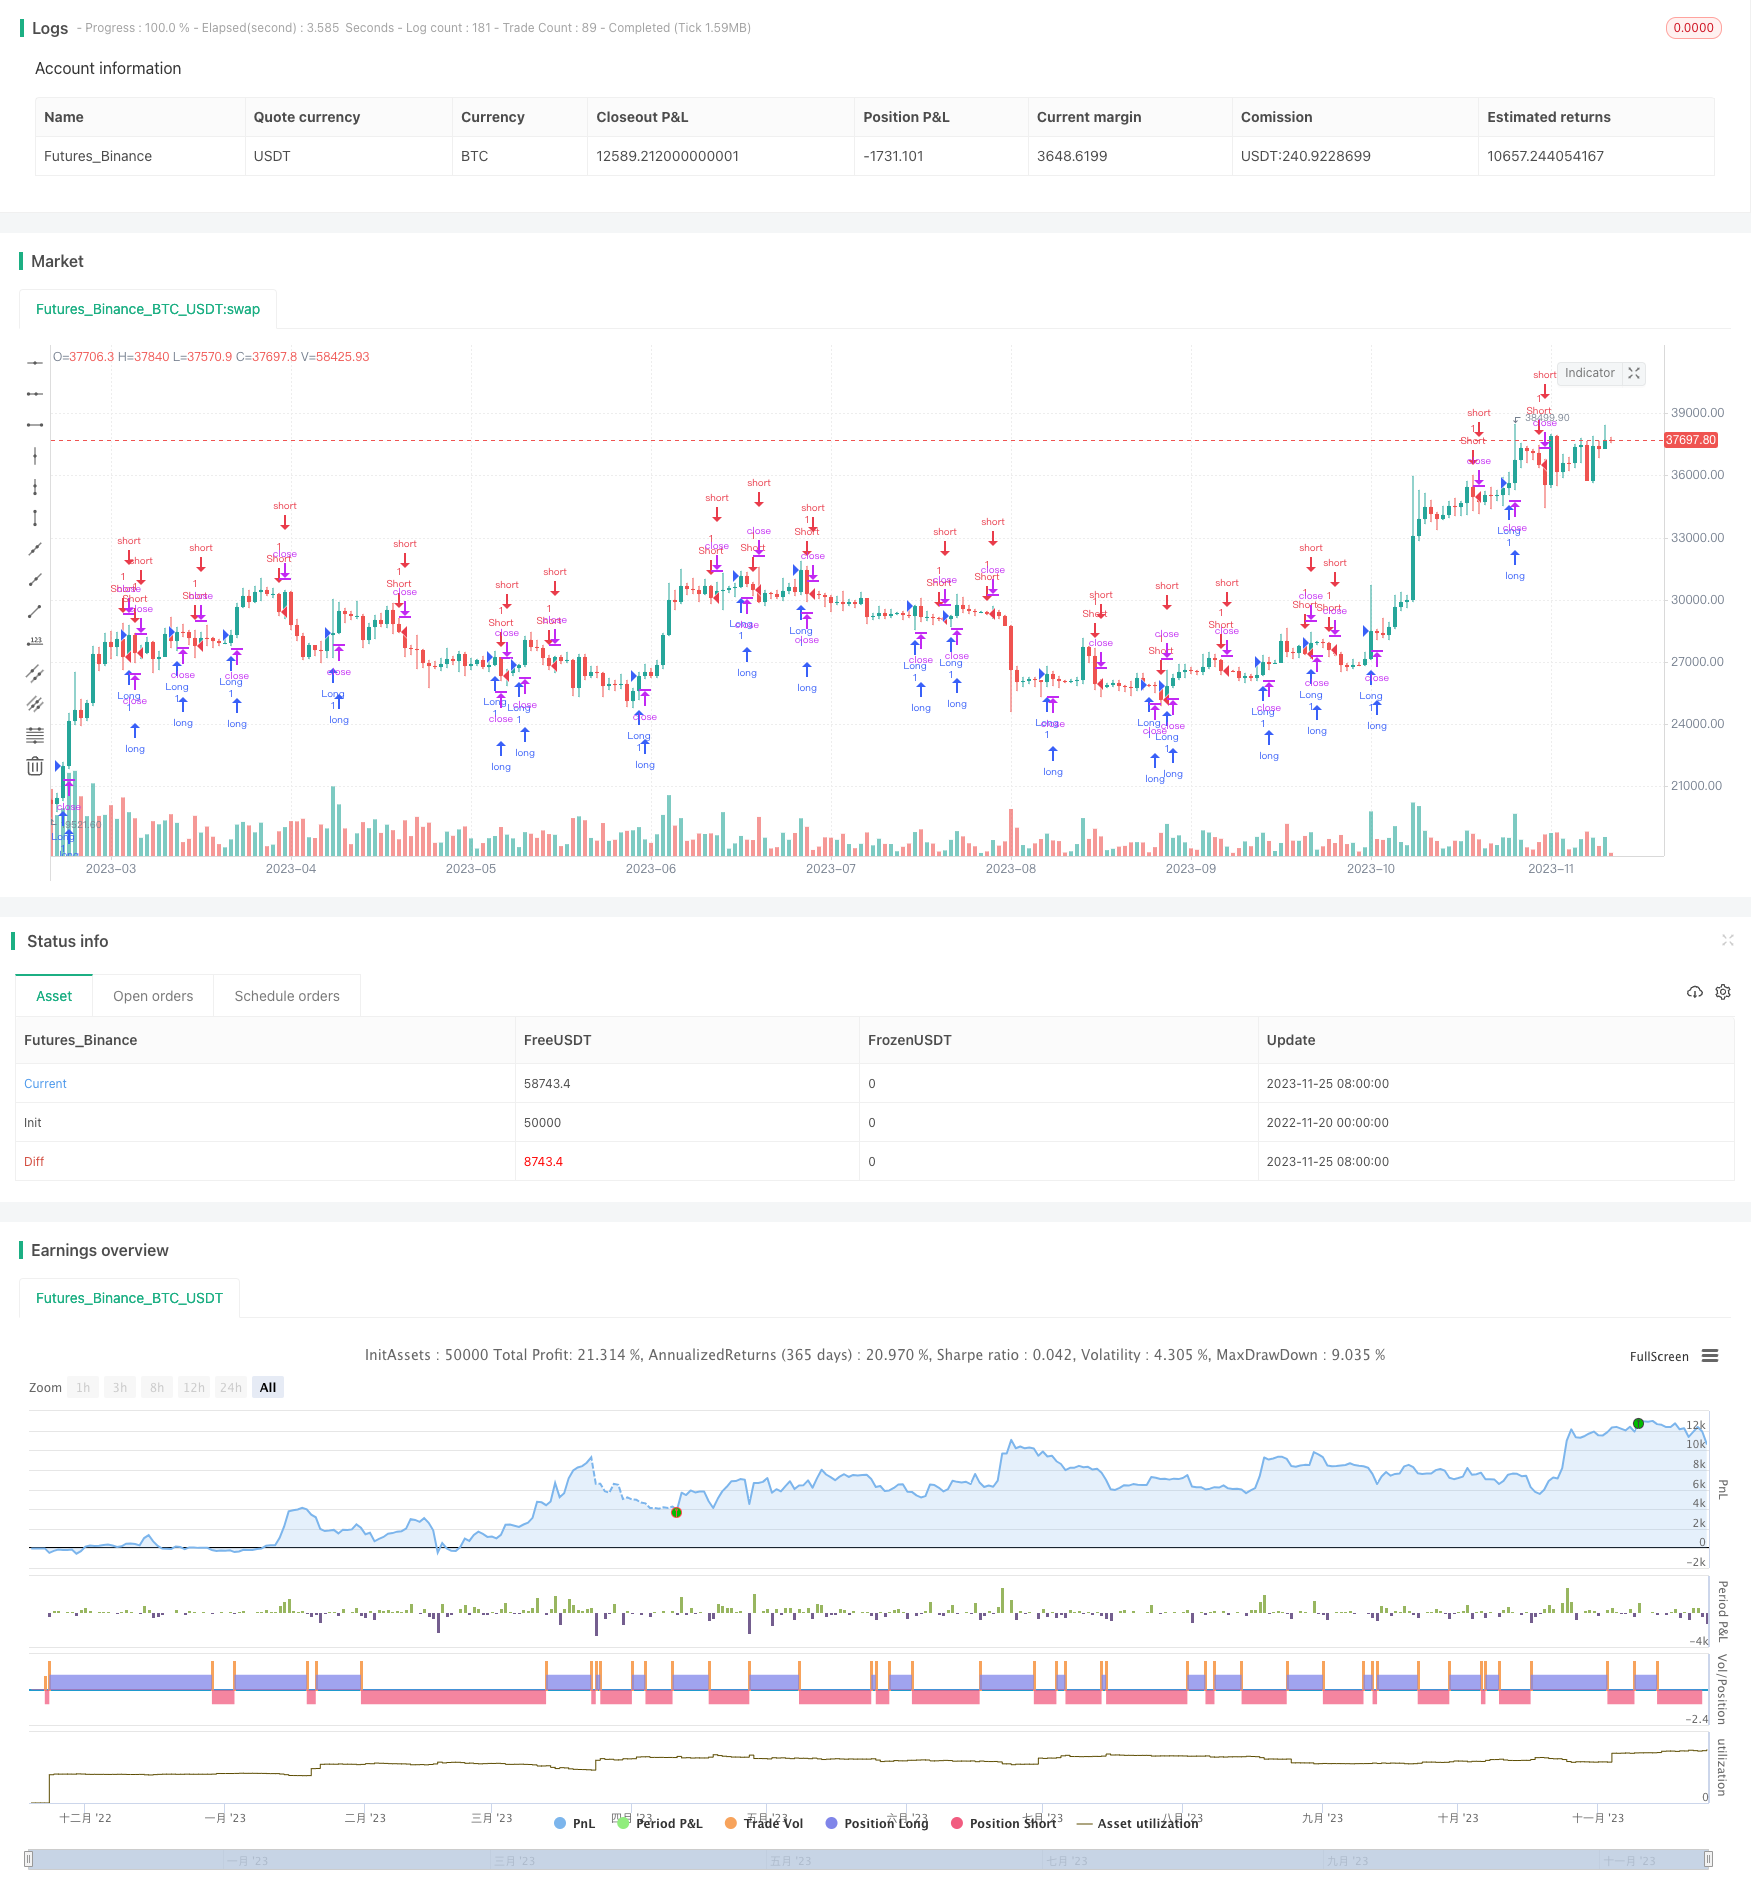
这个策略结合了KDJ指标和RSI指标来确定买入卖出的时机。它在KDJ指标和RSI指标发出买入/卖出信号时发出交易信号。
该策略使用KDJ指标和RSI指标的交叉来判断买入和卖出时机。
具体来说,当KDJ的J线从下方向上穿过K线时视为买入信号,而当J线从上方向下穿过K线时则为卖出信号。这表示股票从超卖状态转为超买状态时买入,从超买状态转为超卖状态时卖出。
同时,该策略结合RSI指标判断强弱信号。RSI小于30为超卖,RSI大于70为超买。当KDJ发出买入信号时,若RSI指标也显示为超卖,则增强买入信号的可靠性。相反,当KDJ发出卖出信号时,若RSI也显示为超买,则增强卖出信号的可靠性。
综上,该策略在以下情况发出交易信号:
买入信号:
- KDJ的J线向上穿过K线 且 RSI(6期) < RSI(12期)
- KDJ的J线向上穿过K线 且 RSI(6期)穿过RSI(24期)
- RSI(6期)穿过RSI(24期) 且 RSI(6期)< 40
卖出信号:
- KDJ的J线向下穿过K线 且 RSI(6期) > RSI(12期)
- KDJ的J线向下穿过K线 且 RSI(6期)穿过RSI(24期)
- RSI(6期)穿过RSI(24期) 且 RSI(6期)> 60
-
结合KDJ指标和RSI指标,使交易信号更加可靠。
-
KDJ指标判断超买超卖状态,RSI指标判断强弱状态,两者结合可以更好抓住转折点。
-
多种买入/卖出条件的组合,避免因单一指标原因而错失良机。
-
RSI的参数设置为6期、12期和24期三组参数,这些参数适用于不同周期级别,使策略适用面更广。
-
KDJ指标和RSI指标都可能出现假信号,从而引发不必要的交易。
-
多重交易条件增加了策略操作的复杂度,需要仔细验证。
-
该策略还需在不同的市场中测试优化,对参数也需要调整。
-
可以测试添加其他指标,如布林线,强化交易信号。
-
可以优化KDJ指标和RSI指标的参数,使其更符合不同周期级别。
-
可以通过提高止损标准来控制风险。
-
可以添加自动止损机制。当价格反向运行时自动止损。
该策略结合KDJ指标和RSI指标的优点,通过双重指标的交叉来判断买入和卖出时机,增强了交易信号的准确性。同时结合不同参数的RSI指标判定多空状态,使策略适用面更广。该策略有效避免了单一指标可能带来的假信号风险。通过优化参数设置及添加辅助指标或止损机制等进行改进,该策略的效果还可进一步提升。
||
This strategy combines the KDJ indicator and RSI indicator to determine the timing of buys and sells. It generates trading signals when the KDJ indicator and RSI indicator issue buy/sell signals.
The strategy uses the crossover of the KDJ indicator and RSI indicator to judge the timing of buys and sells.
Specifically, when the J line of the KDJ crosses above the K line from the bottom up, it is considered a buy signal. And when the J line crosses below the K line from the top down, it is a sell signal. This means buying when the stock turns from oversold to overbought and selling when it turns from overbought to oversold.
At the same time, the strategy incorporates the RSI indicator to judge the strength of signals. RSI below 30 is oversold and RSI above 70 is overbought. When the KDJ issues a buy signal, if the RSI indicator also shows oversold, it enhances the reliability of the buy signal. Conversely, when the KDJ issues a sell signal, if the RSI also shows overbought, it enhances the reliability of the sell signal.
In summary, this strategy generates trading signals in the following situations:
Buy signals:
- KDJ’s J line crosses above K line AND RSI(6) < RSI(12)
- KDJ’s J line crosses above K line AND RSI(6) crosses above RSI(24)
- RSI(6) crosses above RSI(24) AND RSI(6) < 40
Sell signals:
- KDJ’s J line crosses below K line AND RSI(6) > RSI(12)
- KDJ’s J line crosses below K line AND RSI(6) crosses below RSI(24)
- RSI(6) crosses below RSI(24) AND RSI(6) > 60
-
Combining the KDJ indicator and RSI indicator makes trading signals more reliable.
-
The KDJ indicator judges the overbought/oversold state, while the RSI indicator judges the strength. Combining both can better capture turning points.
-
Multiple buy/sell conditions avoid missing opportunities due to reasons from a single indicator.
-
The RSI parameters are set to 6, 12 and 24 periods, which are suitable for different cycle levels, making the strategy more versatile.
-
Both the KDJ and RSI indicators can give false signals, leading to unnecessary trades.
-
The multiple trade conditions increase the complexity of strategy operations and require careful verification.
-
The strategy needs to be tested and optimized in different markets, and parameters need adjustment.
-
Test adding other indicators like Bollinger Bands to strengthen trading signals.
-
Optimize parameters of KDJ and RSI to make them fit different cycle levels.
-
Increase the stop loss standards to control risks.
-
Add automatic stop loss mechanisms to stop loss when prices reverse.
This strategy combines the advantages of the KDJ indicator and RSI indicator by using the crossover of the two indicators to determine the timing of buys and sells, which improves the accuracy of trading signals. Using RSI indicators with different parameters also makes the strategy more versatile. This strategy effectively avoids the risk of false signals that may occur with a single indicator. By improving parameters, adding auxiliary indicators, stop loss mechanisms, etc., the performance of this strategy can be further enhanced.
[/trans]
Strategy Arguments
| Argument | Default | Description |
|---|---|---|
| v_input_1 | 9 | KDJ length |
| v_input_2 | 3 | signal |
| v_input_3 | 6 | rsi_length_1 |
| v_input_4 | 12 | rsi_length_2 |
| v_input_5 | 24 | rsi_length_3 |
Source (PineScript)
/*backtest
start: 2022-11-20 00:00:00
end: 2023-11-26 00:00:00
period: 1d
basePeriod: 1h
exchanges: [{"eid":"Futures_Binance","currency":"BTC_USDT"}]
*/

// This source code is subject to the terms of the Mozilla Public License 2.0 at https://mozilla.org/MPL/2.0/
// © innocentChart76064

//@version=5
strategy(title = "buy/sell KDJ RSI", overlay=true)

//Define KDJ parameter
kdj_length = input(9, title = "KDJ length")
signal = input(3,title="signal")

// Calculate KDJ values
bcwsma(s,l,m) =>
    _bcwsma = float(na)
    _s = s
    _l = l
    _m = m
    _bcwsma := (_m*_s+(_l-_m)*nz(_bcwsma[1]))/_l
    _bcwsma

c = close
h = ta.highest(high, kdj_length)
l = ta.lowest(low,kdj_length)
RSV = 100*((c-l)/(h-l))
kdj_k = bcwsma(RSV, signal, 1)
kdj_d = bcwsma(kdj_k, signal, 1)
kdj_j = 3 * kdj_k-2 * kdj_d

//Define RSI parameter
rsi_length_1 = input(6)
rsi_length_2 = input(12)
rsi_length_3 = input(24)
price = close

//Calculate RSI values
rsi_1 = ta.rsi(price, rsi_length_1)
rsi_2 = ta.rsi(price, rsi_length_2)
rsi_3 = ta.rsi(price, rsi_length_3)

// Trading conditions
longCondition = ta.crossover(kdj_j,kdj_k) and rsi_1 > rsi_2 or ta.crossover(kdj_j,kdj_k) and ta.crossover(rsi_1,rsi_3) or ta.crossover(rsi_1,rsi_3) and rsi_1<40
shortCondition = ta.crossunder(kdj_j,kdj_k) and rsi_1 < rsi_2 or ta.crossunder(kdj_j,kdj_k) and ta.crossunder(rsi_1,rsi_3) or ta.crossunder(rsi_1,rsi_3) and rsi_1>60
// Enter long trade
strategy.entry("Long", strategy.long, when=longCondition)

// Enter short trade
strategy.entry("Short", strategy.short, when=shortCondition)
Detail
https://www.fmz.com/strategy/433394
Last Modified
2023-11-27 10:57:16
