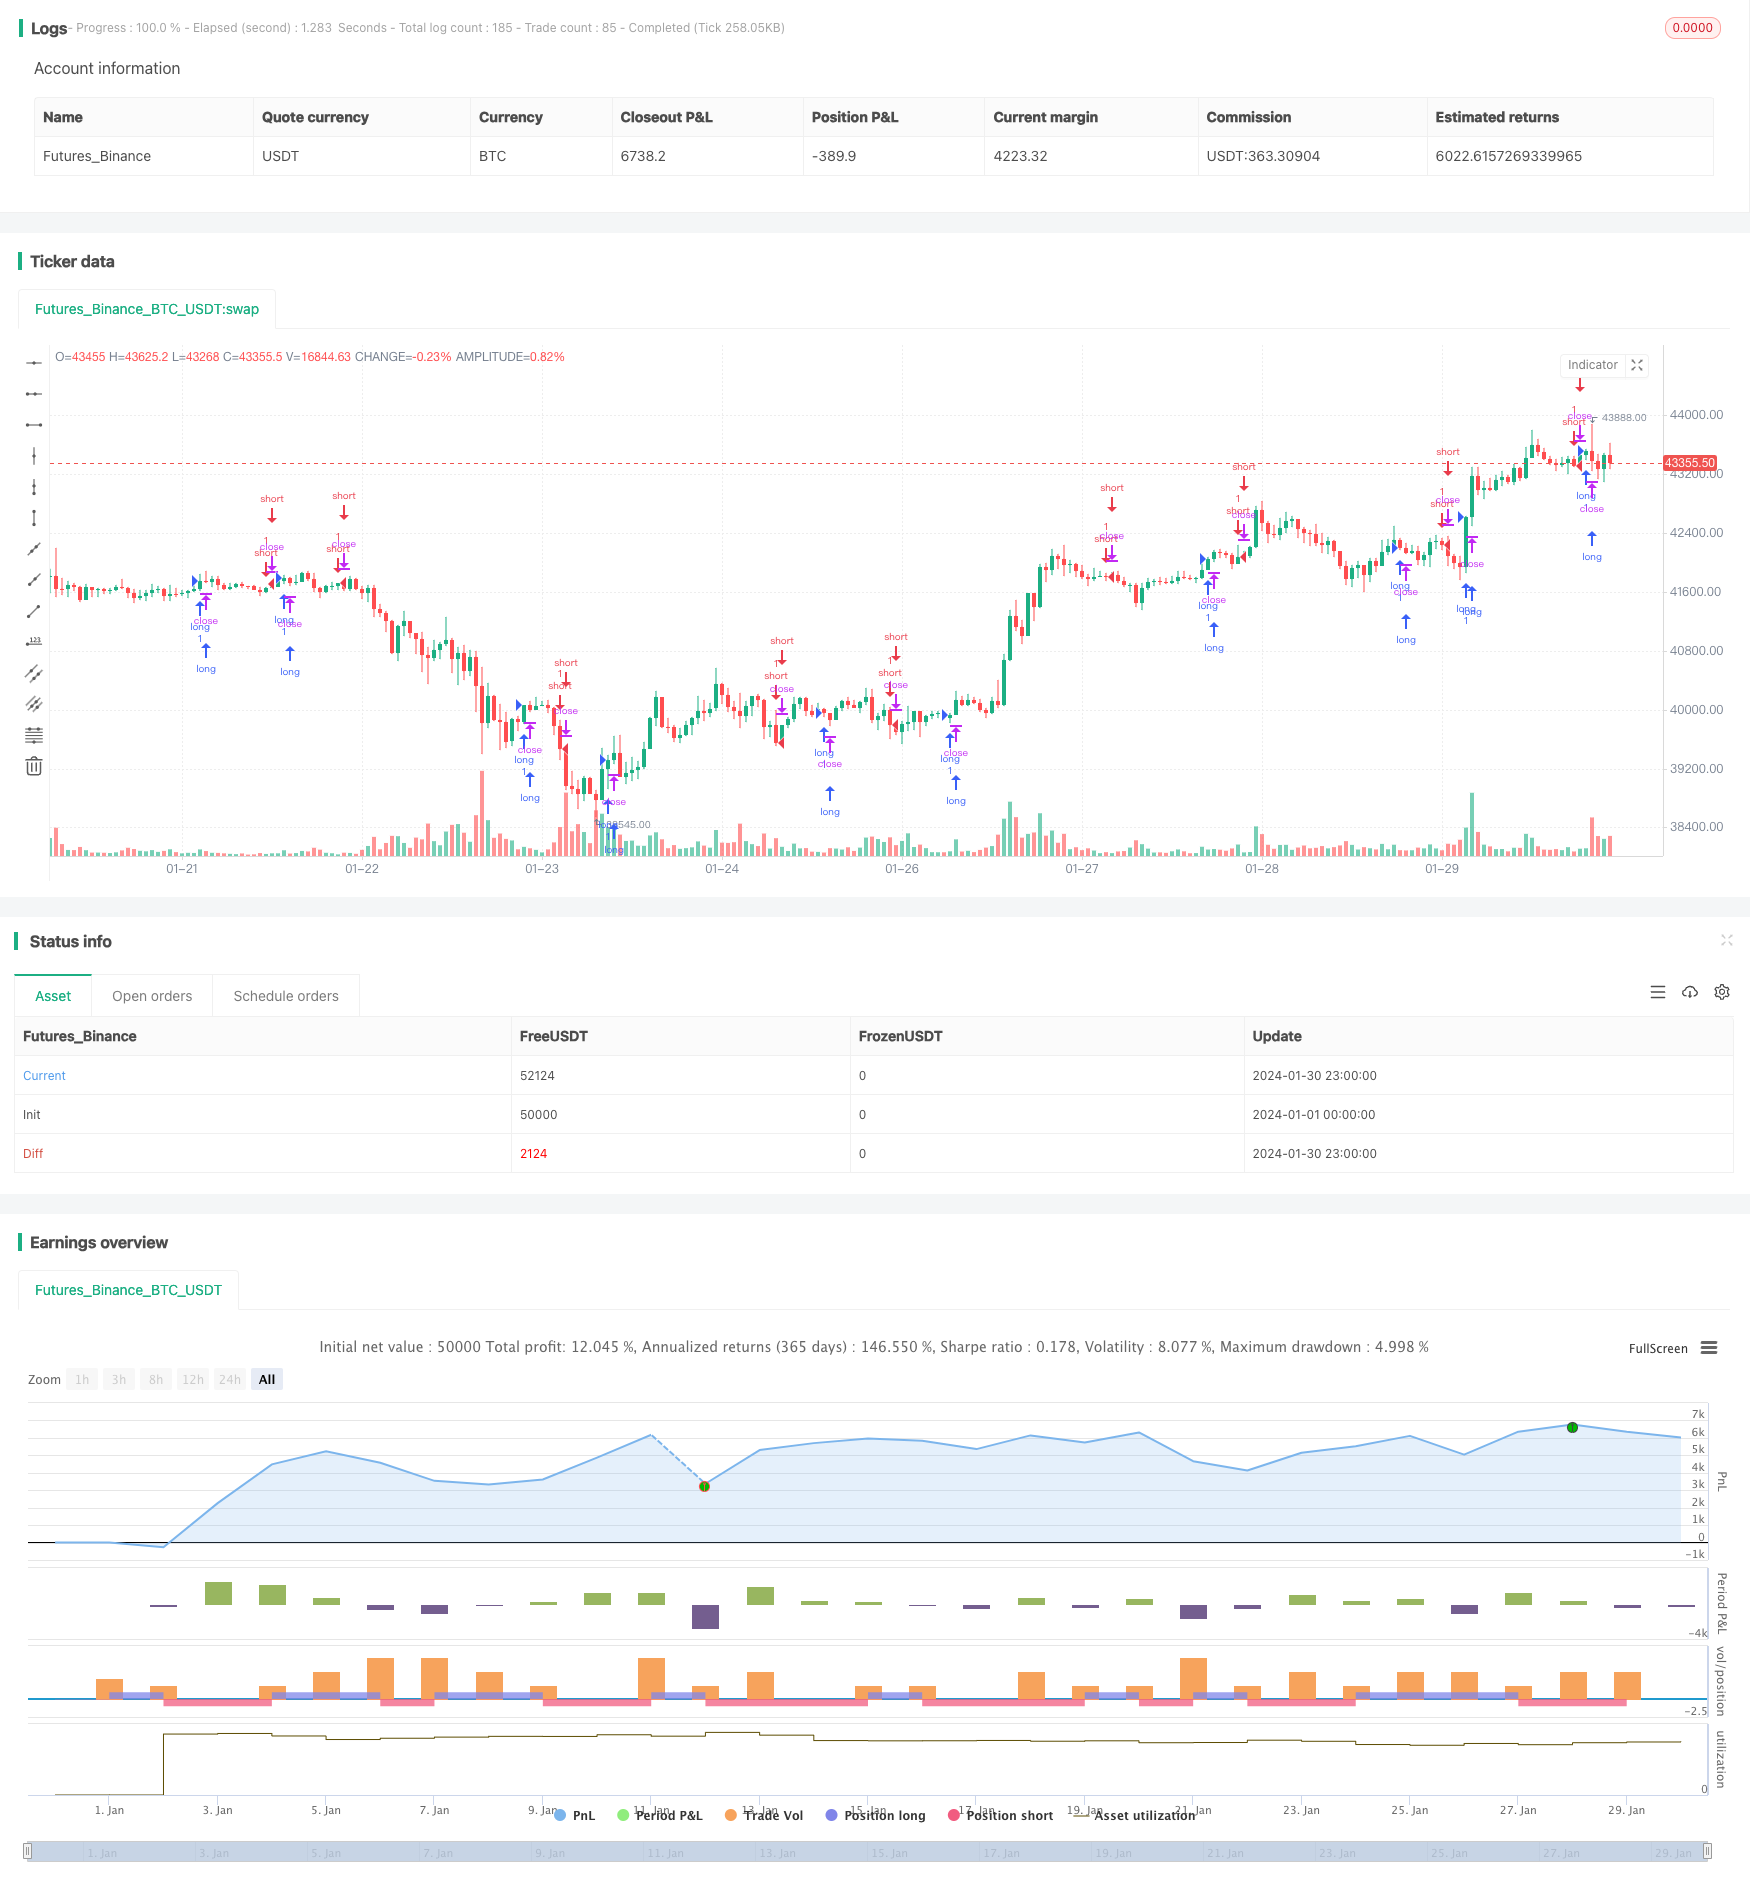
Name
基于MACD与随机指标的加密货币交易策略Cryptocurrency-Trading-Strategy-Based-on-MACD-and-Stochastic-Indicators
Author
ChaoZhang
Strategy Description
本策略是一种基于MACD指标与随机指标组合的加密货币交易策略。它通过计算比特币价格的MACD指标并对其施加随机指标,产生交易信号,以捕捉加密货币市场的趋势变化。
该策略首先计算MACD指标。MACD代表移动平均收敛离差,是一种趋势跟踪指标。它由快线和慢线组成,快线是较短期的指数移动平均线,慢线是较长期的指数移动平均线。当快线上穿慢线时为金叉信号,表示市场转为看涨;当快线下穿慢线时为死叉信号,表示市场转为看跌。
在计算出MACD指标后,该策略对MACD指标本身再施加随机指标%K。随机指标%K的计算公式为:
%K = (当前收盘价 - N日内最小价) / (N日内最大价 - N日内最小价) * 100
随机指标反映股价脱离最近范围的变化情况。%K值在20-80之间的波动代表股价走势处于盘整范围。当%K从下向上穿过20线时,为买入讯号。当%K从上向下穿过80线时,为卖出讯号。
本策略结合MACD指标和随机指标%K的交易信号,在加密货币市场中进行交易。当随机指标%K向上穿过20时产生买入讯号;当随机指标%K向下穿过80时产生卖出讯号。
这种策略结合了趋势分析和超买超卖指标,能有效识别市场重要的转折点。相比单一使用MACD或随机指标,%K和MACD的组合使用,可以增加信号的可靠性,减少假信号。
另外,本策略应用股票市场中常用的技术指标于加密货币交易,这是一种跨市场的化用。这种指标在数字货币市场同样适用,甚至会由于数字货币的高波动性而获得更好的效果。
该策略最大的风险在于加密货币市场高度波动,容易产生虚假信号导致交易亏损。此外,技术指标发出信号时,价格可能已经产生一定幅度的变动,存在无法充分捕捉趋势初期的风险。
为控制这些风险,建议采用移动止损来锁定利润,避免亏损进一步扩大。同时,也可以适当调整参数,使用不同周期长度来发掘更多潜在机会。
第一,该策略可以尝试将移动平均线与波动率指标结合使用,例如布林带,设置波动率参数来识别突破的有效性,避免虚假信号。
第二,可以引入机器学习模型对历史数据进行训练,建立随机森林或者LSTM神经网络模型,辅助判断指标信号的有效性。
第三,增加止损机制。当价格向不利方向移动超过一定幅度时,自动执行止损以控制风险。
本策略结合MACD指标和随机指标%K,利用两种指标互相验证信号的方法,制定加密货币的交易策略。这种组合指标策略,可以在一定程度上提高信号的准确性。但我们也需要警惕指标组合过于复杂可能带来的noise和lagging效应。参数设置和风险控制同样重要,需要根据不同市场环境进行调整优化,才能获得较好的策略表现。
||
This strategy is a cryptocurrency trading strategy based on a combination of the MACD indicator and stochastic indicators. It generates trading signals by calculating the MACD indicator of bitcoin prices and applying stochastic indicators on it, in order to capture trend changes in the cryptocurrency market.
The strategy first calculates the MACD indicator. MACD stands for Moving Average Convergence Divergence, which is a trend-following indicator. It consists of a fast line and a slow line, where the fast line is a shorter-term exponential moving average and the slow line is a longer-term exponential moving average. When the fast line crosses above the slow line, it generates a golden cross signal, indicating a bullish market. When the fast line crosses below the slow line, it generates a death cross signal, indicating a bearish market.
After calculating the MACD indicator, the strategy applies the stochastic indicator %K on the MACD itself. The calculation formula for %K is:
%K = (Current Close - Lowest Low over N periods) / (Highest High over N periods - Lowest Low over N periods) * 100
The stochastic indicator reflects the price deviation from its recent range. The fluctuation of %K between 20-80 represents the price is trading in consolidation. When %K crosses above 20 from below, it generates a buy signal. When %K crosses below 80 from above, it generates a sell signal.
This strategy combines the trading signals from both the MACD and stochastic %K to trade in the cryptocurrency market. It generates a buy signal when %K crosses above 20 and a sell signal when %K crosses below 80.
This strategy combines trend analysis and overbought-oversold indicators, which can effectively identify important turning points in the market. Compared to using MACD or stochastic alone, the combination of %K and MACD increases the reliability of trading signals and reduces false signals.
In addition, this strategy applies technical indicators commonly used in stock markets to cryptocurrency trading. This is a cross-market application. These indicators are equally applicable in the digital currency market, and may even perform better due to the high volatility of cryptocurrencies.
The biggest risk of this strategy is the high volatility in the cryptocurrency market, which easily produces false signals and leads to trading losses. In addition, when indicators generate signals, prices may have already moved substantially, posing the risk of missing early trend signals.
To control these risks, it is advisable to use moving stop loss to lock in profits and avoid further losses. At the same time, parameters can also be adjusted appropriately to discover more potential opportunities using different time frame lengths.
Firstly, the strategy can try to combine moving averages with volatility indicators such as Bollinger Bands, setting volatility parameters to identify the validity of breakouts and avoid false signals.
Secondly, machine learning models can be introduced to train on historical data and establish random forest or LSTM neural network models to assist in judging the effectiveness of indicator signals.
Thirdly, add a stop loss mechanism. When prices move more than a certain range in an unfavorable direction, automatically trigger stop loss to control risks.
This strategy combines the MACD indicator and the stochastic indicator %K, using the method of mutually verifying signals from two indicators to formulate a cryptocurrency trading strategy. This combination indicator strategy can improve the accuracy of signals to some extent. But we also need to be aware of the risk of over-complication of indicators, which may introduce noise and lagging effects. Proper parameter tuning and risk control according to different market environments are equally important for obtaining better strategy performance.
[/trans]
Strategy Arguments
| Argument | Default | Description |
|---|---|---|
| v_input_1 | 23 | MACD Fast Length |
| v_input_2 | 50 | MACD Slow Length |
| v_input_3 | 10 | Cycle Length |
| v_input_4 | 3 | 1st %D Length |
| v_input_5 | 3 | 2nd %D Length |
| v_input_6_close | 0 | Source: close |
| v_input_7 | true | Highlight Breakouts ? |
| v_input_8 | 75 | upper |
| v_input_9 | 25 | lower |
Source (PineScript)
/*backtest
start: 2024-01-01 00:00:00
end: 2024-01-31 00:00:00
period: 1h
basePeriod: 15m
exchanges: [{"eid":"Futures_Binance","currency":"BTC_USDT"}]
*/

//@version=3
strategy("Schaff Trend Cycle Strategy", shorttitle="STC Backtest", overlay=true)

fastLength = input(title="MACD Fast Length",  defval=23)
slowLength = input(title="MACD Slow Length",  defval=50)
cycleLength = input(title="Cycle Length",  defval=10)
d1Length = input(title="1st %D Length",  defval=3)
d2Length = input(title="2nd %D Length",  defval=3)
src = input(title="Source", defval=close)
highlightBreakouts = input(title="Highlight Breakouts ?", type=bool, defval=true)

macd = ema(src, fastLength) - ema(src, slowLength)
k = nz(fixnan(stoch(macd, macd, macd, cycleLength)))
d = ema(k, d1Length)
kd = nz(fixnan(stoch(d, d, d, cycleLength)))

stc = ema(kd, d2Length)
stc := 	stc > 100 ? 100 : stc < 0 ? 0 : stc

upper = input(75, defval=75)
lower = input(25, defval=25)

long =  crossover(stc, lower) ? lower : na
short = crossunder(stc, upper) ? upper : na

long_filt = long and not short
short_filt = short and not long

prev = 0
prev := long_filt ? 1 : short_filt ? -1 : prev[1]

long_final = long_filt and prev[1] == -1
short_final = short_filt and prev[1] == 1

//alertcondition(long_final, "Long", message="Long")
//alertcondition(short_final,"Short", message="Short")

//plotshape(long_final, style=shape.arrowup, text="Long", color=green, location=location.belowbar)
//plotshape(short_final, style=shape.arrowdown, text="Short", color=red, location=location.abovebar)

strategy.entry("long", strategy.long, when = long )
strategy.entry("short", strategy.short, when = short)
Detail
https://www.fmz.com/strategy/440703
Last Modified
2024-02-01 11:52:15
