Name
基于MACD与RSI组合策略A-Combined-Strategy-with-MACD-and-RSI
Author
ChaoZhang
Strategy Description
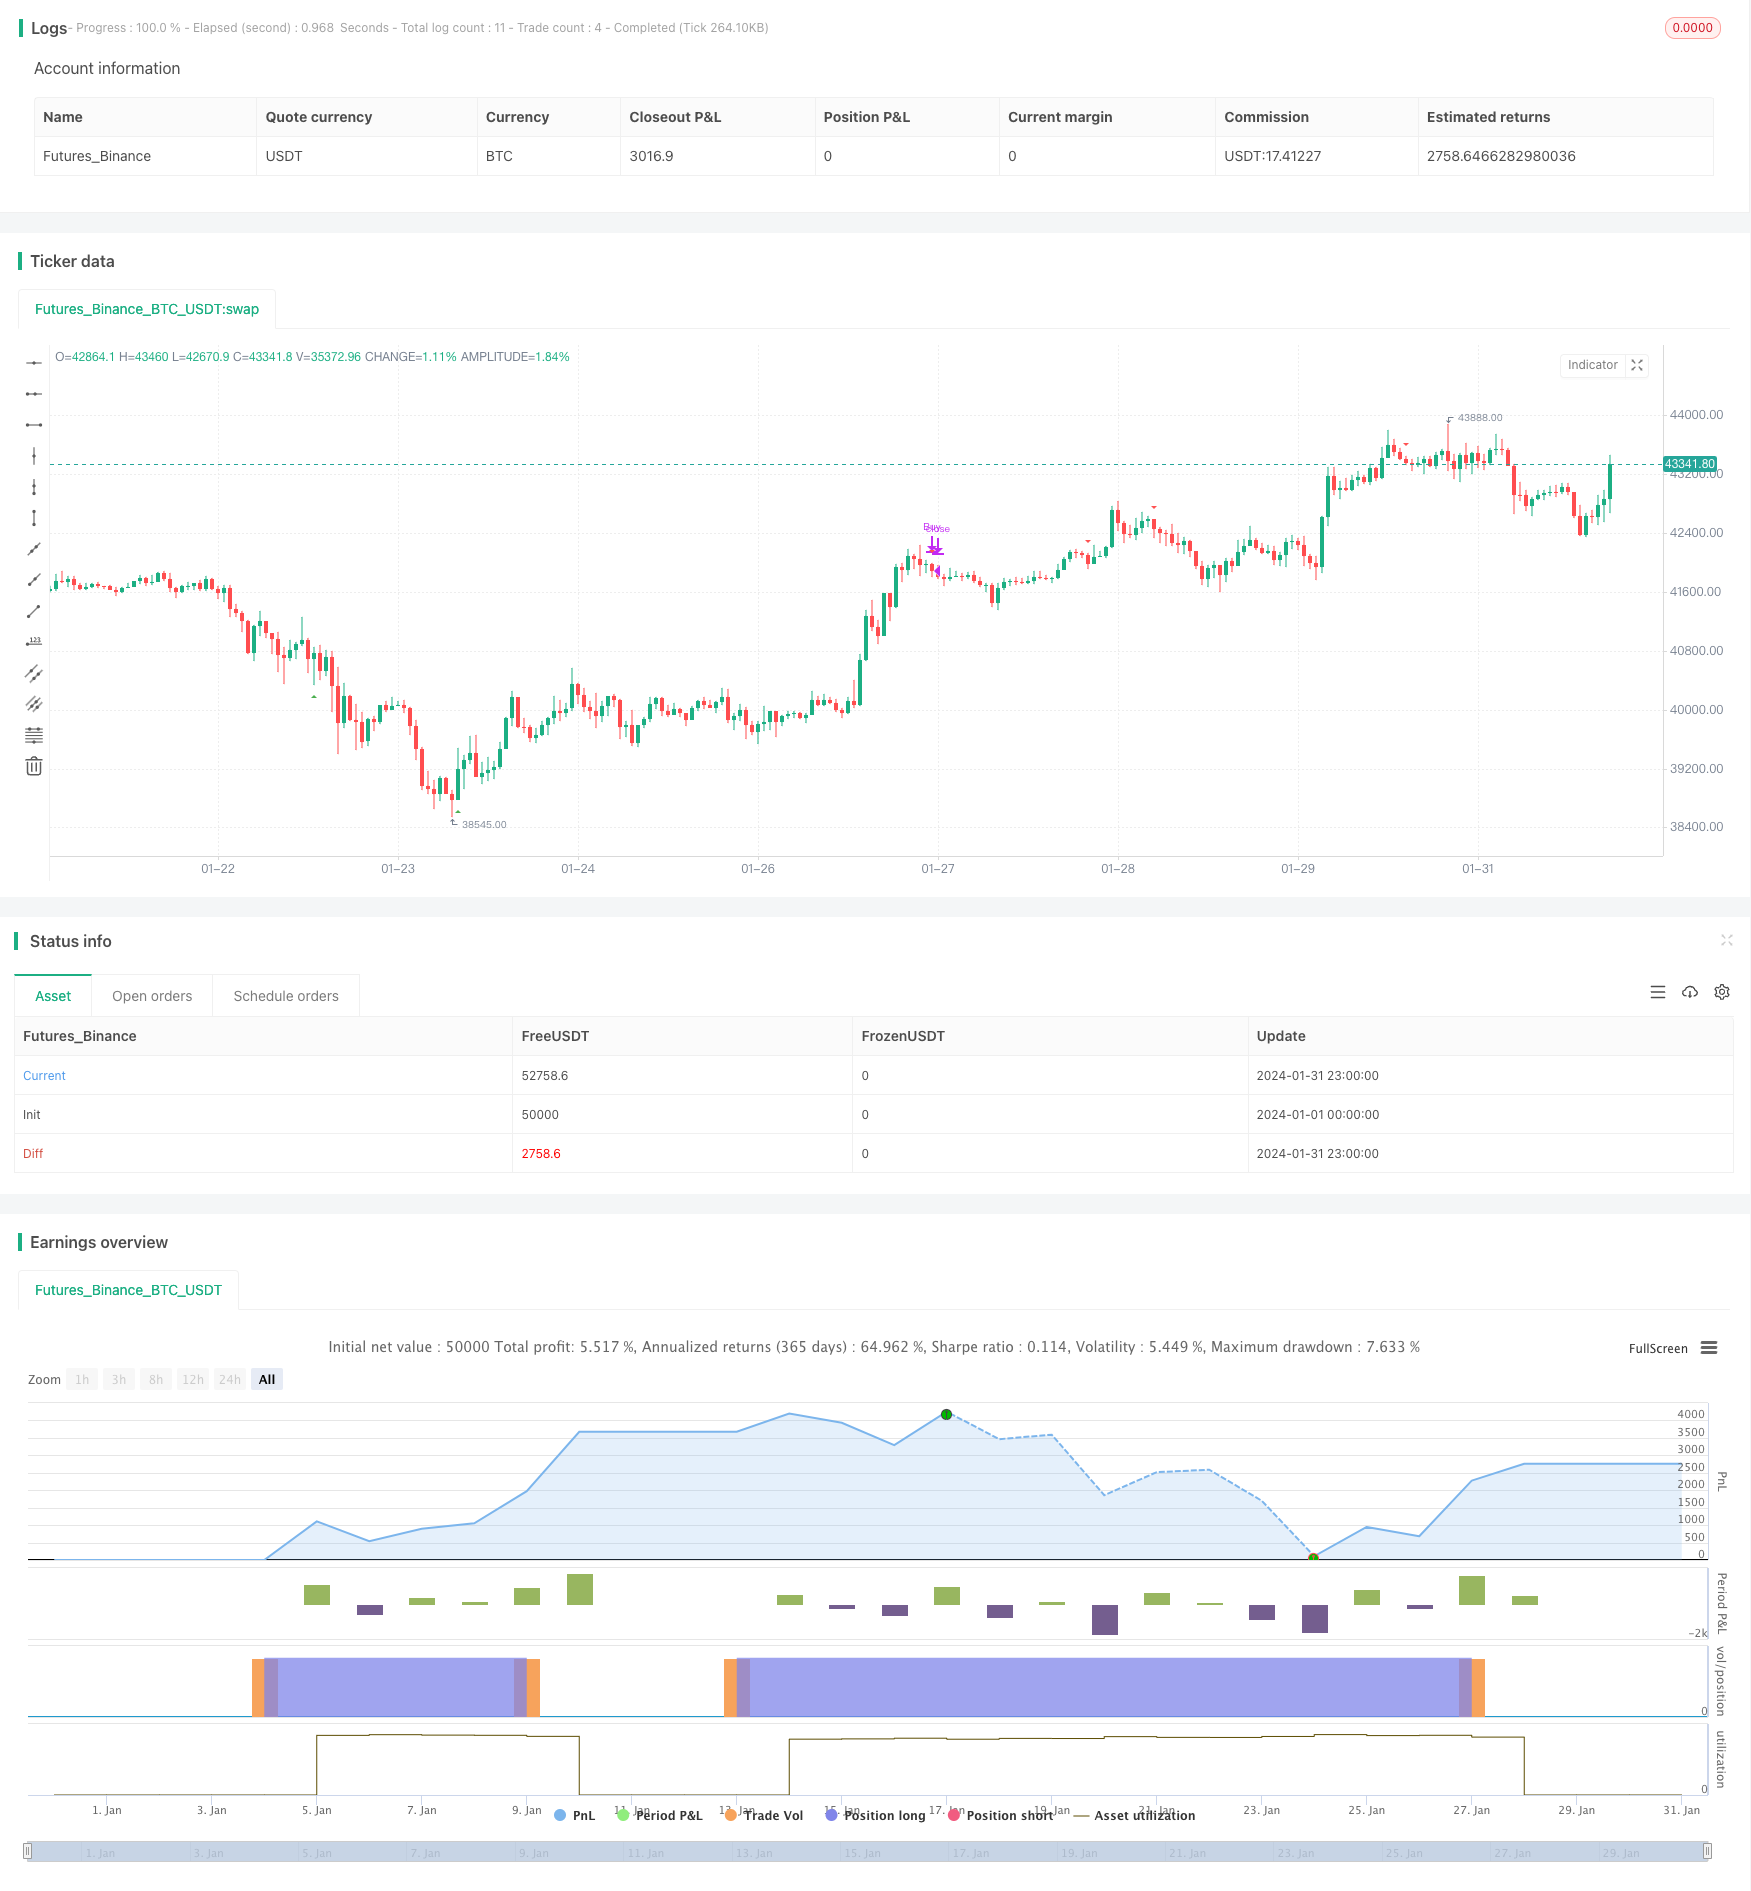
该策略通过组合MACD和RSI两个指标来识别趋势反转点,实现低买高卖。当MACD指标出现金叉时并且RSI指标处于超卖状态,进行买入操作。当MACD指标出现死叉时并且RSI指标达到超买状态,进行卖出操作,完成一次交易循环。
MACD指标由快线,慢线和柱状线组成。快线是短期平均线,慢线是长期平均线。当快线从下向上突破慢线时产生买入信号,这表示市场进入多头趋势;当快线从上向下跌破慢线时产生卖出信号,这表示市场进入空头趋势。
RSI指标反映市场的超买超卖情况。RSI高于70时表示市场超买,RSI低于30时表示市场超卖。
买入条件:MACD快线上穿慢线(金叉)并且RSI低于40(超卖)时,进行买入操作。
卖出条件:MACD快线下穿慢线(死叉)并且RSI高于60(超买)时,进行卖出操作。
该策略通过MACD指标判断市场趋势方向,同时利用RSI指标识别超买超卖区域,从而捕捉市场反转买卖点。
-
结合多个指标,提高策略的稳定性和胜率。MACD指标判断趋势方向,RSI指标识别反转时间点,二者相互验证提高信号的可靠性。
-
有效识别低吸引地和高离地,通过RSI指标的超买超卖水平配合MACD指标的金叉死叉信号,能够准确抓住市场的关键反转点。
-
简单明了的交易信号和规则。策略信号来自两个经典且广为人知的指标,明确判定的交易规则有利于实盘的执行。
-
灵活度高,易于优化。可以通过调整指标参数以及组合其他技术指标来丰富策略规则,优化策略以适应不同品种和交易风格。
-
可能产生多次亏损交易的风险。当行情出现假突破时,会产生不必要的交易亏损。
-
无法建立止损机制的风险。策略本身没有设置止损点,长期亏损可能扩大。
-
MACD和RSI失效的风险。如果行情进入震荡期或特殊行情,MACD和RSI指标将会产生大量无效信号。
-
盲目优化的风险。如果没有对市场和品种特性有足够了解,盲目调整参数和优化策略可能导致超优化。
可以通过设定止损点、评估市场态势、谨慎优化参数、组合其他指标等方法来降低上述风险,提高策略的稳定性。
-
设置止损机制。添加移动止损或者百分比止损来控制单笔亏损。
-
评估多重时间周期。评估不同时间周期下MACD和RSI指标的效果,选择最优时间周期。
-
结合其他指标过滤。可考虑加入如MA,KDJ等其它指标来验证信号,过滤假信号。
-
参数优化测试。通过多次回测和参数优化来选择指标参数的最优组合,提高策略效果。
-
适当调整仓位管理。根据品种特性和交易风格适当调整每次交易的头寸数量。
该策略整合MACD和RSI两个广泛使用的指标,通过二者的优势互补获得反转交易信号。策略优点是简单实用、容易理解,可根据市场和交易风格进行灵活调整。下一步可通过止损、参数优化、指标过滤等方式进一步增强策略的稳定性和盈利能力。
||
This strategy combines the MACD and RSI indicators to identify trend reversal points for buy low and sell high operations. It generates buy signals when the MACD line crosses above the signal line while RSI is oversold, and sell signals when the MACD line crosses below the signal line while RSI is overbought.
The MACD indicator consists of the MACD line, signal line and histogram. The MACD line is faster while The signal line is slower. When MACD line crosses above signal line, a buy signal is generated indicating an upward trend. When MACD line crosses below signal line, a sell signal is generated indicating a downward trend.
The RSI oscillator reflects overbought/oversold levels in the market. RSI above 70 suggests overbought conditions while RSI below 30 suggests oversold conditions.
Buy Condition: MACD line crosses above Signal line (Golden Cross) AND RSI is below 40 (oversold level).
Sell Condition: MACD line crosses below Signal line (Death Cross) AND RSI is above 60 (overbought level).
The strategy identifies trend directions using the MACD indicator and determines potential reversal points using the overbought/oversold levels from the RSI indicator.
-
Improves strategy stability and win rate by combining indicators. MACD identifies trend direction and RSI identifies reversal timing, enhancing signal reliability.
-
Effectively captures key reversal points utilizing both indicators. RSI overbought/oversold levels combined with MACD crossovers precisely spot trend shifts.
-
Simple clear trading signals and rules. Signals come from two well-known indicators with clearly defined rules for straightforward execution.
-
Flexibility for optimizations. Parameters of both indicators and additional technical indicators can be incorporated for enriching rules.
-
Risk of consecutive losing trades on false signals and fakeouts. Unnecessary losses may be incurred during choppy price actions.
-
Lack of risk management mechanisms. No stop loss in place may lead to amplified losses in long run.
-
Failure risk of MACD and RSI. These two indicators tend to give excessive false signals during sideways or special market conditions.
-
Blind optimizations risk. Inappropriate optimizations without sufficient market knowledge could lead to overfitting.
Risks can be reduced by implementing stop loss, assessing market conditions, cautious parameter tuning, and combining indicators. This improves strategy stability.
-
Add stop loss mechanisms to limit downside risk. Consider trailing stop or percentage-based stop loss.
-
Evaluate multiple timeframes for optimal indicator parameters and signals.
-
Additional filter indicators (MA, KDJ etc) to filter false signals and confirm signals.
-
Parameter optimization through extensive backtests to find optimal indicator parameters.
-
Adjust position sizing according to symbol and account specifications.
This strategy combines two widely used indicators MACD and RSI for complementarity in signal generations. The advantages lie in its simplicity and flexibility for customizations. Further improvements can be made by adding stop loss, optimizing parameters, and filtering signals to enhance strategy stability and profitability.
[/trans]
Strategy Arguments
| Argument | Default | Description |
|---|---|---|
| v_input_int_1 | 5 | MACD Fast Length |
| v_input_int_2 | 35 | MACD Slow Length |
| v_input_int_3 | 5 | MACD Signal Smoothing |
| v_input_int_4 | 14 | RSI Length |
Source (PineScript)
/*backtest
start: 2024-01-01 00:00:00
end: 2024-01-31 23:59:59
period: 1h
basePeriod: 15m
exchanges: [{"eid":"Futures_Binance","currency":"BTC_USDT"}]
*/

//@version=5
strategy("MACD and RSI Strategy", shorttitle="MRS long", overlay=true)

// Define input parameters
fast_length = input.int(5, title="MACD Fast Length")
slow_length = input.int(35, title="MACD Slow Length")
signal_smoothing = input.int(5, title="MACD Signal Smoothing")
rsi_length = input.int(14, title="RSI Length")

// Calculate MACD with custom signal smoothing
[macdLine, signalLine, _] = ta.macd(close, fast_length, slow_length, signal_smoothing)

// Calculate RSI
rsi = ta.rsi(close, rsi_length)

// Define buy and close conditions
buy_condition = ta.crossover(macdLine, signalLine) and rsi < 40
sell_condition = ta.crossunder(macdLine, signalLine) and rsi > 60

// Define Sell and close conditions
b_condition = ta.crossunder(macdLine, signalLine) and rsi < 40
s_condition = ta.crossover(macdLine, signalLine) and rsi > 75

// Plot buy and sell signals on the chart
plotshape(buy_condition ? 1 : na, style=shape.triangleup, location=location.belowbar, color=color.green, size=size.small, title="Buy Signal")
plotshape(sell_condition ? 1 : na, style=shape.triangledown, location=location.abovebar, color=color.red, size=size.small, title="Sell Signal")

// Strategy entry and exit conditions
if (buy_condition)
    strategy.entry("Buy", strategy.long)
if (sell_condition)
    strategy.close("Buy")

// if (s_condition)
//     strategy.entry("Sell", strategy.short)
// if (b_condition)
//     strategy.close("Sell")
Detail
https://www.fmz.com/strategy/442013
Last Modified
2024-02-18 16:07:53
