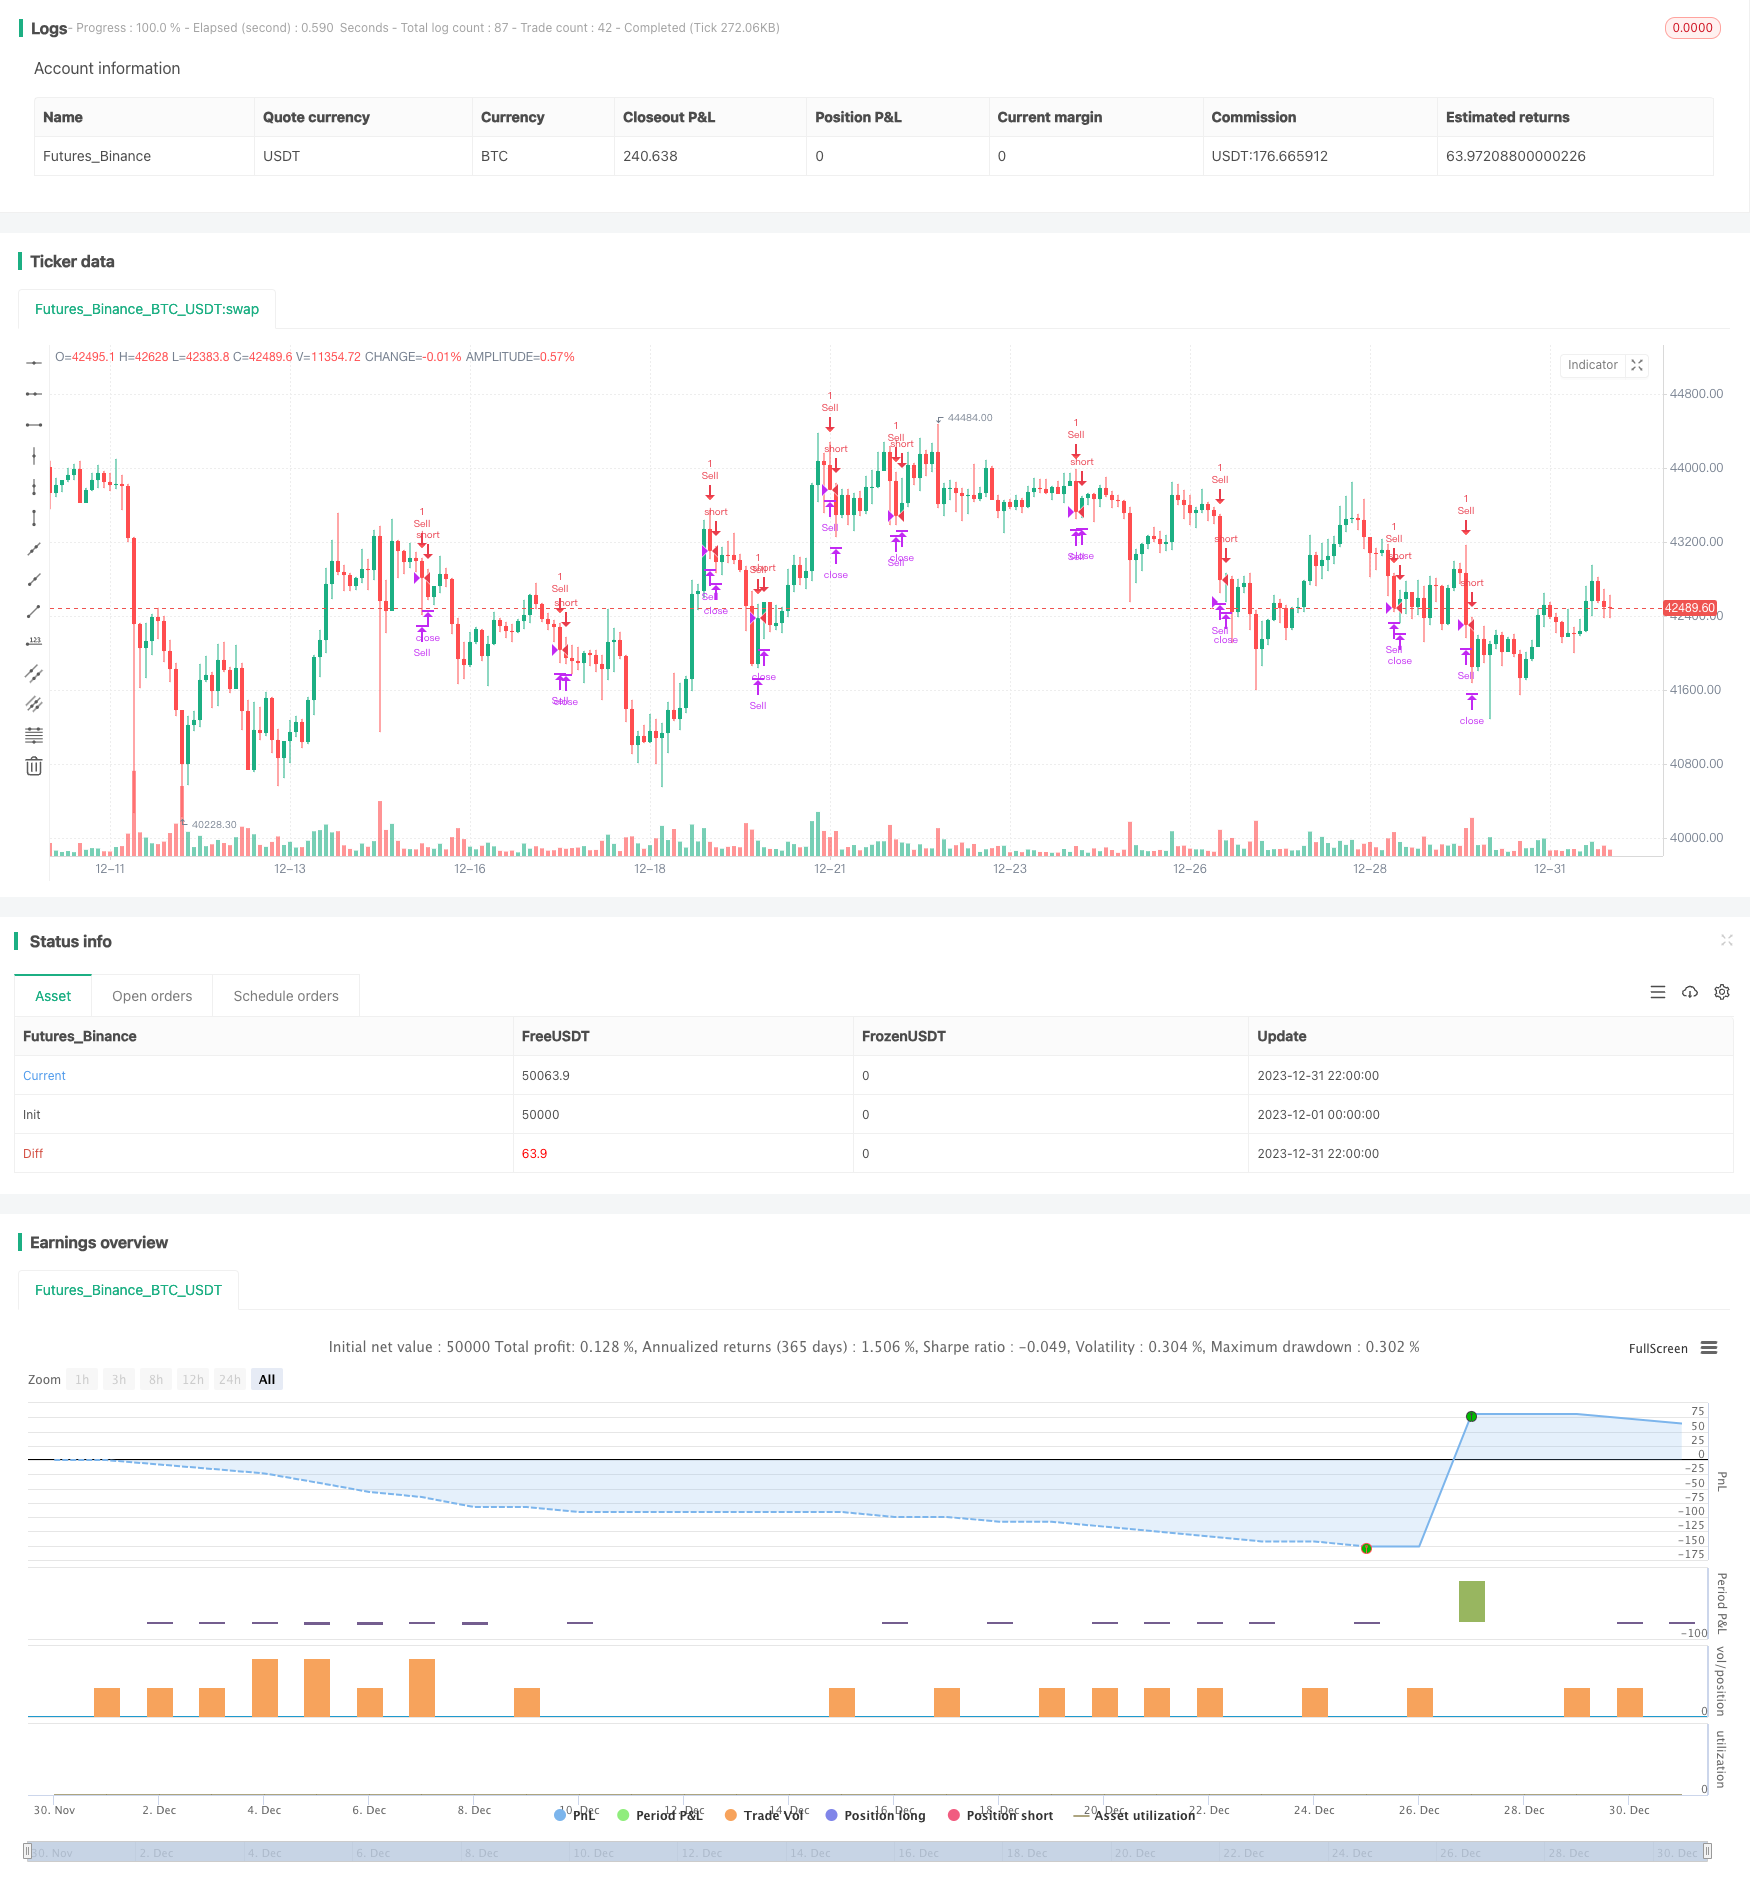
Name
基于MACD和RSI的5分钟动量交易策略MACD-and-RSI-Based-5-Minute-Momentum-Trading-Strategy
Author
ChaoZhang
Strategy Description
本策略是一个结合MACD和RSI指标的XRP/USDT 5分钟短期动量交易策略。该策略通过识别MACD指标金叉做多信号和死叉做空信号,以捕捉XRP/USDT交易对短期价格动量。同时,RSI指标的超买超卖信号用于确认交易信号。本策略适合短期追踪市场动量的积极交易者。
-
使用RSI指标判断超买超卖区域。RSI低于30为超卖区,高于70为超买区。
-
使用MACD指标判断买卖信号。MACD线上穿信号线为金叉做多信号。MACD线下穿信号线为死叉做空信号。
-
当RSI指标显示超卖信号,且MACD出现金叉时,做多XRP/USDT。
-
当RSI指标显示超买信号,或MACD出现死叉时,做空XRP/USDT。
-
设置止损和止盈价格。
-
结合RSI和MACD两个指标过滤信号,避免假突破。
-
追踪短期价格趋势,捕捉动量较大的行情。
-
适合短线操作的积极交易者。
-
策略参数可自定义,适应性强。
-
短期行情震荡较大,存在止损风险。
-
MACD指标容易发出错误信号,需要结合其它指标确认。
-
超短线操作,对交易者情绪控制要求较高。
-
交易成本和手续费对盈利有一定影响。
-
优化RSI参数,寻找最佳参数组合。
-
测试不同持仓时间下的盈亏情况。
-
加入其它指标结合MACD指标确认信号。
-
设置移动止损来锁定利润,减少风险。
本策略是一个短期追踪XRP/USDT交易对动量的5分钟MACD和RSI指标组合交易策略。策略优势是捕捉行情热点,通过指标组合过滤误信号。但短线操作的风险和成本也较高,需要交易者控制好资金管理和止损策略。通过参数优化和加入其它指标可以进一步完善该策略。
||
This strategy combines the MACD and RSI indicators for short-term momentum trading on the XRP/USDT 5-minute chart. It identifies buying and selling signals by detecting MACD crossovers to capture price swings on XRP/USDT. Meanwhile, RSI overbought and oversold signals are used to confirm the trading signals. The strategy suits aggressive traders who aim to capitalize on short-term market momentum.
-
Use RSI indicator to identify overbought and oversold levels. Below 30 is oversold while above 70 is overbought.
-
Use MACD indicator to generate buy and sell signals. MACD line crossing above signal line gives buy signal while crossing below gives sell signal.
-
Go long XRP/USDT when RSI shows oversold plus MACD bullish crossover.
-
Go short XRP/USDT on RSI overbought or MACD bearish crossover signals.
-
Set stop loss and take profit price levels.
-
Combining RSI and MACD filters false signals.
-
Captures high momentum price swings.
-
Suits aggressive short-term traders.
-
Customizable parameters for adaptability.
-
High volatility risks stop loss being hit.
-
MACD prone to false signals without confirmation.
-
Challenging emotional control on ultra short-term trades.
-
Trading costs and fees erode profits.
-
Optimize RSI parameters for best settings.
-
Test profitability across different holding periods.
-
Add other indicators to confirm MACD signals.
-
Implement trailing stop loss to lock in profits and reduce risk.
This is a 5-minute MACD and RSI strategy for trading short-term XRP/USDT momentum. It capitalizes on catching trend reversals but risks and costs are higher for such short-term trading. Controlling position sizing and stops while optimizing parameters can enhance performance. Overall it suits aggressive traders aiming to profit from market swings.
[/trans]
Strategy Arguments
| Argument | Default | Description |
|---|---|---|
| v_input_1 | 14 | RSI Length |
| v_input_2 | 70 | RSI Overbought Threshold |
| v_input_3 | 30 | RSI Oversold Threshold |
| v_input_4 | 12 | MACD Short Length |
| v_input_5 | 26 | MACD Long Length |
| v_input_6 | 9 | MACD Signal Length |
| v_input_7 | true | Stop Loss Percentage |
| v_input_8 | 2 | Take Profit Percentage |
Source (PineScript)
/*backtest
start: 2023-12-01 00:00:00
end: 2023-12-31 23:59:59
period: 2h
basePeriod: 15m
exchanges: [{"eid":"Futures_Binance","currency":"BTC_USDT"}]
*/

//@version=5
strategy("XRP/USDT 5-Minute Momentum Strategy", shorttitle="XRP Momentum", overlay=true)

// Input parameters
rsi_length = input(14, title="RSI Length")
rsi_overbought = input(70, title="RSI Overbought Threshold")
rsi_oversold = input(30, title="RSI Oversold Threshold")
macd_short_length = input(12, title="MACD Short Length")
macd_long_length = input(26, title="MACD Long Length")
macd_signal_length = input(9, title="MACD Signal Length")
stop_loss_pct = input(1, title="Stop Loss Percentage")
take_profit_pct = input(2, title="Take Profit Percentage")

// Calculate RSI
rsi = ta.rsi(close, rsi_length)
// Calculate MACD
[macd_line, signal_line, _] = ta.macd(close, macd_short_length, macd_long_length, macd_signal_length)

// Define buy and sell conditions
buy_condition = ta.crossover(rsi, rsi_oversold) and ta.crossover(macd_line, signal_line)
sell_condition = ta.crossunder(rsi, rsi_overbought) or ta.crossunder(macd_line, signal_line)

// Calculate stop loss and take profit levels
stop_loss = close * (1 - stop_loss_pct / 100)
take_profit = close * (1 + take_profit_pct / 100)

// Plot shapes on the chart to visualize buy/sell signals
plotshape(buy_condition, style=shape.triangleup, location=location.belowbar, color=color.green, size=size.small)
plotshape(sell_condition, style=shape.triangledown, location=location.abovebar, color=color.red, size=size.small)

// Use the `strategy.close` function to manage positions
strategy.entry("Buy", strategy.long, when=buy_condition)
strategy.entry("Sell", strategy.short, when=sell_condition)

strategy.close("Buy", when=close > take_profit or close < stop_loss)
strategy.close("Sell", when=close < take_profit or close > stop_loss)
Detail
https://www.fmz.com/strategy/440441
Last Modified
2024-01-30 15:59:06
