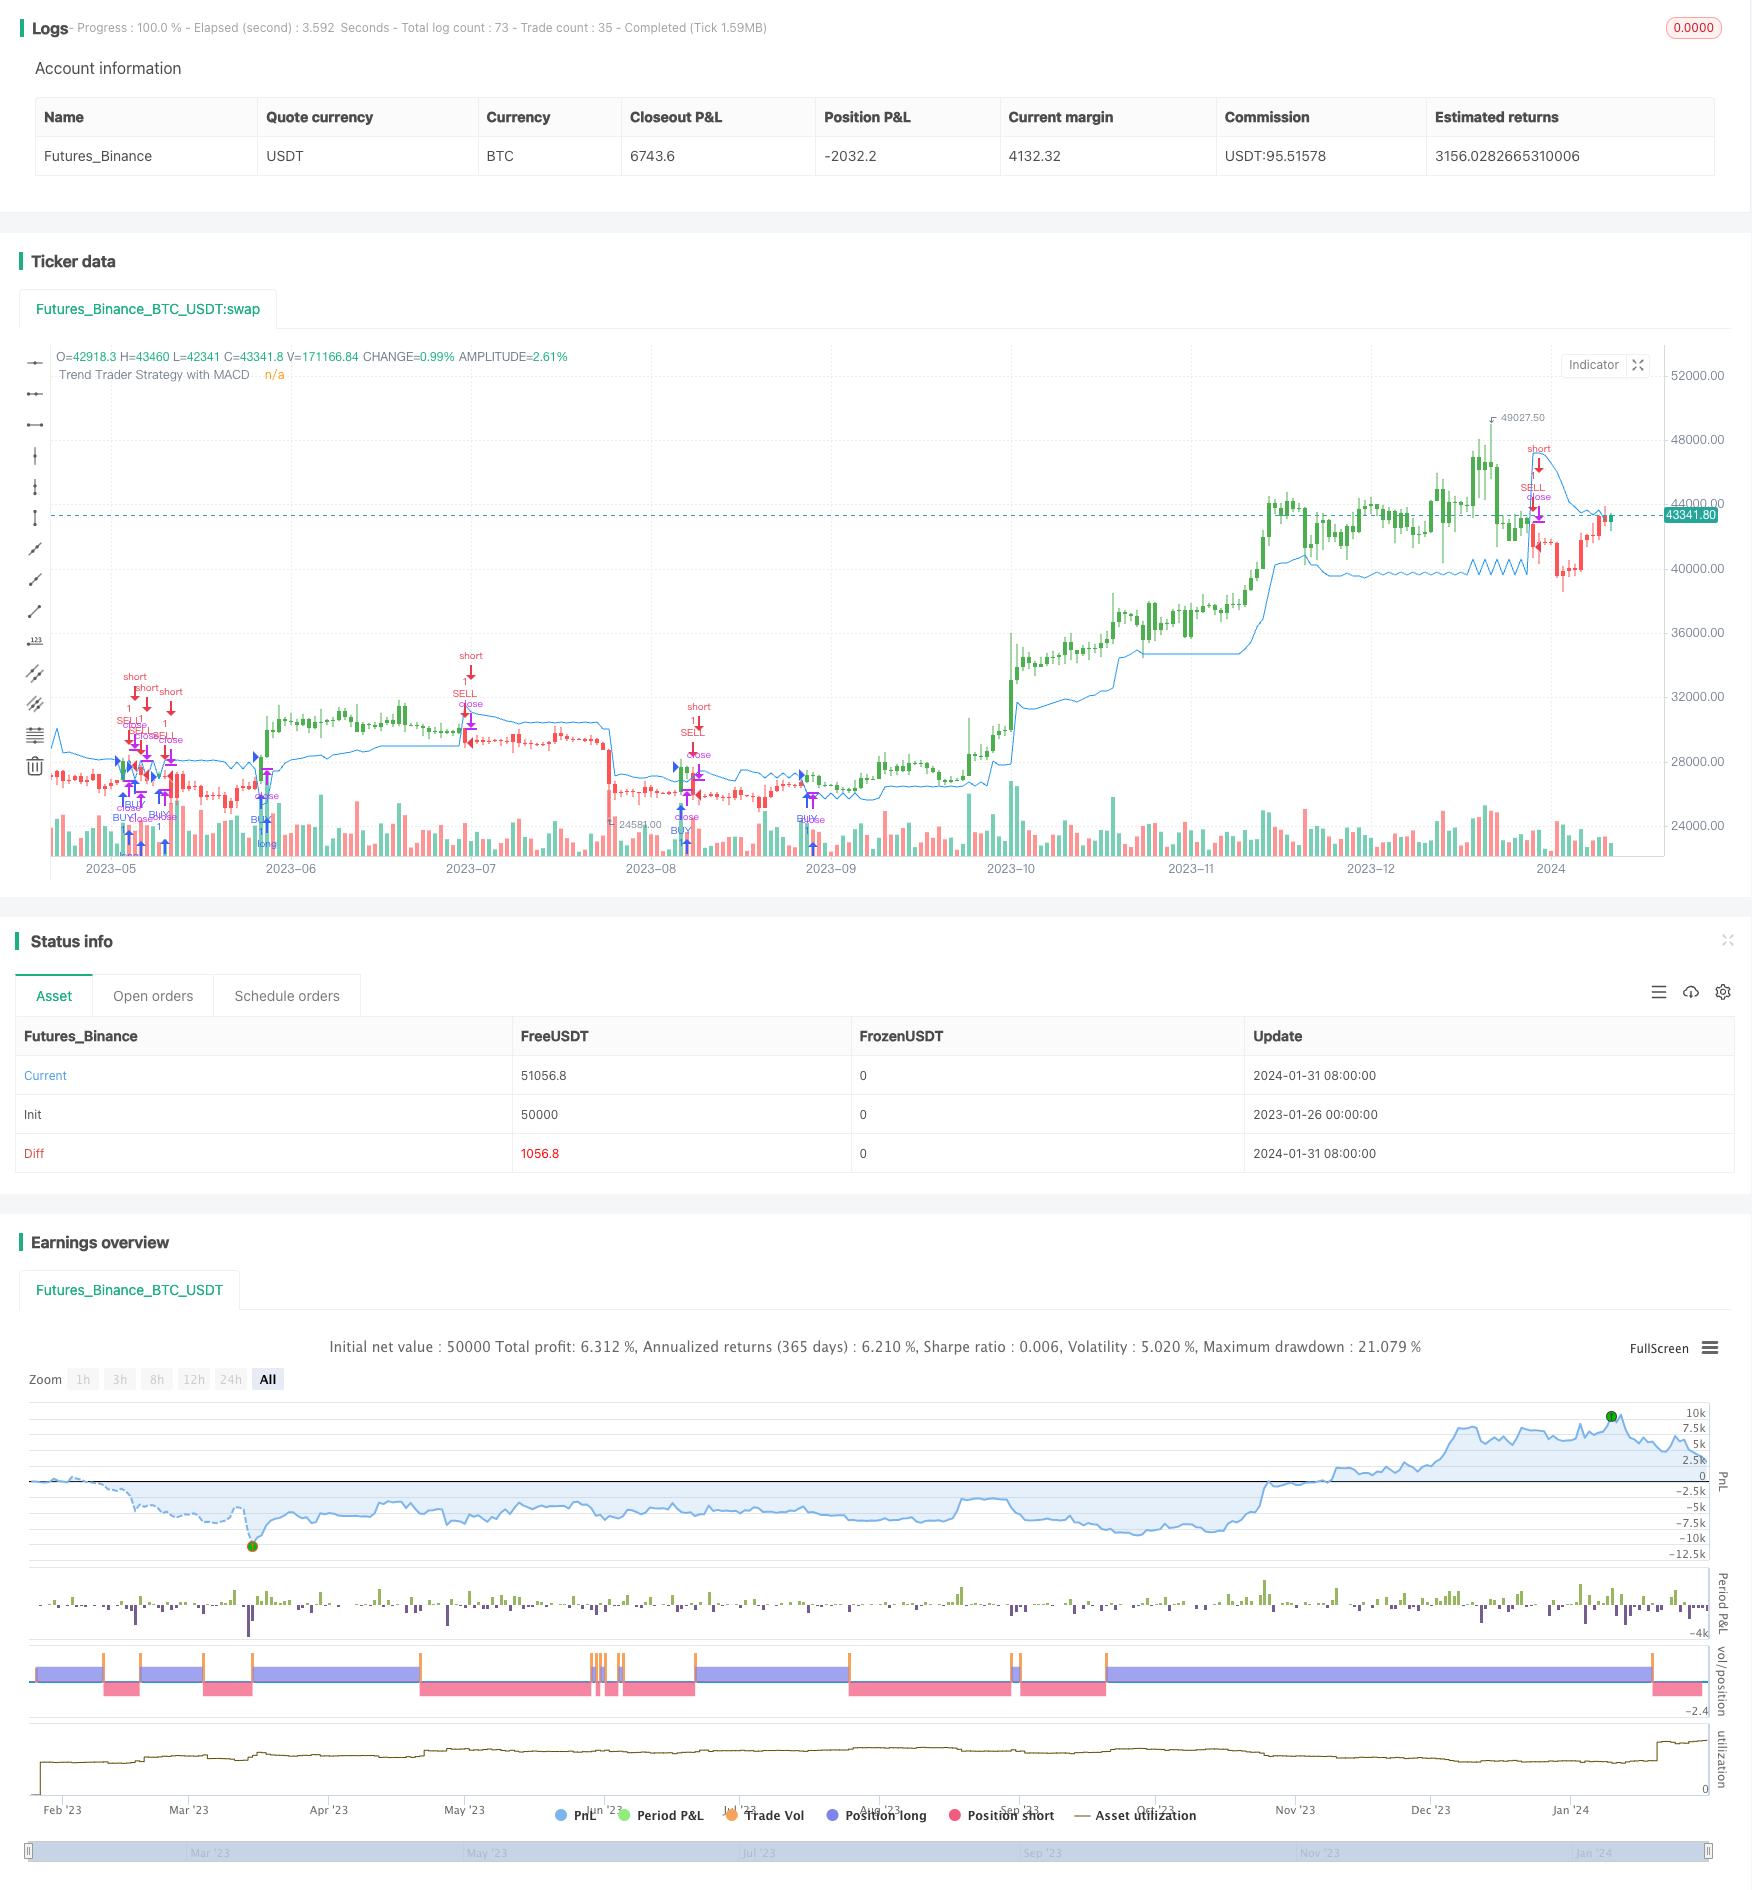
Name
基于MACD指标的趋势交易策略-Trend-Trading-Strategy-Based-on-MACD-Indicator
Author
ChaoZhang
Strategy Description
该策略的核心是基于安德鲁·亚伯拉罕在1998年9月《交易趋势》杂志TASC专栏中发表的文章中开发的指标。该指标利用平均真实波动范围和价格通道判断市场趋势方向,结合MACD指标进行交易信号过滤,旨在捕捉中长线趋势。
该策略首先计算21日平均真实波动范围(ATR)的加权移动平均作为基准波动范围。然后计算过去21日的最高价和最低价,以当前K线收盘价与基准波动范围上下限进行比较,判断价格是否突破通道,从而判断趋势方向。
具体来说,定义通道上限为过去21日最高价减去3倍基准ATR,通道下限为过去21日最低价加上3倍基准ATR。当收盘价高于通道上限时,判断为看涨趋势;当收盘价低于通道下限时,判断为看跌趋势。
在判定趋势方向的同时,该策略还引入MACD指标进行过滤。只有当MACD柱状线为正时才产生买入信号,避免错过买点。
该策略结合趋势判断和指标过滤,能有效判断市场中长线趋势方向,避免被市场短期波动误导。具体优势如下:
- 使用价格通道判断趋势,准确判定长线趋势方向
- 基准波动范围能动态调整,适应市场变化
- MACD指标过滤增加决策依据,避免错失买点
- 可配置参数,灵活调整策略风格
该策略也存在一定风险,主要体现在以下几个方面:
- 价格通道范围无法完全避免被突破的风险
- MACD指标可能产生误导 signal的风险
- Parameters设置不当可能导致strategy不稳定
对此,可通过优化参数设置、严格 position sizing、及时止损来降低风险。
该策略主要可从以下几个方面进行优化:
1.测试不同参数组合,寻找最佳parameter
可以测试不同的Length parameter或Multiplier parameter的组合,找到基于回测数据产生最佳收益率的parameter组合。
2.结合其他指标过滤signal
可测试结合RSI, KDJ等其他指标来过滤signal,看是否可以提高收益率。
3.动态调整参数
可以根据市场情况来动态调整parameter,比如在趋势明显时适当放宽通道范围,在震荡时适当收紧通道范围。
该策略整体来说是一种相对稳健的趋势追踪策略。它结合价格通道判定趋势方向和MACD指标过滤信号的方法,可以有效判断市场中长线趋势,产生稳定收益。通过参数优化、风险管理和适当修正,该策略可以成为量化交易体系中的重要组成部分。
||
The core of this strategy is based on the indicator developed in the article "Trading the Trend" published by Andrew Abraham in TASC magazine September 1998 issue. The indicator utilizes average true range and price channel to determine market trend direction, combined with MACD indicator for trade signal filtering, aiming to capture medium-long term trends.
The strategy first calculates 21-day weighted moving average of average true range (ATR) as a baseline volatility range. Then it calculates highest and lowest prices over the past 21 days. By comparing current close price with upper and lower limits of the baseline range, it judges whether price breaks out of the channel to determine trend direction.
Specifically, the upper channel limit is defined as the highest price over past 21 days minus 3 times baseline ATR, and the lower channel limit is the lowest price over past 21 days plus 3 times baseline ATR. When close price is higher than the upper limit, it signals a bullish trend. When close price is lower than the lower limit, it signals a bearish trend.
While determining trend direction, this strategy also introduces MACD indicator for filtering. It only generates buy signals when MACD histogram is positive to avoid missing buy opportunities.
This strategy combines trend determination and indicator filtering, which can effectively identify mid-long term market trend direction without being misguided by short-term fluctuations. The main advantages are:
- Using price channel to determine trends and accurately identify long term direction
- The dynamic baseline volatility range adapts to market changes
- MACD filtering provides additional decision support to avoid missing buy points
- Configurable parameters offer flexibility in adjusting strategy style
The strategy also has some risks, mainly in the following aspects:
- Risk of price channel being broken
- Risk of MACD signaling errors
- Inadequate parameter setup may cause strategy instability
These risks can be reduced by optimizing parameters, strict position sizing, and timely stop loss.
The strategy can be optimized in the following main aspects:
- Test different parameter combinations to find optimum
Test different combinations of Length or Multiplier to find the parameter combination that yields the highest return based on backtest.
- Add filtering with other indicators
Test incorporating RSI, KDJ and other indicators to filter signals and improve profitability.
- Dynamically adjust parameters
Adapt parameters dynamically based on market conditions, such as appropriately widening channel range when trend is strong, or tightening range when market is more range-bound.
In summary, this is an overall robust trend following strategy. By combining price channel trend determination and MACD filtering, it can effectively identify mid-long term trends and generate steady returns. With parameter optimization, risk management, and appropriate adjustments, this strategy can become an integral part of a trading system.
[/trans]
Strategy Arguments
| Argument | Default | Description |
|---|---|---|
| v_input_1 | 21 | Length |
| v_input_2 | 3 | Multiplier |
| v_input_3 | true | Control 'MACD Histogram is positive?' when Buy condition |
| v_input_4 | true | From Month |
| v_input_5 | true | From Day |
| v_input_6 | 2020 | From Year |
| v_input_7 | true | To Month |
| v_input_8 | true | To Day |
| v_input_9 | 9999 | To Year |
Source (PineScript)
/*backtest
start: 2023-01-26 00:00:00
end: 2024-02-01 00:00:00
period: 1d
basePeriod: 1h
exchanges: [{"eid":"Futures_Binance","currency":"BTC_USDT"}]
*/

// This source code is subject to the terms of the Mozilla Public License 2.0 at https://mozilla.org/MPL/2.0/
// © melihtuna

//@version=1
strategy("Trend Trader Strategy with MACD", overlay=true)

// === Trend Trader Strategy ===
Length = input(21),
Multiplier = input(3, minval=1)
MacdControl = input(true, title="Control 'MACD Histogram is positive?' when Buy condition")
avgTR      = wma(atr(1), Length)
highestC   = highest(Length)
lowestC    = lowest(Length)
hiLimit = highestC[1]-(avgTR[1] * Multiplier)
loLimit = lowestC[1]+(avgTR[1] * Multiplier)
ret = iff(close > hiLimit and close > loLimit, hiLimit,
        iff(close < loLimit and close < hiLimit, loLimit, nz(ret[1], 0)))
pos =	iff(close > ret, 1,
	    iff(close < ret, -1, nz(pos[1], 0)))
barcolor(pos == -1 ? red: pos == 1 ? green : blue )
plot(ret, color= blue , title="Trend Trader Strategy with MACD")

// === INPUT BACKTEST RANGE ===
FromMonth = input(defval = 1, title = "From Month", minval = 1, maxval = 12)
FromDay   = input(defval = 1, title = "From Day", minval = 1, maxval = 31)
FromYear  = input(defval = 2020, title = "From Year", minval = 2017)
ToMonth   = input(defval = 1, title = "To Month", minval = 1, maxval = 12)
ToDay     = input(defval = 1, title = "To Day", minval = 1, maxval = 31)
ToYear    = input(defval = 9999, title = "To Year", minval = 2017)

// === FUNCTION EXAMPLE ===
start     = timestamp(FromYear, FromMonth, FromDay, 00, 00)  // backtest start window
finish    = timestamp(ToYear, ToMonth, ToDay, 23, 59)        // backtest finish window
window()  => true

// === MACD ===
[macdLine, signalLine, histLine] = macd(close, 12, 26, 9)
macdCond= MacdControl ? histLine[0] > 0 ? true : false : true

strategy.entry("BUY", strategy.long, when = window() and pos == 1 and macdCond)
strategy.entry("SELL", strategy.short, when = window() and pos == -1)
Detail
https://www.fmz.com/strategy/440808
Last Modified
2024-02-02 11:32:48
