Name
基于OBVCMO和Coppock曲线的交易策略OBV-CMO-and-Coppock-Curve-Based-Trading-Strategy
Author
ChaoZhang
Strategy Description
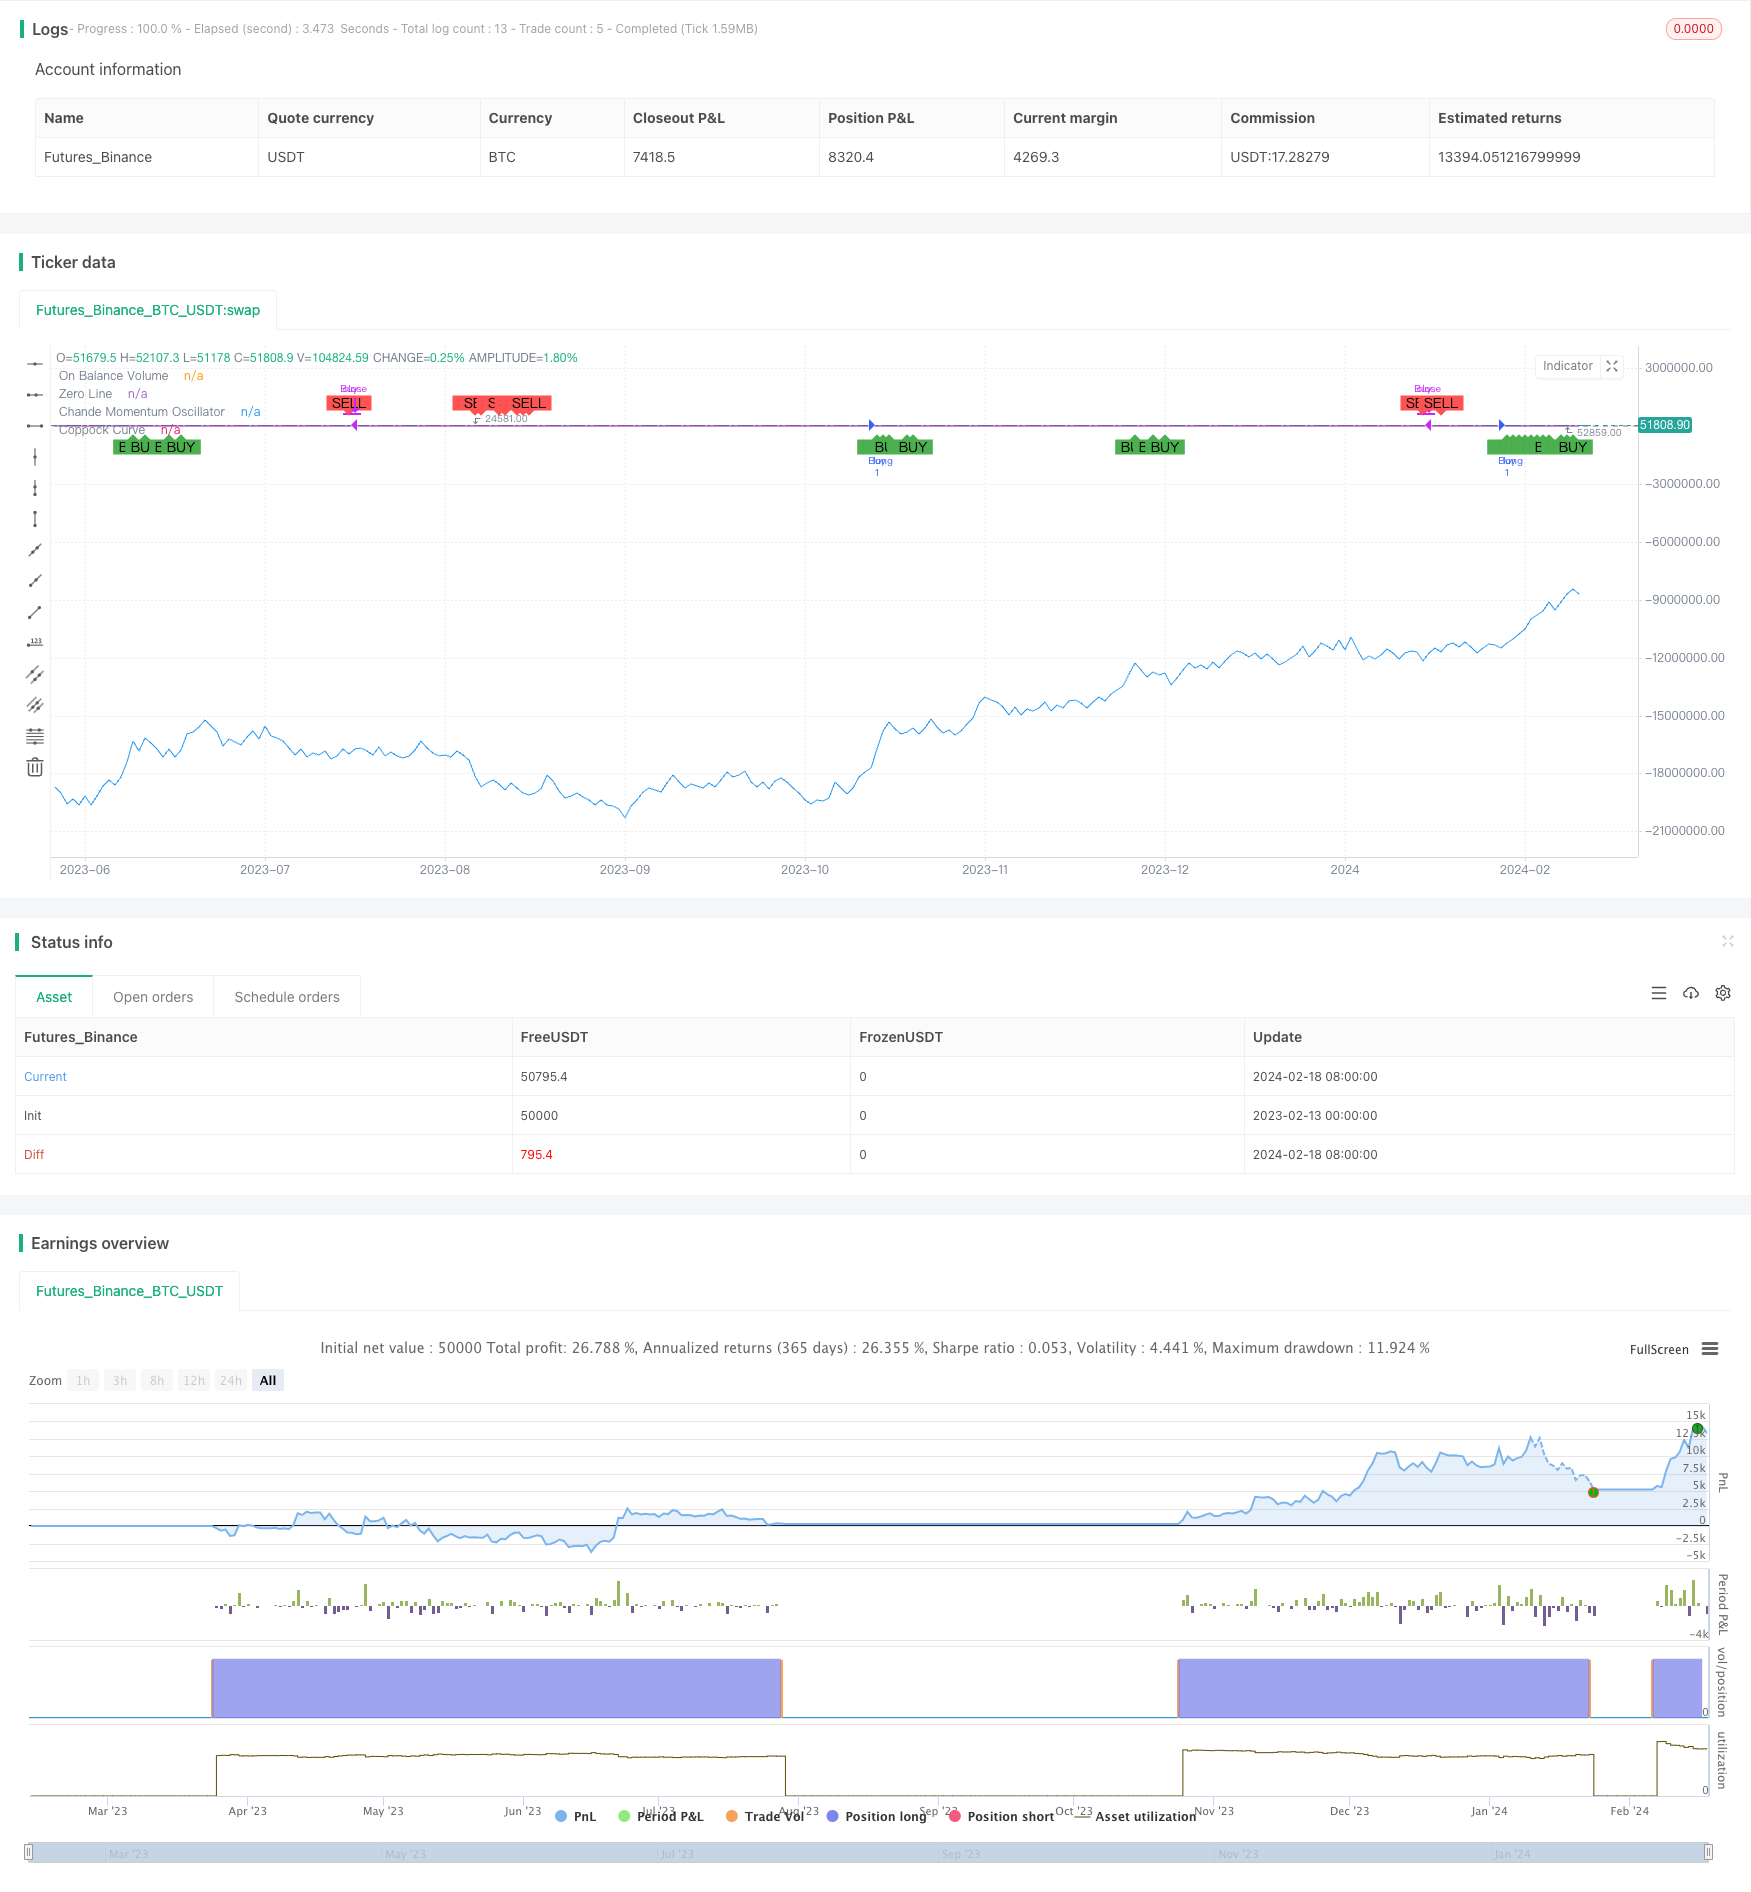
RB量化交易三合一策略是一个结合大盘热度指标OBV、中短期运动量指标CMO和长线运动量指标Coppock曲线的复合策略。该策略综合考虑了市场多空热度、中短期趋势和长线趋势三个维度,形成交易信号,以达到更可靠的入场。
该策略的交易信号来源于以下三个指标的组合:
-
OBV:反映大盘热度,多空势力的强弱。OBV上涨代表多方势力加强,OBV下跌代表空方势力加强。
-
CMO:反映中短期价格变化率的趋势性。CMO为正代表中短期处于上涨趋势,CMO为负代表下跌趋势。
-
Coppock曲线:反映长期价格变化率的趋势性。Coppock曲线向上代表长线处于上涨阶段,向下代表下跌阶段。
当OBV上升、CMO和Coppock曲线同时上涨时产生买入信号。这代表大盘多方势力加强,中长期处于上涨通道,是一个较好的买点。
反之,当OBV下降,CMO和Coppock曲线同时下跌时产生卖出信号。这代表空方势力加强,中长期下行通道打开,是比较好的离场时机。
该策略最大的优势在于综合考量了市场的多空热度、中短期趋势和长期趋势三个维度,从大盘层面、中短期层面和长期层面确保趋势异动一致后才产生交易信号,因此可以有效避免假突破。同时利用CMO的灵敏度把握短期机会的同时,Coppock曲线提供长线滤波保证大方向正确。
另外,该策略同时利用构建买卖双向信号,可以实现较好的资金利用率。
该策略的主要风险在于Coppock曲线和CMO所采用的ROC计算周期较长,会有一定的滞后性。当市场突发事件激烈变动时,Coppock曲线和CMO指标可能会延迟做出判断。这时就需要依赖OBV的快速判定。但OBV作为积累量能线,对突发事件也会有几根K线的滞后。
此外,将三个指标简单合并在一起判断,没有考虑指标之间的权重设定,这也会影响判断的准确性。
该策略后续可以从以下几个方面进行优化:
-
对Coppock曲线和CMO指标采用自适应ROC周期设置,让指标的参数可以自动适应市场的变化频率。
-
增加指标的权重设定,让一些判断更为精确的指标起主导作用,提高信号的稳定性。
-
增加止损策略,利用类似ATR指标设定交易的止损范围,有效控制单笔交易的最大损失。
-
发挥OBV的快速响应优势,设定OBV反转作为止损信号,避免大幅亏损。
RB量化交易三合一策略综合考虑大盘热度、中短期运动量和长期运动量三个维度,形成买卖信号。它融合了多个指标的优势,确保市场多空态势和中长期趋势趋于一致后产生交易信号。主要优势是信号稳定可靠,有效避免假突破。通过后续的优化设计,进一步提升策略的实战效果。
||
The RB quant trading combo strategy is a composite strategy that combines volume-based indicator OBV, momentum oscillator CMO and long-term momentum indicator Coppock curve. This strategy takes into account market sentiment, mid-term trend and long-term trend from three dimensions and generates trading signals for more reliable market entry.
The trading signals of this strategy come from a combination of the following three indicators:
-
OBV: Reflects market sentiment and strength of bulls vs bears. Rising OBV represents strengthening of bulls while falling OBV represents bears taking over.
-
CMO: Captures mid-term trend of price rate of change. Positive CMO indicates mid-term uptrend while negative CMO shows downtrend.
-
Coppock Curve: Tracks long-term trend of price rate of change. Upward Coppock curve shows long term bull phase while downward direction represents long term bear phase.
Buy signal is generated when OBV rises with CMO and Coppock curve turning up together. This indicates market sentiment backing up the bulls with mid to long term uptrend intact, making it a good buying opportunity.
Sell signal is triggered when OBV declines and both CMO and Coppock curve turning down in unison. This shows bears in control with mid-long term downtrend channel opening up, serving as good timing for position exit.
The biggest edge of this strategy lies in synthesizing market sentiment, mid-term and long-term trends from three perspectives. Trading signals are only formed after confirmation of trend change across market breadth, mid-term and long horizon, thus avoiding false breakout effectively. Meanwhile Coppock curve provides long term directional bias while CMO captures short-term opportunities with swiftness.
Another advantage comes from bi-directional buy and sell signals enabling efficient capital utilization.
Main risks of this strategy originates from the lagging nature of Coppock Curve and CMO due to their long ROC calculation periods. Sudden volatile market events could fail to trigger timely signals from these two long-term gauges. Fast determination has to count on OBV in such scenarios. However, OBV as an accumulated volume indicator also suffers from a few bars of delay facing sudden turning points.
In addition, simple combination of the three indicators without weighting could compromise the judging accuracy.
The strategy could be upgraded in the following aspects going forward:
-
Adopt adaptive ROC periods for Coppock Curve and CMO to automatically calibrate parameters responding to market regime changes.
-
Introduce weighting system emphasizing signals from more precise indicators, improving overall signal quality and stability.
-
Incorporate stop loss based on volatility measurements like ATR, effectively capping maximum loss per trade.
-
Utilize swift change in OBV to gauge stop loss signals, avoiding heavy losses.
The RB Quant Combo strategy synthesizes market breadth, mid-term and long-term momentum to generate buy / sell signals, amalgamating strengths of multiple indicators. Trading opportunities arise only after alignment of market sentiment and mid-long term trends. Its key advantage lies in signal reliability and false breakout avoidance. With further optimizations, strategy performance could be lifted to the next level in live trading.
[/trans]
Strategy Arguments
| Argument | Default | Description |
|---|---|---|
| v_input_1 | 14 | Chande Momentum Oscillator Period |
| v_input_2 | 14 | Coppock Curve Long ROC Period |
| v_input_3 | 11 | Coppock Curve Short ROC Period |
| v_input_4 | 10 | Coppock Curve WMA Period |
| v_input_5 | 50 | CMO Buy Threshold |
| v_input_6 | -50 | CMO Sell Threshold |
Source (PineScript)
/*backtest
start: 2023-02-13 00:00:00
end: 2024-02-19 00:00:00
period: 1d
basePeriod: 1h
exchanges: [{"eid":"Futures_Binance","currency":"BTC_USDT"}]
*/

//@version=4
strategy("RB - OBV Coppock CMO Strategy", overlay=true)

// Input for CMO period
cmo_period = input(14, title="Chande Momentum Oscillator Period")
// Input for Coppock Curve periods
coppock_long = input(14, title="Coppock Curve Long ROC Period")
coppock_short = input(11, title="Coppock Curve Short ROC Period")
coppock_wma = input(10, title="Coppock Curve WMA Period")
// Thresholds for CMO
cmo_buy_threshold = input(50, title="CMO Buy Threshold")
cmo_sell_threshold = input(-50, title="CMO Sell Threshold")

// Calculating OBV
obv = cum(close > close[1] ? volume : close < close[1] ? -volume : 0)

// Calculating Coppock Curve
roc_long = roc(close, coppock_long)
roc_short = roc(close, coppock_short)
coppock_curve = wma(roc_long + roc_short, coppock_wma)

// Calculating Chande Momentum Oscillator
cmo = cmo(close, cmo_period)

// Generate buy and sell signals
buy_signal = obv > obv[1] and coppock_curve > 0 and coppock_curve > coppock_curve[1] and cmo > cmo_buy_threshold
sell_signal = obv < obv[1] and coppock_curve < 0 and coppock_curve < coppock_curve[1] and cmo < cmo_sell_threshold

// Plotting signals on the chart
plotshape(series=buy_signal, title="Buy Signal", location=location.belowbar, color=color.green, style=shape.labelup, text="BUY")
plotshape(series=sell_signal, title="Sell Signal", location=location.abovebar, color=color.red, style=shape.labeldown, text="SELL")

// Setting up the strategy entry and exit points
if (buy_signal)
    strategy.entry("Buy", strategy.long)

if (sell_signal)
    strategy.close("Buy")

// Plot OBV and Coppock Curve for reference
plot(obv, title="On Balance Volume", color=color.blue)
hline(0, "Zero Line", color=color.gray)
plot(coppock_curve, title="Coppock Curve", color=color.purple)
plot(series=cmo, title="Chande Momentum Oscillator", color=color.orange)
Detail
https://www.fmz.com/strategy/442212
Last Modified
2024-02-20 11:26:46
