Name
基于ROC的RSI交易策略RSI-Based-on-ROC-Trading-Strategy
Author
ChaoZhang
Strategy Description
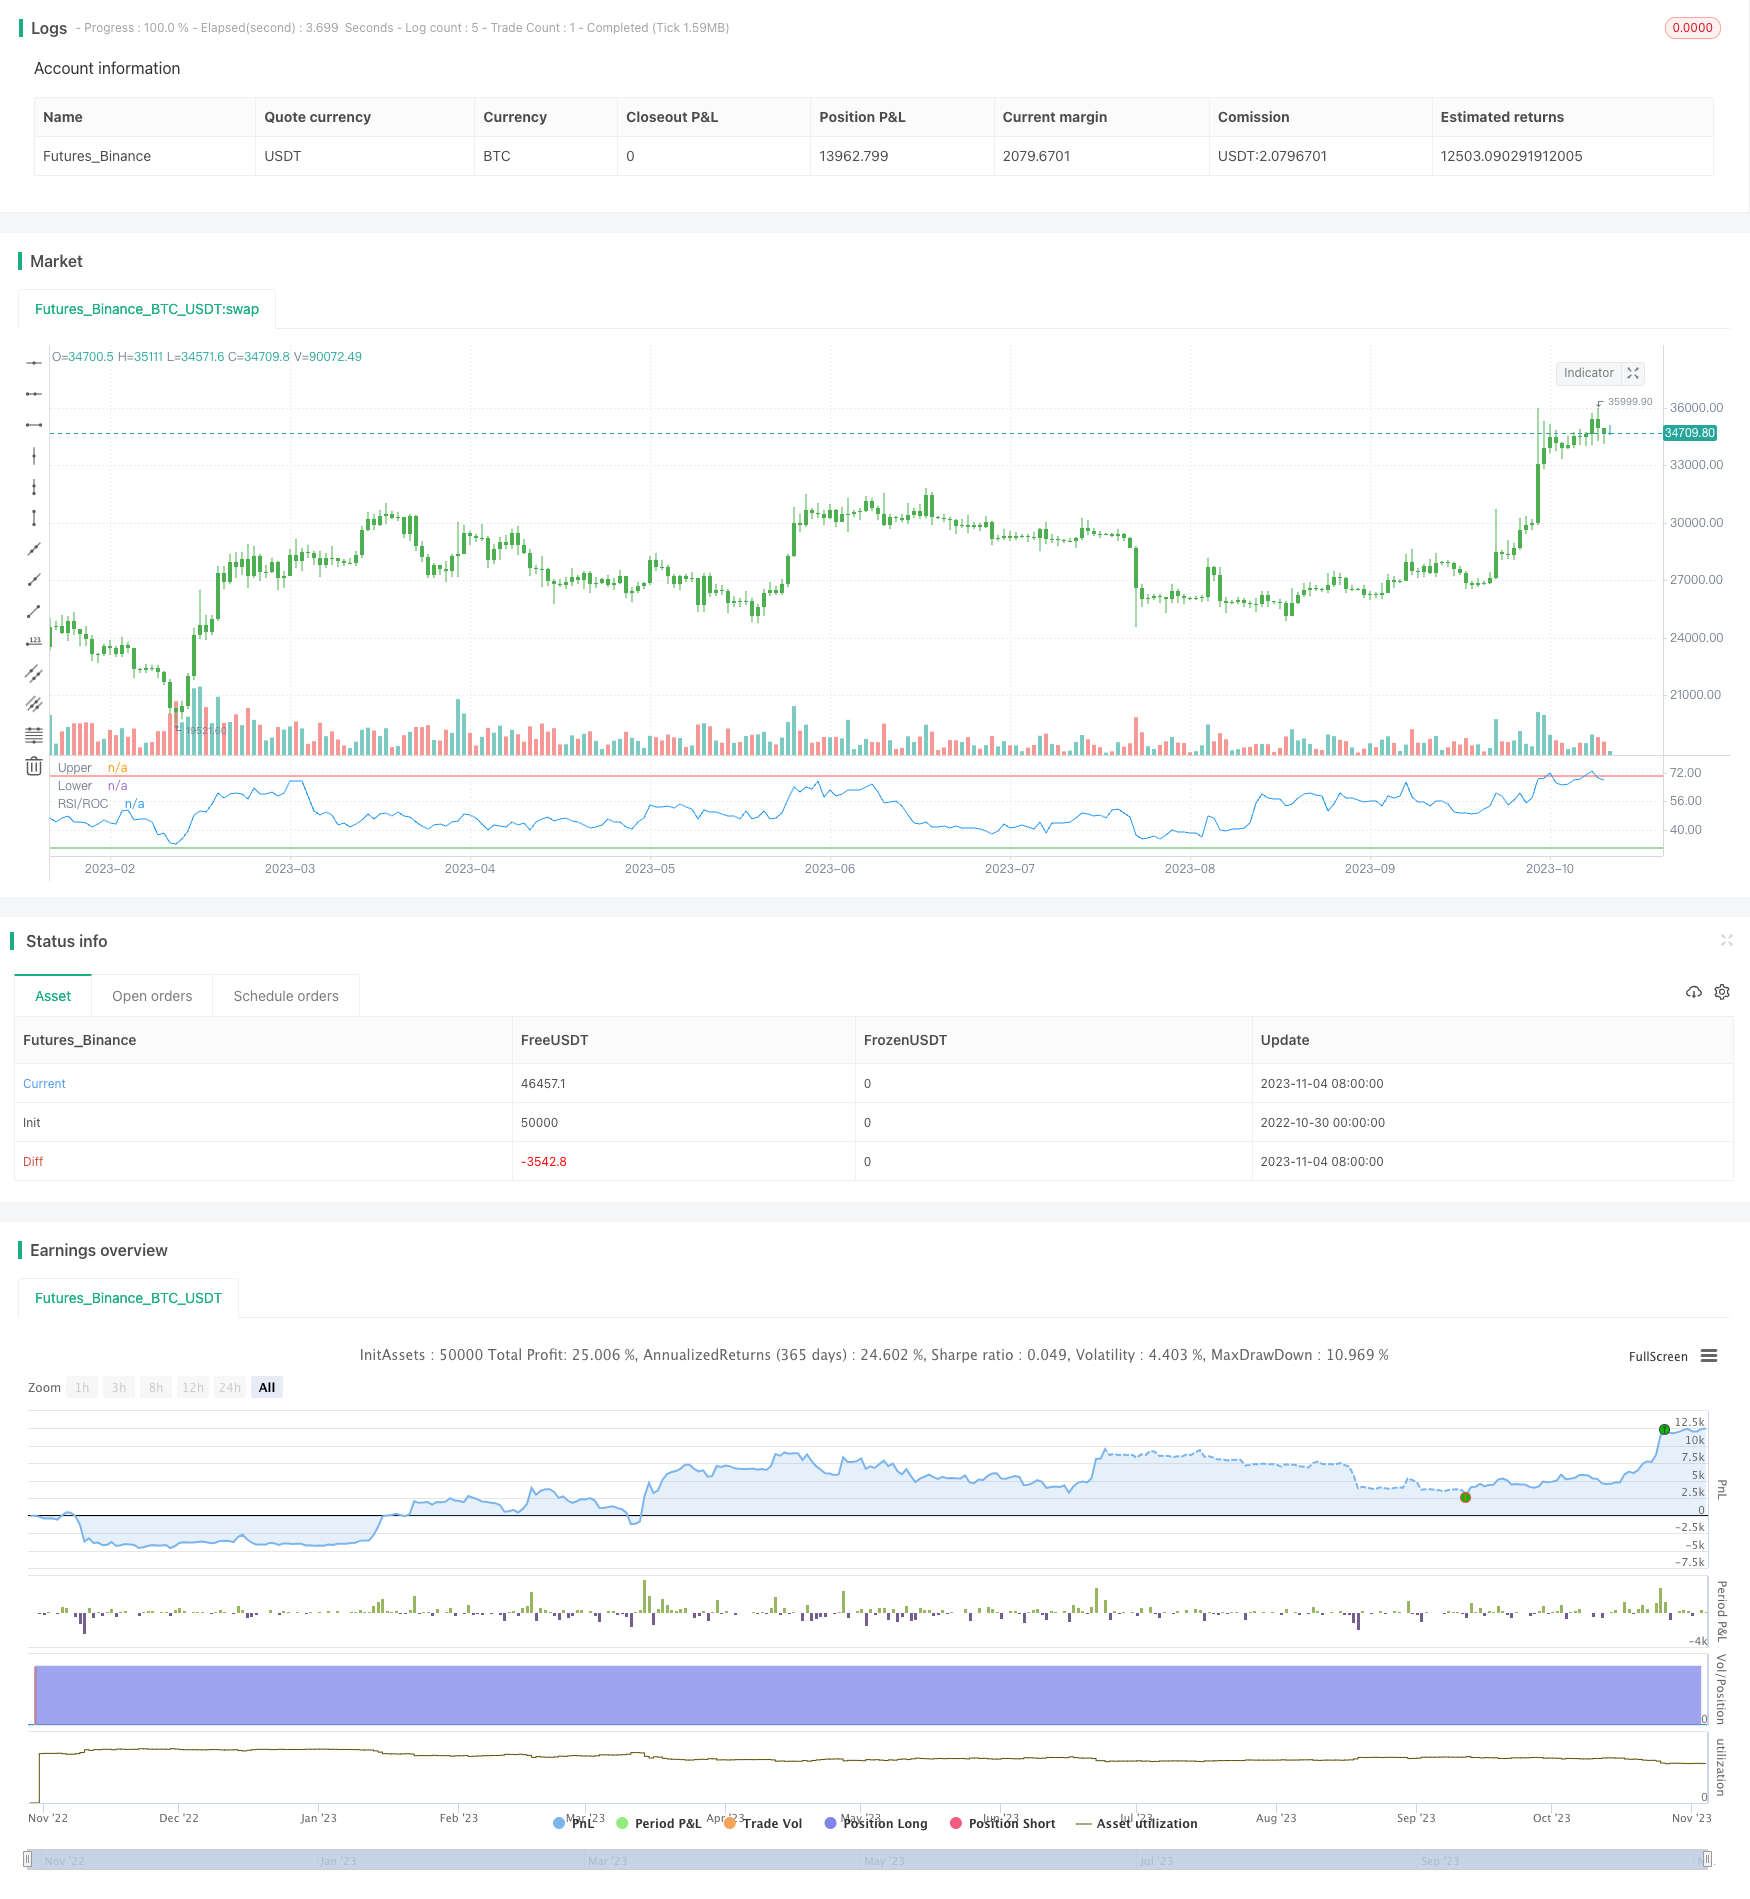
基于ROC的RSI交易策略是一种新型的交易策略,它将经典的RSI指标与ROC指标相结合,形成一个全新的交易指标——RSI/ROC。该策略利用ROC来计算RSI,从而过滤掉价格的部分噪音,使RSI指标更稳定可靠。
该策略的核心指标是RSI/ROC,它是在ROC指标的基础上计算RSI的值。ROC指标可以显示当前价格与X周期前价格的变化差值,以点数或百分比表示。而RSI指标反映的是一段时间内涨价天数与跌价天数的比值,用来判断超买超卖。
RSI/ROC指标将二者相结合,先通过ROC计算价格变化速度,然后基于ROC结果计算RSI,可以更好地反映价格的内在涨落态势。当RSI/ROC低于30时为超卖区,高于70时为超买区,可以进行反向操作。
该策略还设置了买入区和卖出区划分指标值高低的界限,开启反向交易时,会进行反向操作。对指标值设置不同颜色的可视化样式。
-
ROC指标可以过滤价格数据中的部分噪音,RSI/ROC指标更稳定可靠。
-
结合买入区和卖出区设置,可以更清晰判断超买超卖现象。
-
开启反向交易功能,可以用于两种不同的交易方式。
-
可视化指标样式,使指标易于判断和使用。
-
RSI/ROC指标参数可自定义设置,适用于不同市场环境。
-
如其他技术指标,该策略也可能出现误报的情况。
-
RSI/ROC指标因参考ROC,对突发重大消息反应可能有滞后。
-
买入区和卖出区的设定若不当,可能错过交易机会或增加不必要交易。
-
反向交易模式下,需警惕趋势反转的风险。
-
参数设置不当时,会产生多余平仓或重新入场现象。
-
可适当结合其他指标判断,规避部分风险。优化参数设置,使之符合不同交易品种。
-
结合移动平均线等指标,识别趋势方向,避免逆势交易。
-
优化RSI长度和ROC长度参数的设置,使其更符合具体交易品种的特点。
-
调整买入区和卖出区参数,使其能捕捉重要的超买超卖信号。
-
加入止损策略,控制单笔损失。
-
可以考虑只在趋势行情下使用该策略,而在盘整时暂停。
基于ROC的RSI交易策略,将ROC指标和RSI指标进行了创新结合,形成了新的RSI/ROC指标。该指标能有效过滤价格数据噪音,判断超买超卖情况。在参数优化和风险控制到位后,其可靠性和适用范围会更广。该策略既保留了RSI的优势,又增强了ROC的趋势判断能力,是一种可靠且可自定义的交易策略。
||
The RSI based on ROC trading strategy is a new type of trading strategy that combines the classic RSI indicator with the ROC indicator to form a new trading indicator - RSI/ROC. This strategy uses ROC to calculate RSI, which filters out some of the noise in prices and makes the RSI indicator more stable and reliable.
The core indicator of this strategy is RSI/ROC, which calculates the RSI value based on the ROC indicator. The ROC indicator can display the difference between the current price and the price x periods ago, in points or as a percentage. While the RSI indicator reflects the ratio of rising days to falling days over a period of time, used to judge overbought and oversold conditions.
The RSI/ROC indicator combines the two, first calculating the speed of price changes through ROC, and then calculating RSI based on the ROC results, which can better reflect the intrinsic trend of price rises and falls. When RSI/ROC is below 30 it is in oversold territory, and above 70 is in overbought territory, at which point reverse operations can be performed.
The strategy also sets buy zones and sell zones to divide the boundaries of high and low indicator values, and reverse trading is performed when reverse trading is enabled. Different color visual styles are set for the indicator values.
-
The ROC indicator can filter out some of the noise in the price data, making the RSI/ROC indicator more stable and reliable.
-
The combination of buy zones and sell zones makes it easier to identify overbought and oversold conditions.
-
The reverse trading function can be used for two different trading methods.
-
Visual styles of the indicators make them easy to judge and use.
-
RSI/ROC indicator parameters are customizable to suit different market environments.
-
Like other technical indicators, this strategy may also give false signals.
-
RSI/ROC indicator may lag in response to sudden major news events because it references ROC.
-
Inappropriate buy zone and sell zone settings may miss trading opportunities or add unnecessary trades.
-
Pay attention to the risk of trend reversal in reverse trading mode.
-
Improper parameter settings can lead to excessive liquidation or re-entry.
-
Consider combining other indicators to mitigate some risks. Optimize parameter settings to suit different trading instruments.
-
Combine moving average and other indicators to identify trend direction and avoid counter-trend trading.
-
Optimize RSI length and ROC length parameters to better suit the characteristics of specific trading instruments.
-
Adjust buy zone and sell zone parameters to capture important overbought and oversold signals.
-
Incorporate stop loss strategies to control single loss.
-
Consider using this strategy only in trending markets and suspend it during consolidations.
The RSI based on ROC trading strategy innovatively combines the ROC indicator and RSI indicator to form a new RSI/ROC indicator. This indicator can effectively filter out noise in price data and judge overbought and oversold conditions. With proper optimization and risk control, its reliability and applicability will be greater. This strategy retains the advantages of RSI while enhancing the trend judgment capability of ROC. It is a reliable and customizable trading strategy.
[/trans]
Strategy Arguments
| Argument | Default | Description |
|---|---|---|
| v_input_1 | 20 | RSILength |
| v_input_2 | 20 | ROCLength |
| v_input_3 | 30 | BuyZone |
| v_input_4 | 70 | SellZone |
| v_input_5 | false | Trade reverse |
Source (PineScript)
/*backtest
start: 2022-10-30 00:00:00
end: 2023-11-05 00:00:00
period: 1d
basePeriod: 1h
exchanges: [{"eid":"Futures_Binance","currency":"BTC_USDT"}]
*/

//@version=2
////////////////////////////////////////////////////////////
//  Copyright by HPotter v1.0 31/10/2017
// This is the new-age indicator which is version of RSI calculated upon
// the Rate-of-change indicator.
// The name "Relative Strength Index" is slightly misleading as the RSI
// does not compare the relative strength of two securities, but rather
// the internal strength of a single security. A more appropriate name
// might be "Internal Strength Index." Relative strength charts that compare
// two market indices, which are often referred to as Comparative Relative Strength.
// And in its turn, the Rate-of-Change ("ROC") indicator displays the difference
// between the current price and the price x-time periods ago. The difference can
// be displayed in either points or as a percentage. The Momentum indicator displays
// the same information, but expresses it as a ratio.
//
// You can change long to short in the Input Settings
// WARNING:
// - For purpose educate only
// - This script to change bars colors.
///////////////////////////////////////////////////////////
strategy(title="RSI based on ROC", shorttitle="RSI/ROC")
RSILength = input(20, minval=1)
ROCLength = input(20, minval=1)
BuyZone = input(30, minval=1)
SellZone = input(70, minval=1)
reverse = input(false, title="Trade reverse")
xPrice = close
hline(SellZone, color=red, linestyle=line, title = "Upper")
hline(BuyZone, color=green, linestyle=line, title = "Lower")
nRes = rsi(roc(xPrice,ROCLength),RSILength)
pos = iff(nRes < BuyZone, -1,
	   iff(nRes > SellZone, 1, nz(pos[1], 0)))
possig = iff(reverse and pos == 1, -1,
          iff(reverse and pos == -1, 1, pos))
if (possig == 1)
    strategy.entry("Long", strategy.long)
if (possig == -1)
    strategy.entry("Short", strategy.short)
barcolor(possig == -1 ? red: possig == 1 ? green : blue )
plot(nRes, color=blue, title="RSI/ROC")
Detail
https://www.fmz.com/strategy/431226
Last Modified
2023-11-06 10:52:31
