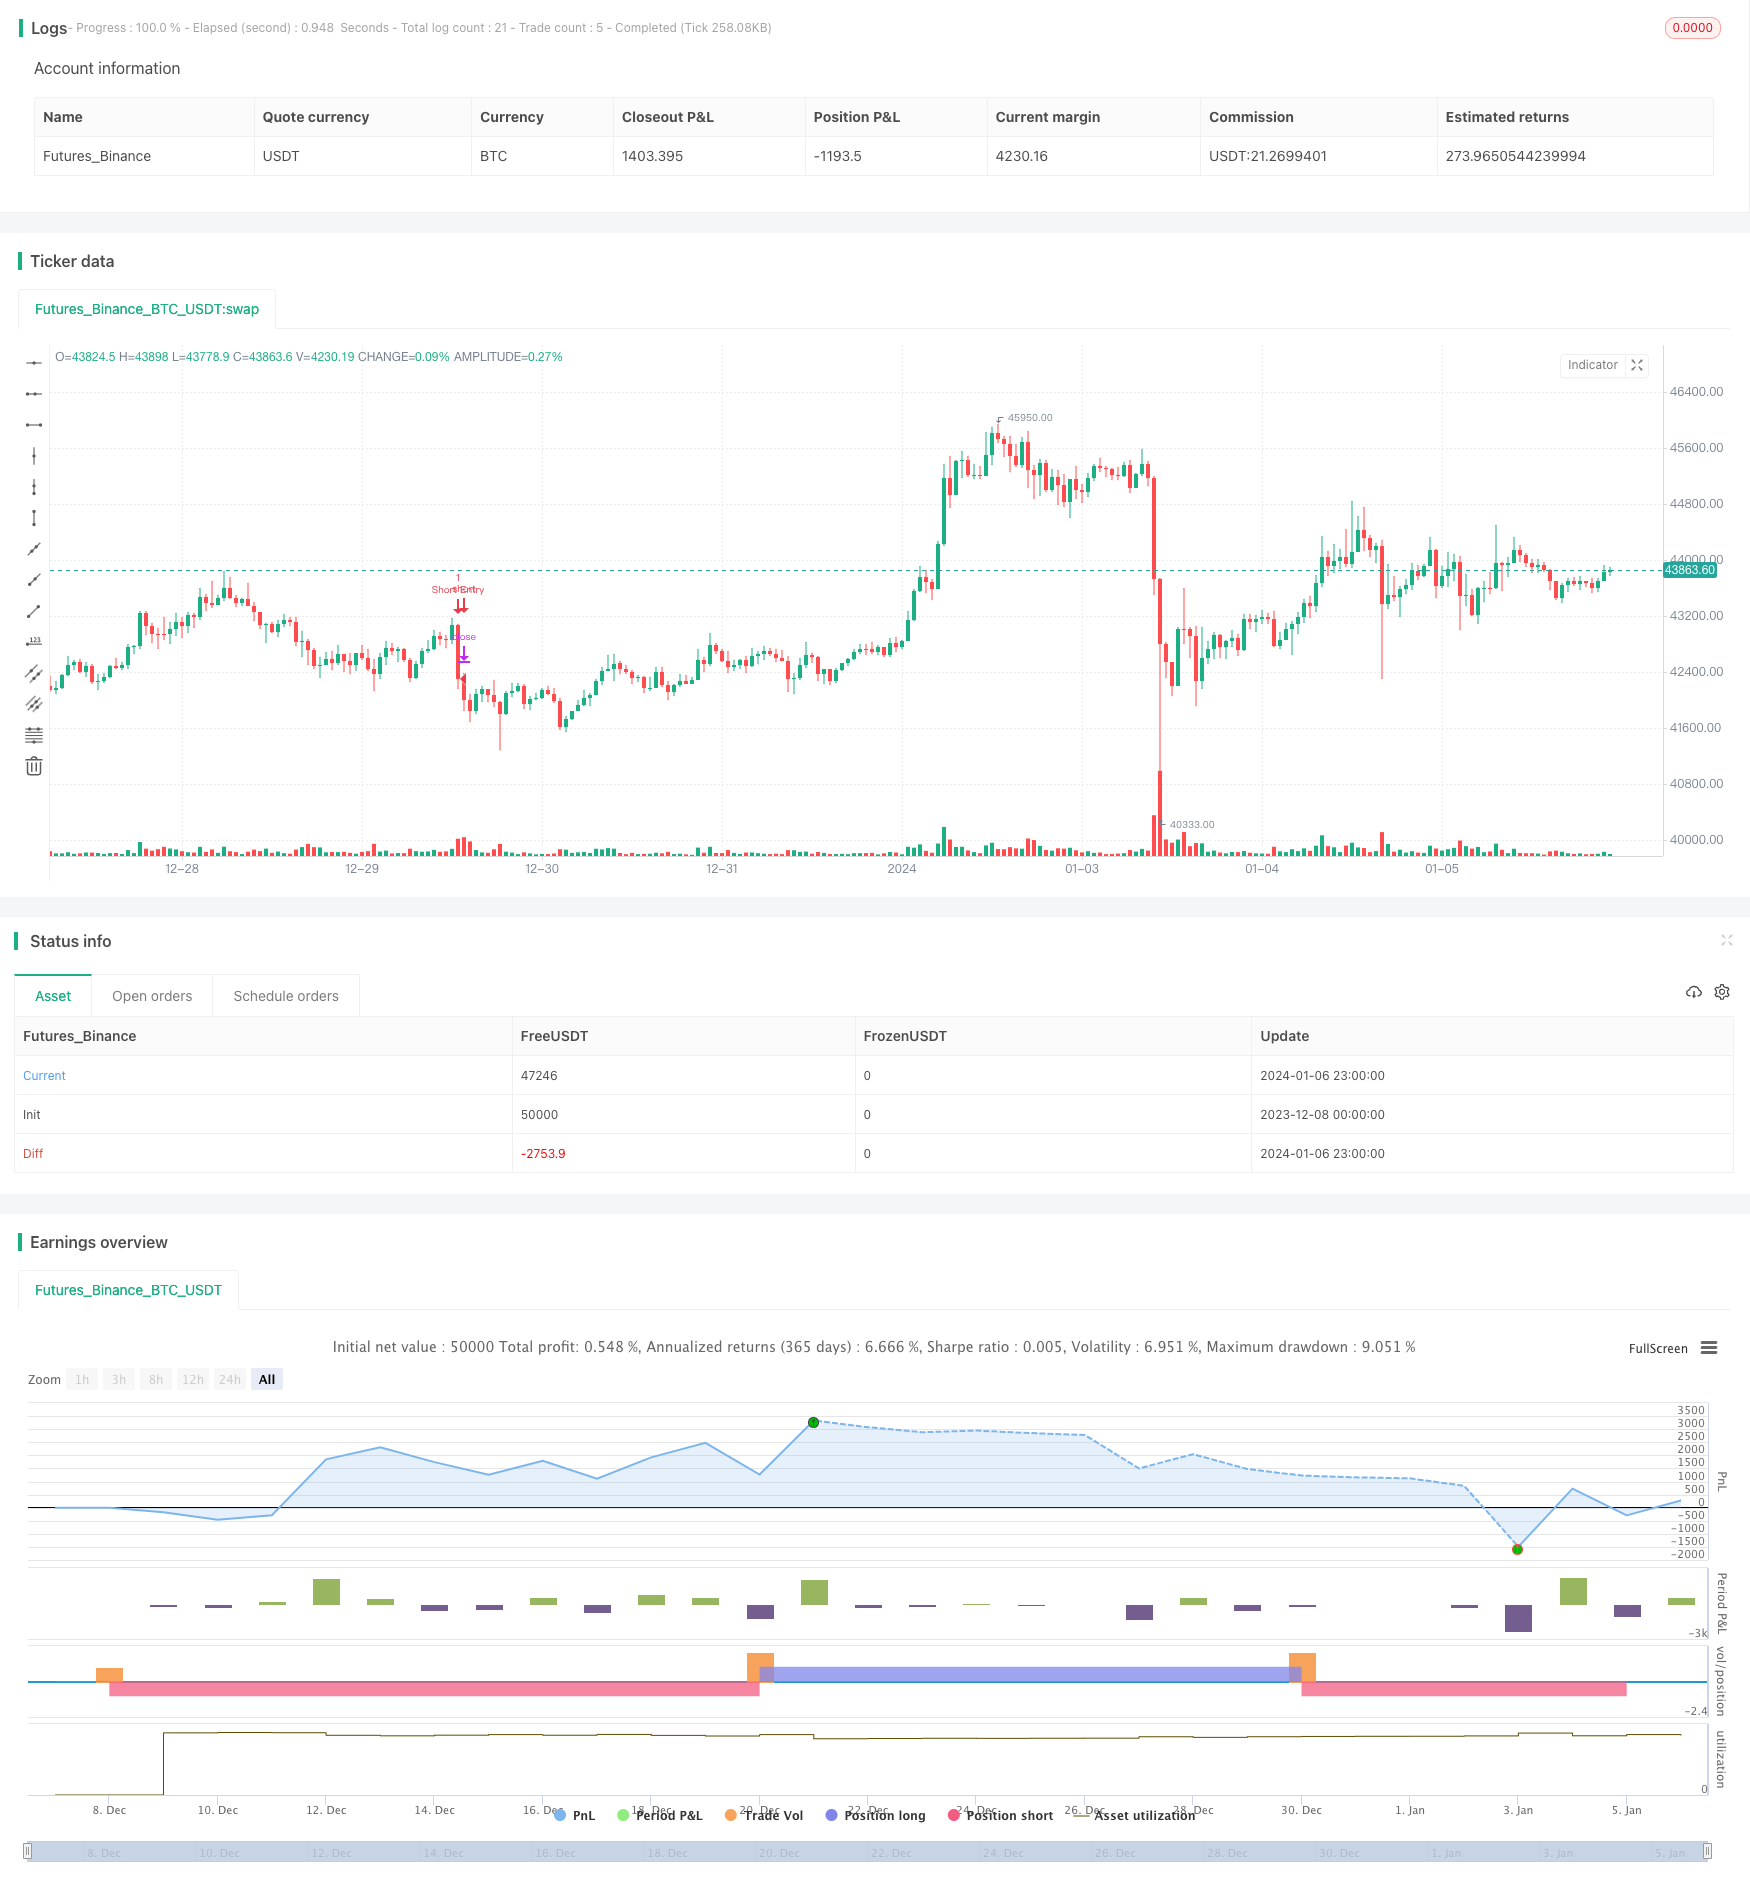
Name
基于RSI和布林带的获利策略RSI-and-Bollinger-Bands-Profitable-Strategy
Author
ChaoZhang
Strategy Description
该策略主要基于RSI指标和布林带指标设计交易规则,实现在趋势市场中获利。当RSI低于超买线而价格接近布林带下轨时做多;当RSI高于超卖线而价格接近布林带上轨时做空,这是该策略的基本交易逻辑。
该策略使用RSI指标判断超买超卖区域。RSI低于设定的超买线则为超卖信号,高于超卖线则为超买信号。同时使用布林带指标判断价格突破。当价格由下至上突破布林带下轨时为做多信号,由上至下突破上轨时为做空信号。
该策略综合运用了RSI指标判断市场意愿和布林带判断价格突破两个因素,形成交易决策依据。只有两者同时符合条件时才发出交易信号,可以有效过滤掉一些假信号,提高策略效果。
该策略结合RSI和布林带两个指标,可以更准确判断市场走势和捕捉趋势。相比单一指标策略,可以过滤更多假信号,信号质量更高。而RSI指标可以判断超买超卖现象,布林带指标判断价格突破则可以捕捉突破开始的趋势。两者结合使用效果更好。
该策略只在RSI和布林带指标同时发出信号时才开仓,可以有效避免假信号的干扰。同时结合停损来控制风险,即使行情转变也可以及时止损。
该策略虽然可以过滤掉一定假信号,但在震荡行情中,RSI和布林带指标可能同时发出错误信号,导致不必要的亏损。此外,参数设置不当也会导致策略效果不佳。
建议通过回测优化参数,寻找最佳参数组合。同时适当调整策略规则,在震荡行情中暂停交易,避免不必要的损失。此外,合理使用止损来控制单笔损失。
该策略可以从以下几个方面进行优化:
-
优化RSI参数和布林带参数,寻找最佳参数组合
-
增加其他指标作为过滤信号,如MACD、KD等
-
增加突破验证机制,避免假突破
-
根据不同行情类型调整参数或停止交易
-
优化止损策略,实现动态止损
该策略结合RSI指标和布林带指标设计交易规则,只在两者发出同步信号时才开仓,可以有效过滤假信号。通过参数优化、增加信号过滤、止损策略优化等手段,可以不断优化和改进该策略,实现更稳定的盈利。
||
This strategy mainly uses the RSI indicator and Bollinger Bands to design trading rules and make profits in trending markets. It goes long when RSI is below overbought line and price is near the Bollinger Bands lower band; it goes short when RSI is above oversold line and price is near the upper band. This is the basic trading logic.
The strategy uses RSI indicator to identify overbought and oversold levels. RSI below the overbought threshold is considered oversold signal, while above oversold threshold is overbought signal. Bollinger Bands indicator is used to detect price breakouts. Upward breakout of the lower band is long signal, while downward breakout of upper band is short signal.
The strategy combines RSI for gauging market sentiment and Bollinger Bands for detecting price breakout. Trades are opened only when both conditions are met simultaneously. This helps filter out fake signals and improves strategy performance.
The strategy combines RSI and Bollinger Bands, which helps better determine market trend and capture momentum. Compared to single indicator strategies, it filters out more false signals and generates higher quality signals. RSI gauges overbought/oversold levels, while BB catches trend after the breakout. Together they work very effectively.
The strategy opens trades only when both RSI and BB give signals simultaneously. This avoids interference from fake signals. With stop loss in pace, risks can also be controlled when market turns around.
Although the strategy filters out some false signals, RSI and BB may still give out wrong signals simultaneously in ranging markets, causing unnecessary losses. Inappropriate parameter settings may also lead to poor strategy performance.
It's recommended to optimize parameters through backtesting to find the best parameter combination. Also, consider pausing trading in ranging markets to avoid unnecessary losses. In addition, use stop loss properly to control single trade loss.
The strategy can be improved in the following aspects:
-
Optimize RSI and BB parameters for best combination
-
Add other indicators as filter signals, like MACD, KD etc
-
Add breakthrough validation to avoid false breakouts
-
Adjust parameters or stop trading per different market conditions
-
Optimize stop loss for dynamic stop loss
The strategy combines RSI and Bollinger Bands to design trading rules. By only taking signals when both agree, fake signals can be filtered out effectively. Through parameter optimization, adding signal filters, stop loss optimization etc., this strategy can be constantly refined for more stable profits.
[/trans]
Strategy Arguments
| Argument | Default | Description |
|---|---|---|
| v_input_1 | 16 | RSI Period Length |
| v_input_2 | 45 | RSI Value Range |
| v_input_3 | 20 | Bollinger Bands SMA Period Length |
| v_input_4 | 2 | Bollinger Bands Standard Deviation |
Source (PineScript)
/*backtest
start: 2023-12-08 00:00:00
end: 2024-01-07 00:00:00
period: 1h
basePeriod: 15m
exchanges: [{"eid":"Futures_Binance","currency":"BTC_USDT"}]
*/

//@version=5
strategy("Get Funded Easily by mjanusic", shorttitle="FTMO Crusher by mjanusic", overlay=true)

///////////// RSI
RSIlength = input(16, title="RSI Period Length")
RSIvalue = input(45, title="RSI Value Range")
RSIoverSold = 0 + RSIvalue
RSIoverBought = 100 - RSIvalue
price = close
vrsi = ta.rsi(price, RSIlength)

///////////// Bollinger Bands
BBlength = input(20, title="Bollinger Bands SMA Period Length")
BBmult = input(2.0, title="Bollinger Bands Standard Deviation")
BBbasis = ta.sma(price, BBlength)
BBdev = BBmult * ta.stdev(price, BBlength)
BBupper = BBbasis + BBdev
BBlower = BBbasis - BBdev
source = close
buyCondition = ta.crossover(vrsi, RSIoverSold) and ta.crossover(source, BBlower)
sellCondition = ta.crossunder(vrsi, RSIoverBought) and ta.crossunder(source, BBupper)

///////////// RSI + Bollinger Bands Strategy
if (not na(vrsi))
    if (buyCondition)
        strategy.entry("Long Entry", strategy.long, stop=BBlower, comment="Long Entry")
    else
        strategy.cancel(id="Long Entry")

    if (sellCondition)
        strategy.entry("Short Entry", strategy.short, stop=BBupper, comment="Short Entry")
    else
        strategy.cancel(id="Short Entry")

//plot(strategy.equity, title="equity", color=color.red, linewidth=2, style=plot.style_area)
Detail
https://www.fmz.com/strategy/438018
Last Modified
2024-01-08 11:14:31
