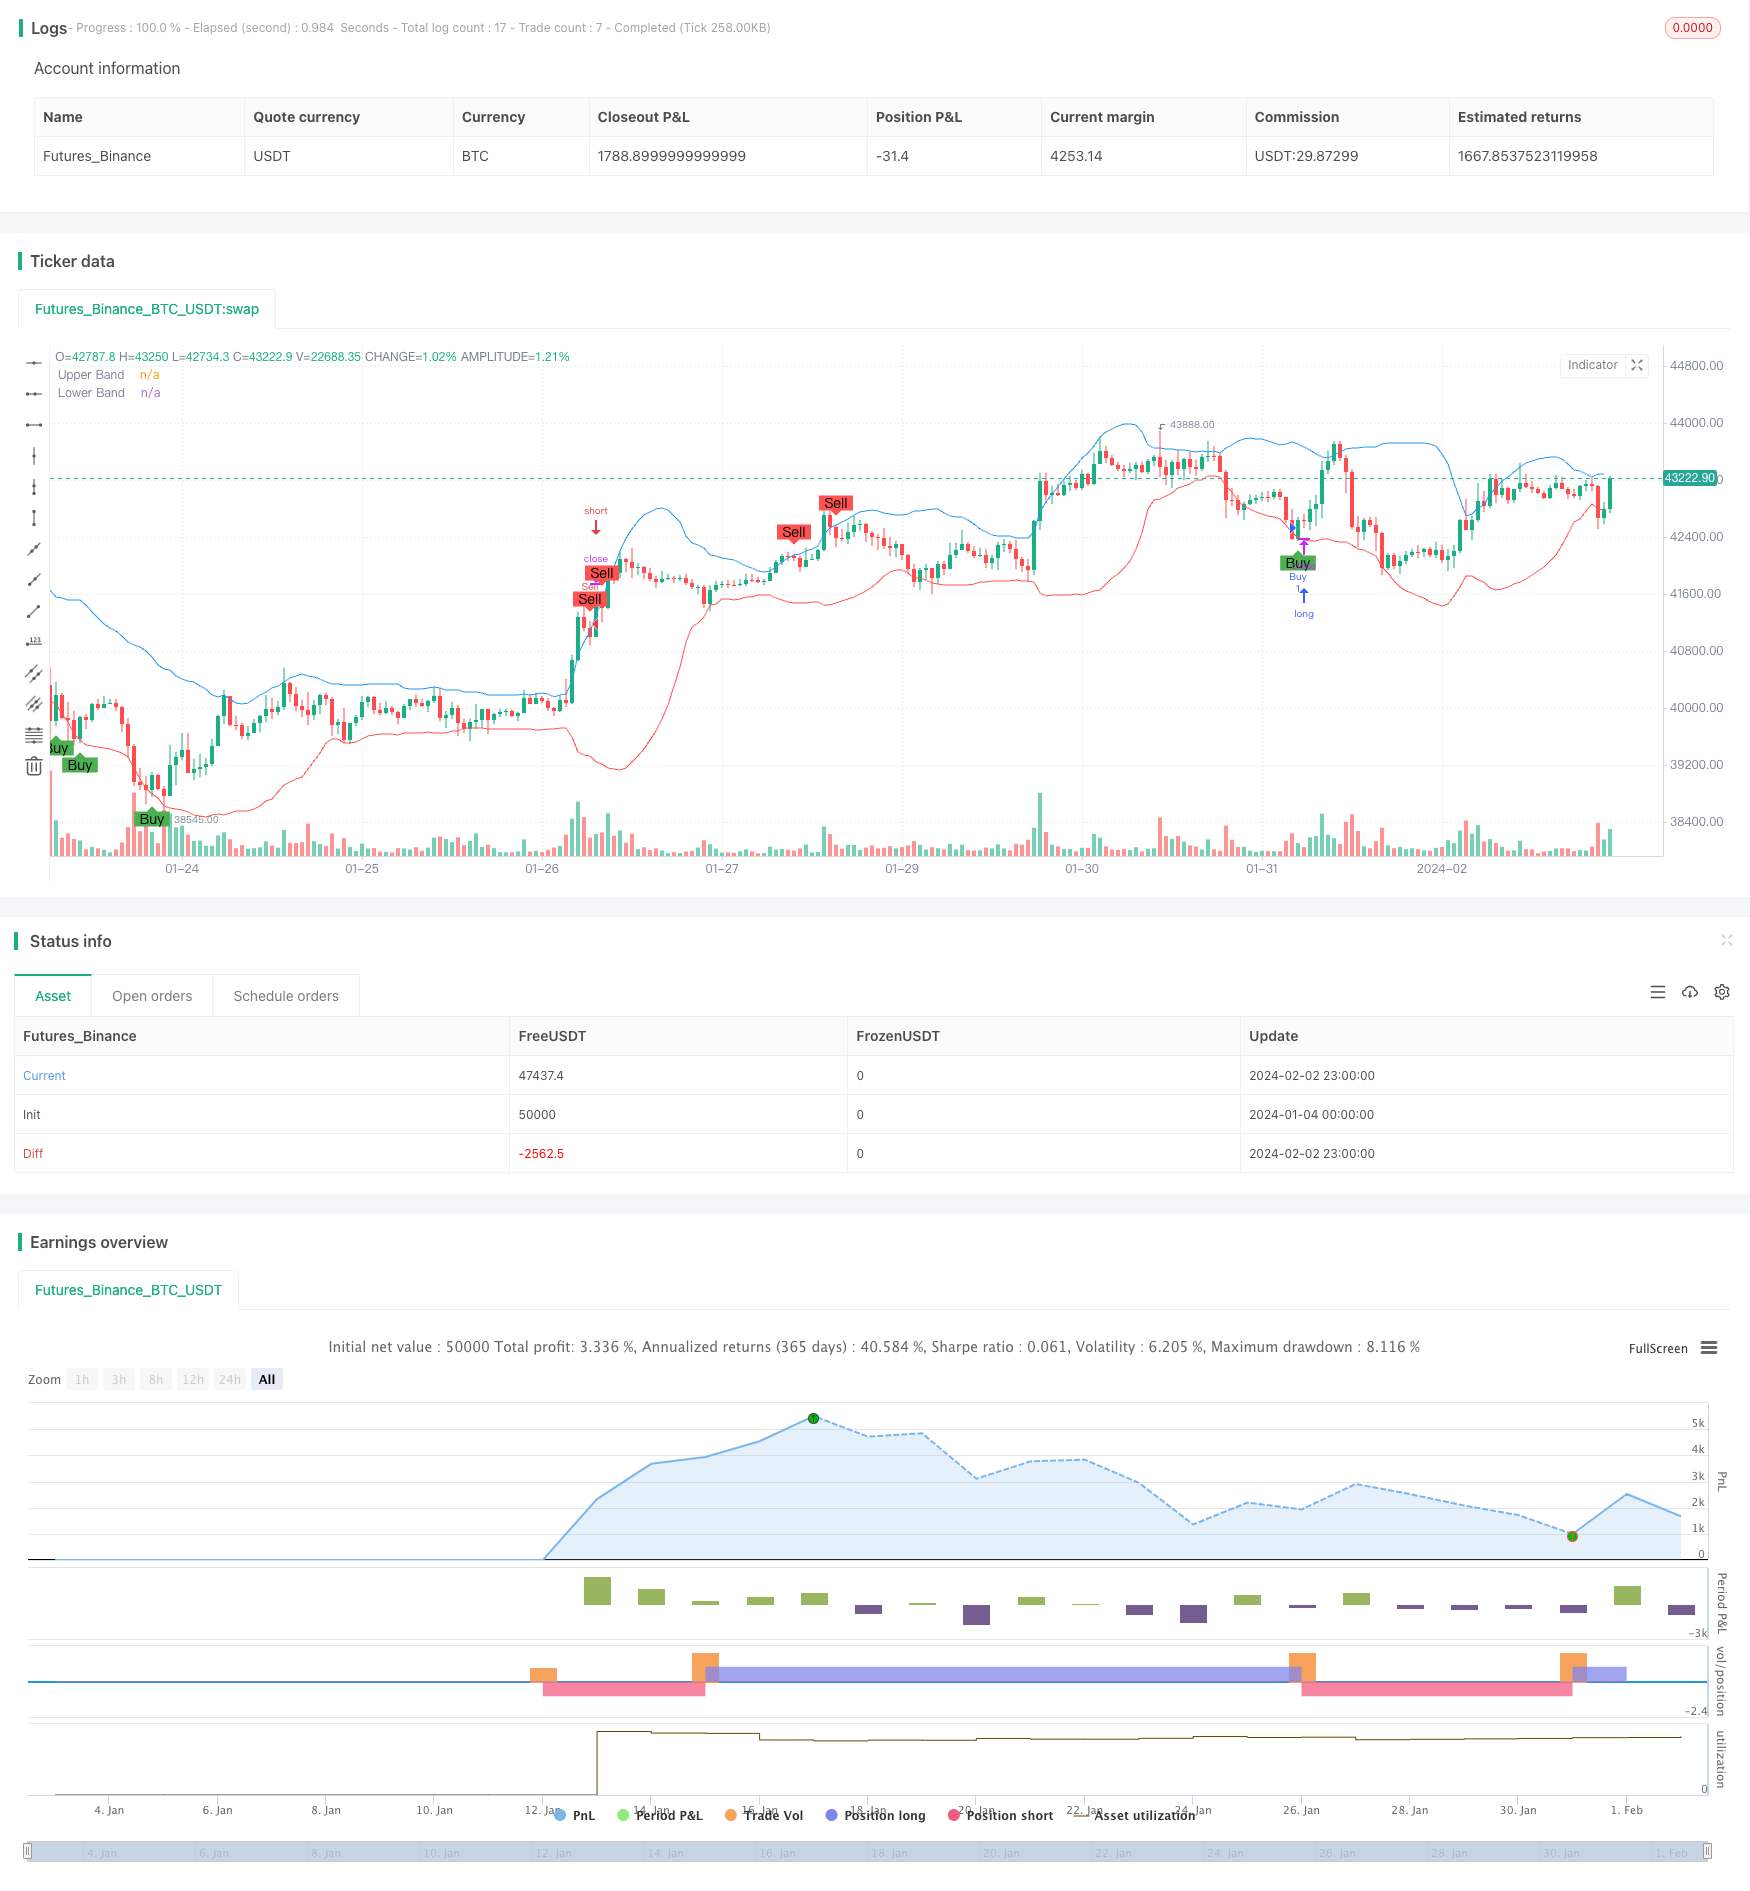
Name
基于RSI和布林带的量化交易策略Quantitative-Trading-Strategy-Based-on-RSI-and-Bollinger-Bands
Author
ChaoZhang
Strategy Description
本文将深入分析一种基于RSI和布林带这两个技术指标的量化交易策略。该策略充分利用RSI识别超买超卖现象和布林带判断价格离散程度的优势,实现更准确判断市场走势的转折点。
-
RSI原理
RSI即相对强弱指数,是通过计算一段时间内股票价格变动的幅度大小,来计量这段时间内股票强弱程度的技术指标。它的取值范围在0-100之间,当RSI大于70时为超买区,小于30时为超卖区。出现超买超卖现象往往意味着价格可能反转。
-
布林带原理
布林带由中轨、上轨和下轨组成。中轨是n天的移动平均线,上轨是中轨+k倍的n天标准差,下轨是中轨-k倍的n天标准差。当价位接近上轨或下轨时,是中轴附近区域波动加大的信号,预示着可能的回转。
-
策略构建
该策略结合RSI指标判断超买超卖的时机以及布林带判断价格波动的时机,在RSI指标进入超买区或超卖区的同时,价格接触布林带上轨或下轨产生交易信号,以捕捉价格趋势的转折点。从而实 现低买高卖的效果。
-
充分利用RSI指标判断超买超卖的优势,设置合理的超买超卖阈值,避免虚假信号。
-
借助布林带判断价格波动和离散情况,结合RSI形成交易决策依据,提高决策的准确性。
-
RSI和布林带互相验证判断,双重指标过滤减少错误交易的可能性。
-
能够有效识别价格上涨和下跌的转折点,捕捉价格反转机会。
-
无法完全避免技术指标产生错误信号的可能。
-
RSI参数和布林带参数设置不当,可能错失交易机会或增加不必要交易。
-
行情剧烈波动时,仍有可能出现止损的风险。
-
需要适当调整参数以适应不同品种和市场环境。
-
对RSI指标和布林带参数进行测试和优化,找到最优参数。
-
增加止损策略,严格控制单笔损失。
-
结合其他指标进行验证,如KDJ、MACD等以提高稳健性。
-
增加自动参数调整模块,使策略参数动态适应当前市场环境。
基于RSI和布林带的量化交易策略,通过双重技术指标验证和组合,能有效判断价格趋势转折点。策略简单实用易于实现,具有准确性高、频繁交易、容易优化等优点。但仍需要注意风险控制,并进行参数测试、止损策略和指标优化等工作,以提高策略稳定性和盈利能力。
||
This article analyzes in depth a quantitative trading strategy based on the RSI and Bollinger Band technical indicators. By fully utilizing the advantages of RSI in identifying overbought and oversold conditions and Bollinger Bands in judging price volatility, this strategy enables more accurate identification of inflection points in market trends.
-
RSI Principle
RSI stands for Relative Strength Index. It is a technical indicator that measures the magnitude of recent price changes to evaluate overbought or oversold conditions. RSI ranges from 0 to 100. Values over 70 indicate an overbought state and values below 30 indicate an oversold state. The emergence of overbought and oversold conditions often implies a potential price reversal.
-
Bollinger Bands Principle
Bollinger Bands consist of a middle band, an upper band and a lower band. The middle band is a n-day moving average, while the upper band is set two standard deviations above the middle band and the lower band is set two standard deviations below. Touching or crossing these bands indicates increased volatility and an upcoming reversal.
-
Strategy Construction
This strategy combines RSI to determine overbought and oversold entry signals and Bollinger Bands to ascertain price volatility, generating trading signals when RSI enters overbought/oversold territory concurrently with prices touching the Bollinger bands. This allows it to capture trend turning points and achieve buying low and selling high.
-
Fully utilizes RSI's strength in identifying overbought and oversold conditions by setting reasonable thresholds to avoid false signals.
-
Leverages Bollinger Bands to judge price fluctuation and volatility then formulates trading decisions together with RSI, enhancing decision accuracy.
-
RSI verifies signals generated by Bollinger Bands and vice versa to reduce trading mistakes.
-
Capably detects price uptrend and downtrend reversals to seize price reversal opportunities.
-
False signals generated by technical indicators cannot be fully avoided.
-
Improper RSI parameter or Bollinger Band parameter settings may lead to missing trading chances or unnecessary trades.
-
Potential stop loss risks still exist under sharp market fluctuations.
-
Parameters need reasonable adjustments to suit different products and market environments.
-
Test and optimize RSI and Bollinger Band parameters to find optimum parameter sets.
-
Add stop loss strategies to strictly control losses per trade.
-
Incorporate other indicators like KDJ and MACD to enhance robustness.
-
Build auto parameter tuning module to dynamically adapt strategy parameters to current market conditions.
The quantitative trading strategy based on RSI and Bollinger Bands, through double indicator verification and combination, can effectively determine price trend inflection points. This strategy is simple, practical, and easy to implement, with the advantages of high accuracy, frequent trading, and easy optimization. However risk control remains vital alongside parameter testing, stop loss tactics, and indicator optimization to improve strategy stability and profitability. [/trans]
Strategy Arguments
| Argument | Default | Description |
|---|---|---|
| v_input_int_1 | 14 | RSI Length |
| v_input_int_2 | 70 | Overbought Level |
| v_input_int_3 | 30 | Oversold Level |
| v_input_int_4 | 20 | BB Length |
| v_input_float_1 | 2 | BB Deviation |
Source (PineScript)
/*backtest
start: 2024-01-04 00:00:00
end: 2024-02-03 00:00:00
period: 1h
basePeriod: 15m
exchanges: [{"eid":"Futures_Binance","currency":"BTC_USDT"}]
*/

//@version=5
strategy("RSI & Bollinger Bands Strategy", overlay=true)

// RSI ayarları
rsi_length = input.int(14, title="RSI Length")
overbought = input.int(70, title="Overbought Level")
oversold = input.int(30, title="Oversold Level")
rsi = ta.rsi(close, rsi_length)

// Bollinger Bands ayarları
length = input.int(20, title="BB Length")
mult = input.float(2.0, title="BB Deviation")
basis = ta.sma(close, length)
dev = mult * ta.stdev(close, length)
upper = basis + dev
lower = basis - dev

// Alım-satım sinyalleri
longCondition = ta.crossover(rsi, oversold) and ta.crossover(close, lower)
shortCondition = ta.crossunder(rsi, overbought) and ta.crossunder(close, upper)

// Alım ve satım koşullarına göre işlem yapma
if (longCondition)
    strategy.entry("Buy", strategy.long)
if (shortCondition)
    strategy.entry("Sell", strategy.short)

// Alım ve satım sinyallerini görselleştirme
plotshape(series=longCondition, title="Buy Signal", location=location.belowbar, color=color.green, style=shape.labelup, text="Buy")
plotshape(series=shortCondition, title="Sell Signal", location=location.abovebar, color=color.red, style=shape.labeldown, text="Sell")

// Bollinger Bantları'nı grafik üzerine çizme
plot(upper, title="Upper Band", color=color.blue)
plot(lower, title="Lower Band", color=color.red)
Detail
https://www.fmz.com/strategy/440988
Last Modified
2024-02-04 15:22:41
