Name
基于RSI和MACD指标的交易策略Trading-Strategy-Based-on-RSI-and-MACD-Indicators
Author
ChaoZhang
Strategy Description
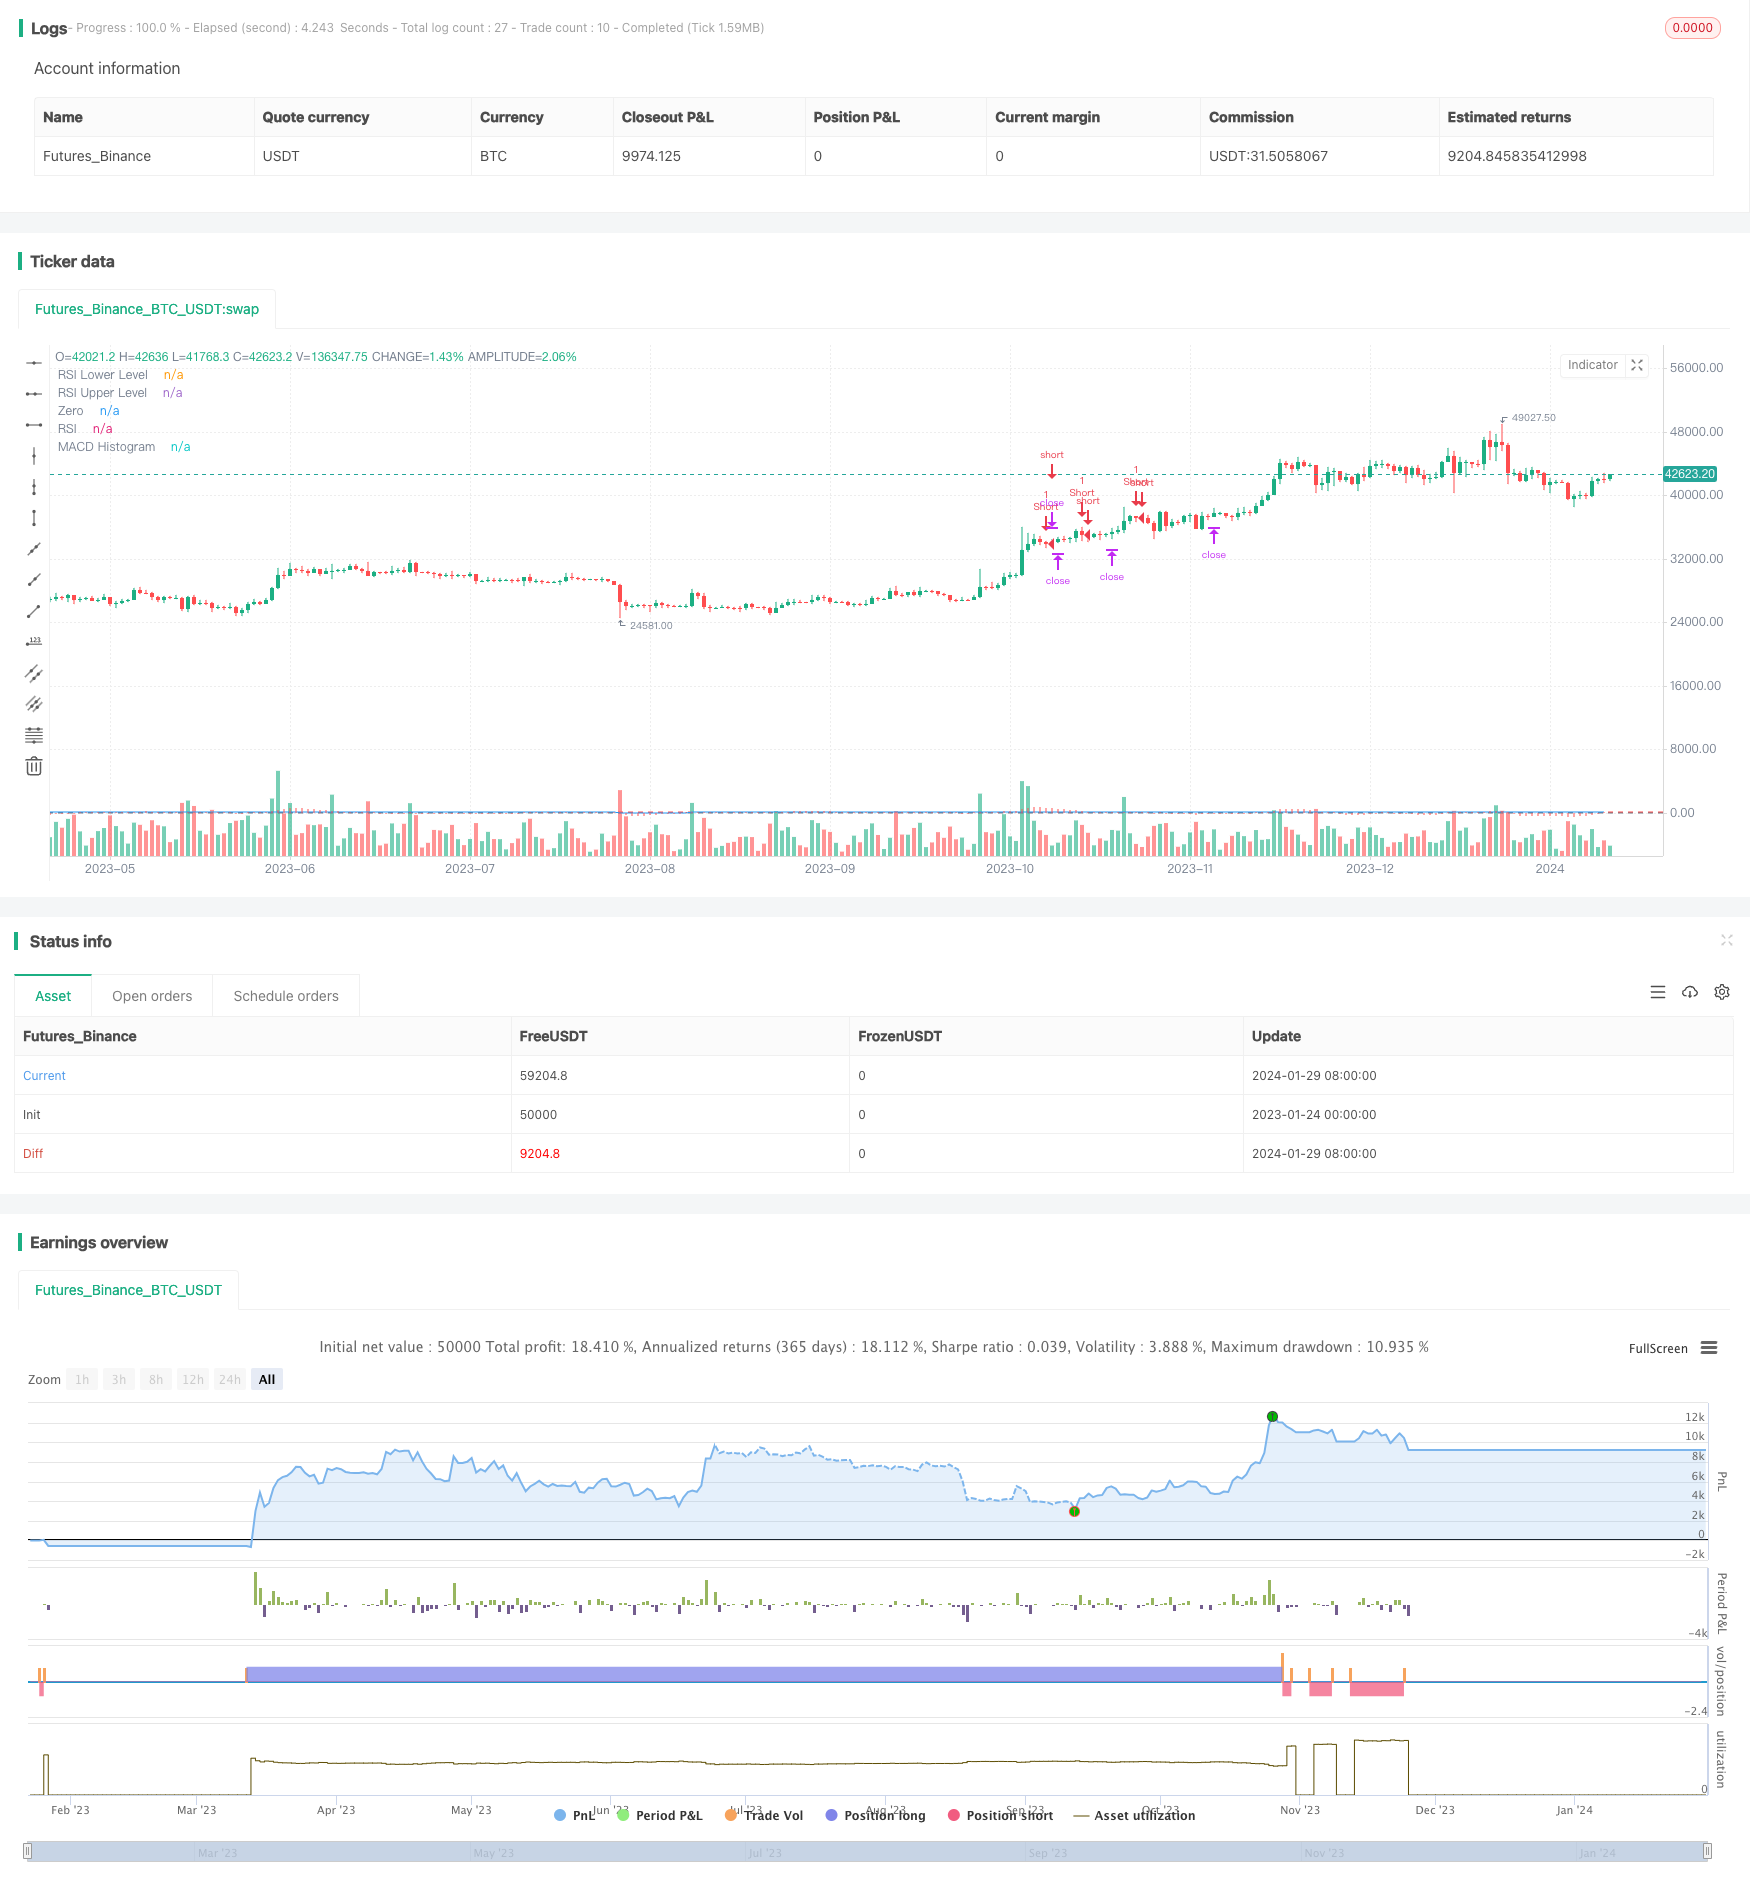
本策略结合相对强弱指数(RSI)和移动平均聚散指标(MACD)来识别BTC的交易机会。当RSI低于30时和MACD线低于信号线且MACD Histogram小于-100时做多;当RSI高于80并且MACD线高于信号线且MACD Histogram大于250时做空。该策略还使用了追踪止损来锁定利润。
-
使用RSI指标来判断市场是否超卖或超买。RSI低于30视为超卖信号,高于80视为超买信号。
-
使用MACD指标的MACD线和信号线的金叉死叉来判断买卖时机。当MACD线上穿信号线时为买入信号;当MACD线下穿信号线时为卖出信号。
-
结合RSI指标和MACD指标的信号,形成该策略的入场条件。
-
使用追踪止损来锁定利润,追踪止损根据持仓盈亏来实时更新,可以有效控制风险。
-
该策略结合RSI和MACD两个指标,可以有效过滤假信号。
-
RSI指标可以有效判断市场超买超卖现象。MACD指标可以抓住趋势的变化。两者结合使用效果好。
-
使用追踪止损可以根据市场实时行情来止损,最大程度锁定利润,控制风险。
-
策略参数较少,易于实现。
-
单一品种策略,品种本身存在的系统性风险。
-
RSI指标在区间市和底部反弹时可能产生虚假信号。MACD指标在震荡行情中也可能产生错误信号。
-
追踪止损在大幅行情中可能被突破,无法控制风险。
-
参数设置不当可能导致交易频繁或漏单。
-
可以考虑结合其他指标如布林线、KD等来发出交易信号。
-
可以研究不同品种之间的相关性,建立多品种套利策略。
-
可以优化止损策略,如及时止损、平均止损等方式。
-
可以结合机器学习等方式来智能优化参数。
本策略是一套基于RSI和MACD指标判断超买超卖的趋势跟踪策略。它有效结合了技术指标的优势,可以抓住市场的趋势变化。同时,策略简单直接,易于实施。通过优化可以进一步扩展该策略的应用。
||
This strategy combines the Relative Strength Index (RSI) and Moving Average Convergence Divergence (MACD) indicators to identify trading opportunities for BTC. It goes long when RSI is below 30 and MACD line is below signal line and MACD Histogram is less than -100; it goes short when RSI is above 80 and MACD line is above signal line and MACD Histogram is greater than 250. The strategy also uses a trailing stop loss to lock in profits.
-
Use the RSI indicator to determine if the market is oversold or overbought. RSI below 30 is viewed as an oversold signal, while above 80 is viewed as an overbought signal.
-
Use the MACD indicator's MACD line and signal line crossovers to determine entries and exits. When the MACD line crosses above the signal line, it is a buy signal; when the MACD line crosses below the signal line, it is a sell signal.
-
Combine the signals from RSI and MACD indicators to form the entry rules for this strategy.
-
Use a trailing stop loss to lock in profits. The trailing stop loss updates dynamically based on profit/loss of an open position, allowing effective risk control.
-
Combining RSI and MACD indicators helps filter out false signals effectively.
-
RSI is good at detecting overbought/oversold market conditions. MACD captures trend changes well. Using both creates a strong strategy.
-
Trailing stop loss locks in profits according to live market movements, controlling risk.
-
The strategy has few parameters and is easy to implement.
-
Single instrument risk from trading only BTC.
-
RSI may generate false signals during range-bound and bottom-reversal scenarios. MACD oscillators can also provide erroneous signals in choppy markets.
-
Trailing stop loss could be hit hard during huge market swings, failing to control risk.
-
Poor parameter tuning may lead to overtrading or missed trades.
-
Consider adding other indicators like Bollinger Bands, KD etc. to supplement trade signals.
-
Study inter-market correlation between different instruments, build multi-pair mean reversion strategies.
-
Optimize stop loss mechanisms e.g. timely stop loss, average stop loss etc.
-
Incorporate machine learning for smart parameter optimization.
This is a trend-following strategy based on RSI and MACD indicators to determine overbought/oversold scenarios. It combines the strengths of technical indicators well to capture trend changes in the market. Meanwhile, the strategy logic is simple and easy to implement. Further optimizations can expand its applications.
[/trans]
Strategy Arguments
| Argument | Default | Description |
|---|---|---|
| v_input_1 | 14 | RSI Period |
| v_input_2 | 12 | MACD Short Period |
| v_input_3 | 26 | MACD Long Period |
| v_input_4 | 9 | MACD Signal Period |
| v_input_float_1 | 2.5 | Trailing Stop Loss Factor |
Source (PineScript)
/*backtest
start: 2023-01-24 00:00:00
end: 2024-01-30 00:00:00
period: 1d
basePeriod: 1h
exchanges: [{"eid":"Futures_Binance","currency":"BTC_USDT"}]
*/

//@version=5
strategy("BTC/USDT RSI and MACD Strategy", overlay = true)

// Define the RSI period
rsiPeriod = input(14, "RSI Period")

// Calculate the RSI
rsi = ta.rsi(close, rsiPeriod)

// Define the MACD parameters
macdShort = input(12, "MACD Short Period")
macdLong = input(26, "MACD Long Period")
macdSignal = input(9, "MACD Signal Period")

// Calculate the MACD
[macdLine, signalLine, _] = ta.macd(close, macdShort, macdLong, macdSignal)

// Define the trailing stop level
trailing_stop_loss_factor = input.float(2.50, "Trailing Stop Loss Factor", step = 0.01)

// Define the entry and exit conditions
enterLong = ta.crossover(rsi, 30) and macdLine < signalLine and macdLine < -100
enterShort = ta.crossunder(rsi, 83) and macdLine > signalLine and macdLine > 250

// Submit the orders
if (enterLong)
    strategy.entry("Long", strategy.long)
if (enterShort)
    strategy.entry("Short", strategy.short)

// Trailing Stop Loss
longTrailingStopLoss = strategy.position_avg_price * (1 - trailing_stop_loss_factor / 100)
shortTrailingStopLoss = strategy.position_avg_price * (1 + trailing_stop_loss_factor / 100)
if strategy.position_size > 0
    strategy.exit("Exit Long", "Long", stop  = longTrailingStopLoss)
if strategy.position_size < 0
    strategy.exit("Exit Short", "Short", stop = shortTrailingStopLoss)

// Plot the indicators
plot(rsi, "RSI", color=color.blue)
hline(20, "RSI Lower Level", color=color.green)
hline(80, "RSI Upper Level", color=color.red)
plot(macdLine - signalLine, "MACD Histogram", color=color.red, style=plot.style_histogram)
hline(0, "Zero", color=color.gray)
Detail
https://www.fmz.com/strategy/440551
Last Modified
2024-01-31 16:07:31
