Name
基于RSI均线交叉策略RSI-Moving-Average-Crossover-Strategy
Author
ChaoZhang
Strategy Description
RSI均线交叉策略通过计算快速RSI和慢速RSI的均线交叉来判断入场和退出的时机。当快速RSI的均线从下方向上突破慢速RSI的均线时,为买入信号;当快速RSI的均线从上方向下跌破慢速RSI的均线时,为卖出信号。该策略结合RSI指标和移动平均线的优点,可以有效过滤市场噪音,抓住价格趋势反转的时机。
本策略首先分别计算长度为100和40的RSI指标,其中长度为100的RSI代表快速RSI,长度为40的RSI代表慢速RSI。然后分别计算这两个RSI的21日简单移动平均线,长度为100 RSI的均线代表快速均线,长度为40 RSI的均线代表慢速均线。
在计算出快慢均线后,本策略以快速均线上穿慢速均线作为买入信号,表明股价的上涨势头正在形成;以快速均线下穿慢速均线作为卖出信号,表明股价上涨趋势可能结束。此外,本策略还会结合200日移动平均线来过滤信号,只有当收盘价格高于200日线时,才会发出买入信号。
RSI均线交叉策略结合双RSI和移动平均线,可以有效发现反转机会。具体优势包括:
-
使用双RSI指标可以更准确判断反转,双RSI分别描述快速周期和慢速周期的价格信息,交叉信号更具价值。
-
均线指标可以有效过滤震荡,抓住反转趋势的关键时机。
-
结合200日线可以进一步避免虚假信号,确保在相对强势的行情中操作。
-
策略思路简单清晰,容易理解和验证,也便于参数优化。
-
可同时用于股票和数字货币交易,适用范围广。
RSI均线交叉策略也存在一定的风险,主要包括:
-
双RSI均线交叉并不能完全避免假突破,需要结合其他指标验证。
-
在震荡行情中,停损可能被频繁触发。可以适当放宽止损范围,或等待更明确的反转信号。
-
参数设置需要不断测试和优化,如果参数选择不当,可能错过最佳交易时机或增加虚假信号。
-
策略本身并没有考虑大级别趋势解析,如果行情发生结构性调整,该策略可能产生大额亏损。建议与趋势和形态分析方法配合使用。
RSI均线交叉策略具有很强的优化空间,主要优化方向包括:
-
测试不同周期参数的组合,寻找最佳的参数组合。
-
添加其他指标进行信号过滤,如KDJ、MACD等,减少虚假信号。
-
优化止损机制,测试固定止损、跟踪止损、 Chandelier Exit 等止损方式。
-
结合更高级别的趋势分析指标,避免逆势操作。如加入ADX指标判断趋势强度。
-
测试在不同品种(股票、外汇、加密货币等)的效果,寻找最佳适用对象。
-
尝试机器学习和遗传算法等方法寻找最优参数。
RSI均线交叉策略整合双RSI指标和移动平均线的优点,通过快慢RSI均线的交叉判断买卖时机,可有效抓住反转机会。该策略简单实用,适用于多种交易品种,优化空间大。但也存在一定的风险,需要结合趋势分析和优化止损来控制。如果参数和过滤指标设置合理,RSI均线交叉策略可以成为一种非常有效的量化交易策略。
||
The RSI Moving Average Crossover Strategy generates trading signals by calculating the crossover between fast and slow moving averages of RSI indicators. When the moving average of the fast RSI crosses above that of the slow RSI, it is a buy signal. When the fast RSI moving average crosses below the slow RSI moving average, it is a sell signal. This strategy combines the strengths of RSI indicators and moving averages to effectively filter out market noise and identify trend reversal opportunities.
This strategy first calculates two RSI indicators with lengths of 100 and 40, representing the fast and slow RSIs respectively. It then calculates 21-day simple moving averages of these two RSIs, where the moving average of the 100 RSI is the fast moving average and the 40 RSI moving average is the slow one.
The strategy goes long when the fast moving average crosses above the slow moving average, indicating an uptrend is forming. It goes short when the fast moving average crosses below the slow one, signaling a potential trend reversal. In addition, it uses the 200-day moving average to filter signals, entering long only if the closing price is above the 200-day MA line.
The RSI Moving Average Crossover Strategy utilizes the strengths of dual RSI setups and moving averages to effectively identify reversal opportunities. The main advantages include:
- Using two RSIs can more accurately detect reversals by describing both fast and slow price cycles. Crossover signals are more meaningful.
- Moving averages help filter out whipsaws and catch key turning points.
- Incorporating the 200-day MA avoids false signals and ensures trading only in relatively strong trends.
- The strategy logic is simple and intuitive, easy to understand, validate and optimize.
- Widely applicable to stocks, forex, cryptocurrencies, etc.
Potential risks include:
- Crossovers may still lead to false breakouts. Other indicators should be used for signal confirmation.
- Stop loss can be frequently triggered during choppy periods. Wider stops or waiting for clearer reversal signal is recommended.
- Extensive backtesting and optimization is needed for ideal parameter selection.
- Larger trend analysis is not considered. Significant trend changes may lead to large losses. Using with other trend/pattern analysis tools is advised.
There is great room for optimization:
- Test different parameter combinations to find optimal settings.
- Add other indicators for signal filtering, e.g. KDJ, MACD, etc.
- Optimize stop loss mechanisms, e.g. fixed, trailing, Chandelier Exits.
- Incorporate higher timeframe trend analysis tools to avoid trading against major trends, e.g. adding ADX for trend strength.
- Test performance across different markets (stocks, forex, crypto, etc.) to find best asset class fit.
- Employ machine learning and genetic algorithms for robust parameter optimization.
The RSI Moving Average Crossover Strategy effectively combines the strengths of dual RSI setups and moving averages to identify high-probability reversal trades. The logic is simple and applicable across markets, with great optimization flexibility. Proper optimizations in stop loss, filter tools and trend analysis integration are advised to control risks. When set up optimally, this can be a very effective quantitative trading strategy.
[/trans]
Strategy Arguments
| Argument | Default | Description |
|---|---|---|
| v_input_int_1 | 100 | Length Of Fast RSI |
| v_input_int_2 | 40 | Length Of Slow RSI |
| v_input_int_3 | 21 | Length Of Moving Average |
| v_input_int_4 | 200 | Length Of Deciding Moving Average |
Source (PineScript)
/*backtest
start: 2023-10-28 00:00:00
end: 2023-11-27 00:00:00
period: 1h
basePeriod: 15m
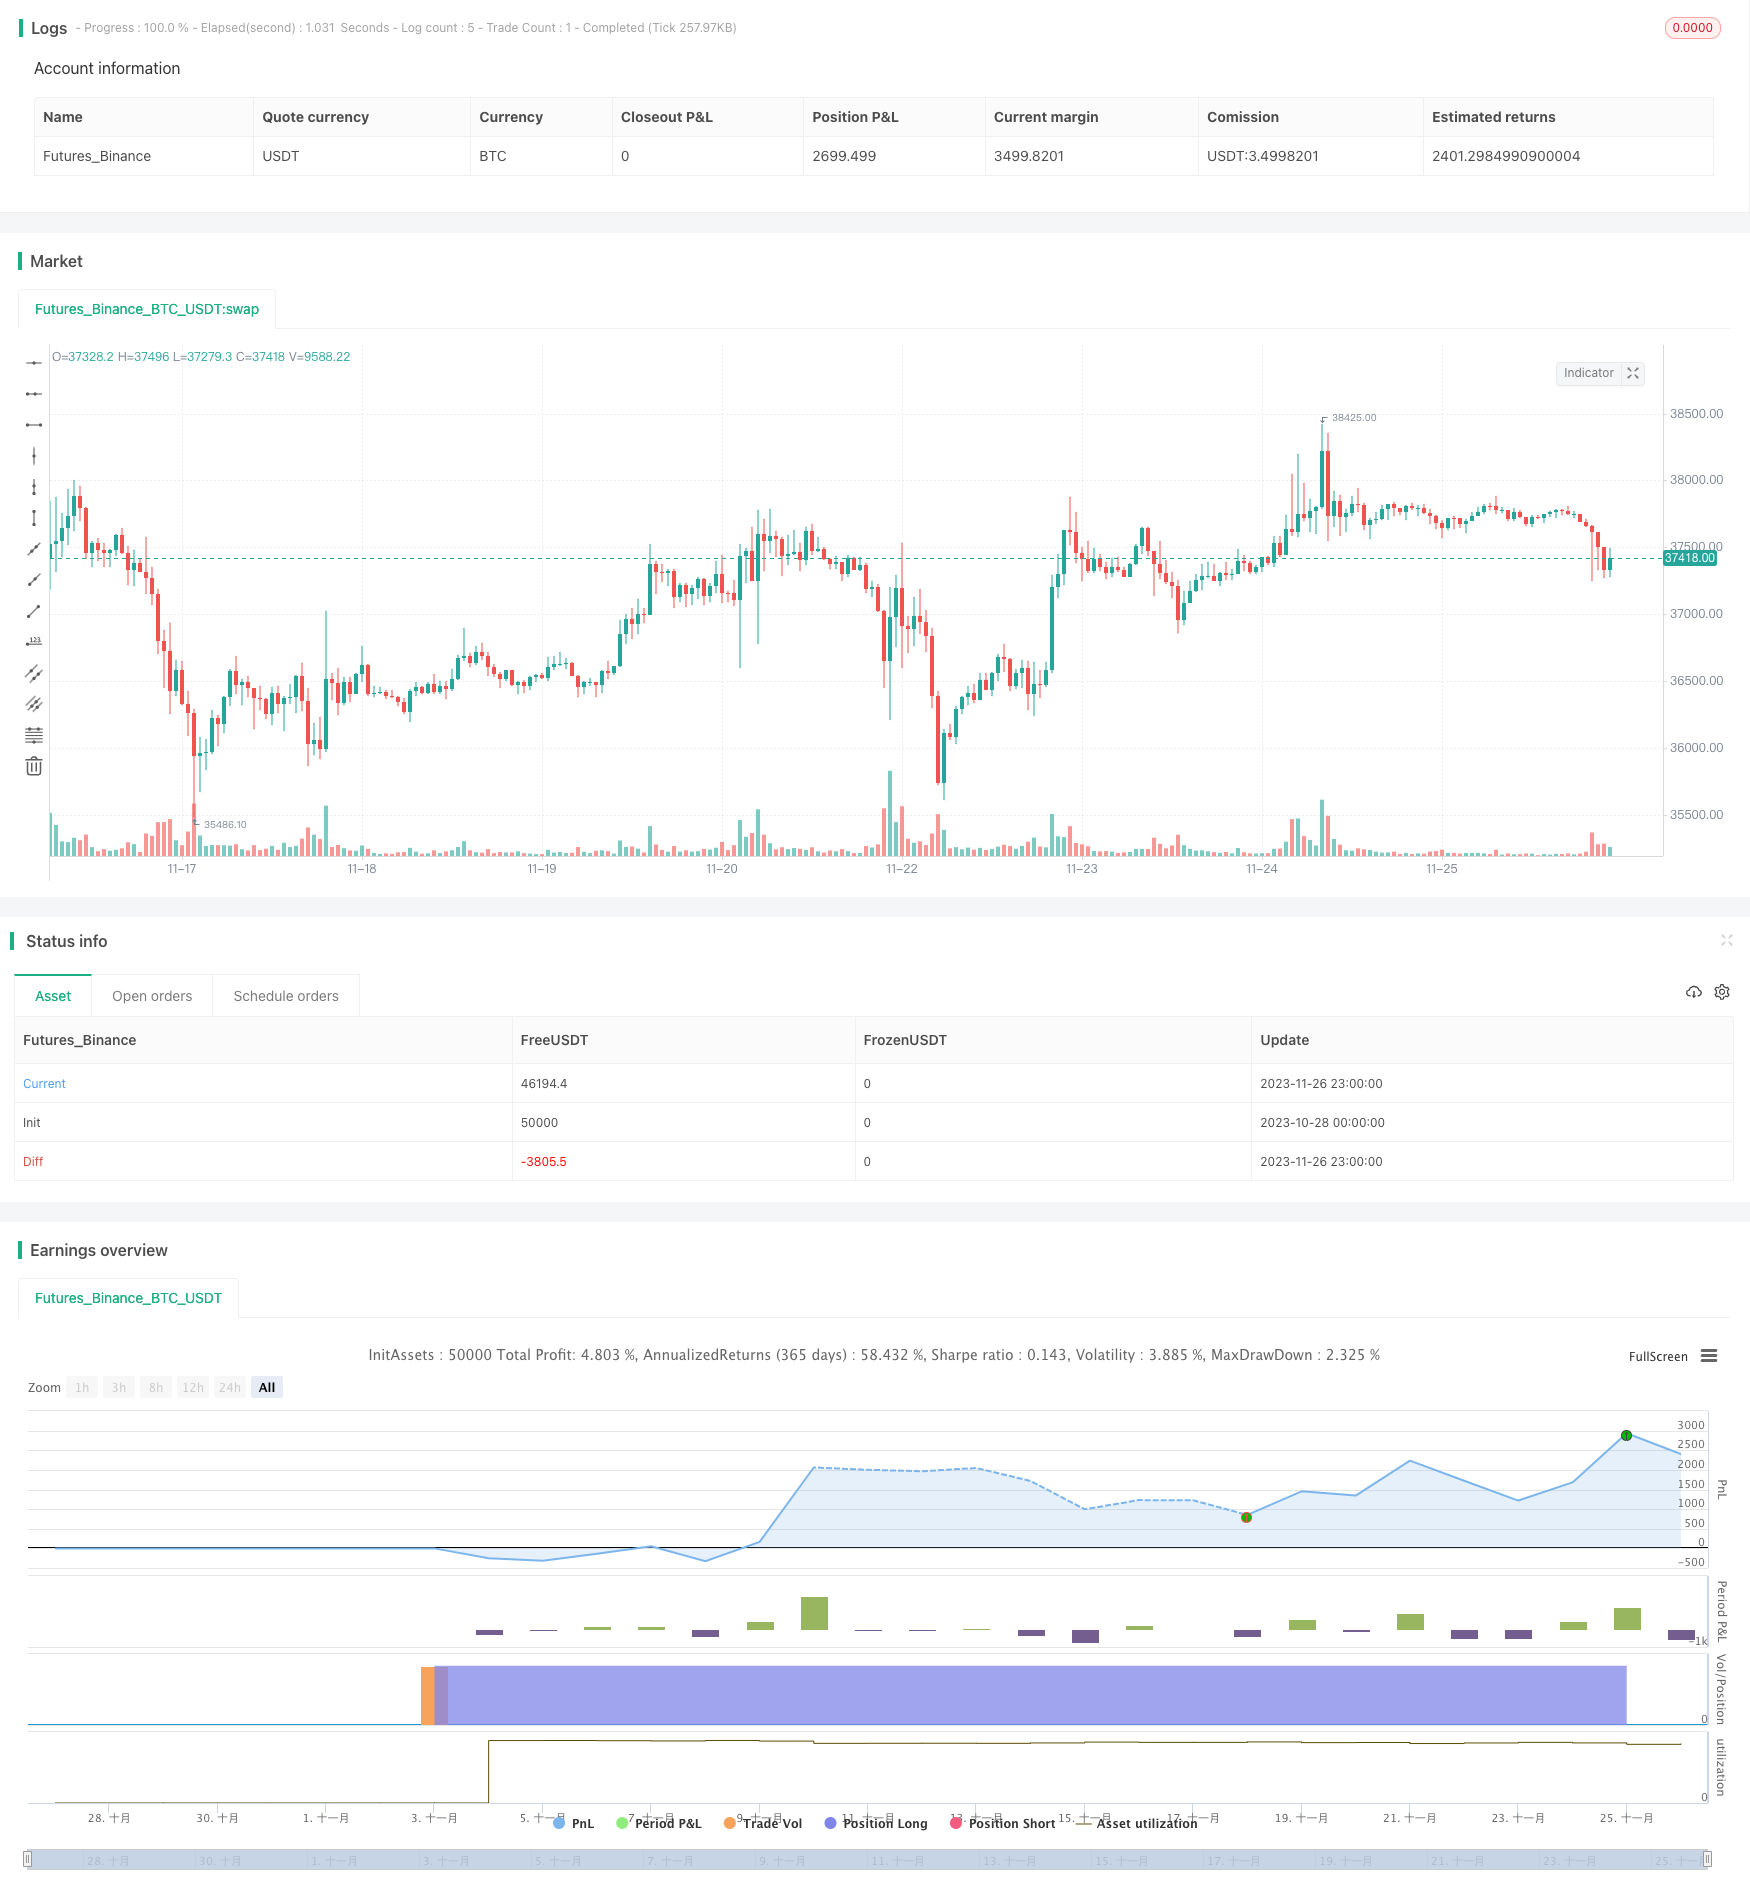
exchanges: [{"eid":"Futures_Binance","currency":"BTC_USDT"}]
*/

// This source code is subject to the terms of the Mozilla Public License 2.0 at https://mozilla.org/MPL/2.0/
// © Sapt_Jash

//@version=5
strategy("SRJ RSI Outperformer Strategy", overlay=true)

srcperiod1 = input.int(100, minval=1, title="Length Of Fast RSI")
srcperiod2 = input.int(40, minval=1, title="Length Of Slow RSI")
srcperiod3 = input.int(21, minval=1, title="Length Of Moving Average")
srcperiod4 = input.int(200, minval=1, title="Length Of Deciding Moving Average")
rsi1 = ta.rsi(close, srcperiod1)
rsi2 = ta.rsi(close, srcperiod2)
divergence1 = (rsi2/rsi1)
divergence2 = (rsi1/divergence1)
ma1 = ta.sma(rsi1, srcperiod3)
ma2 = ta.sma(divergence2, srcperiod3)


//Long Conditions//


longcondition = (ta.crossover(ma2, ma1) and (close > ta.sma(close, srcperiod4)))


//Exit onditions//


exitcondition = (ta.crossunder(ma2, ma1) or (ta.crossunder(close, ta.sma(close, srcperiod4))))


if (longcondition)
    strategy.entry("Long Entry", strategy.long)

if (exitcondition)

    strategy.exit("Long Exit", profit = close * 1.20, loss = close * 0.95)
Detail
https://www.fmz.com/strategy/433521
Last Modified
2023-11-28 11:23:19
