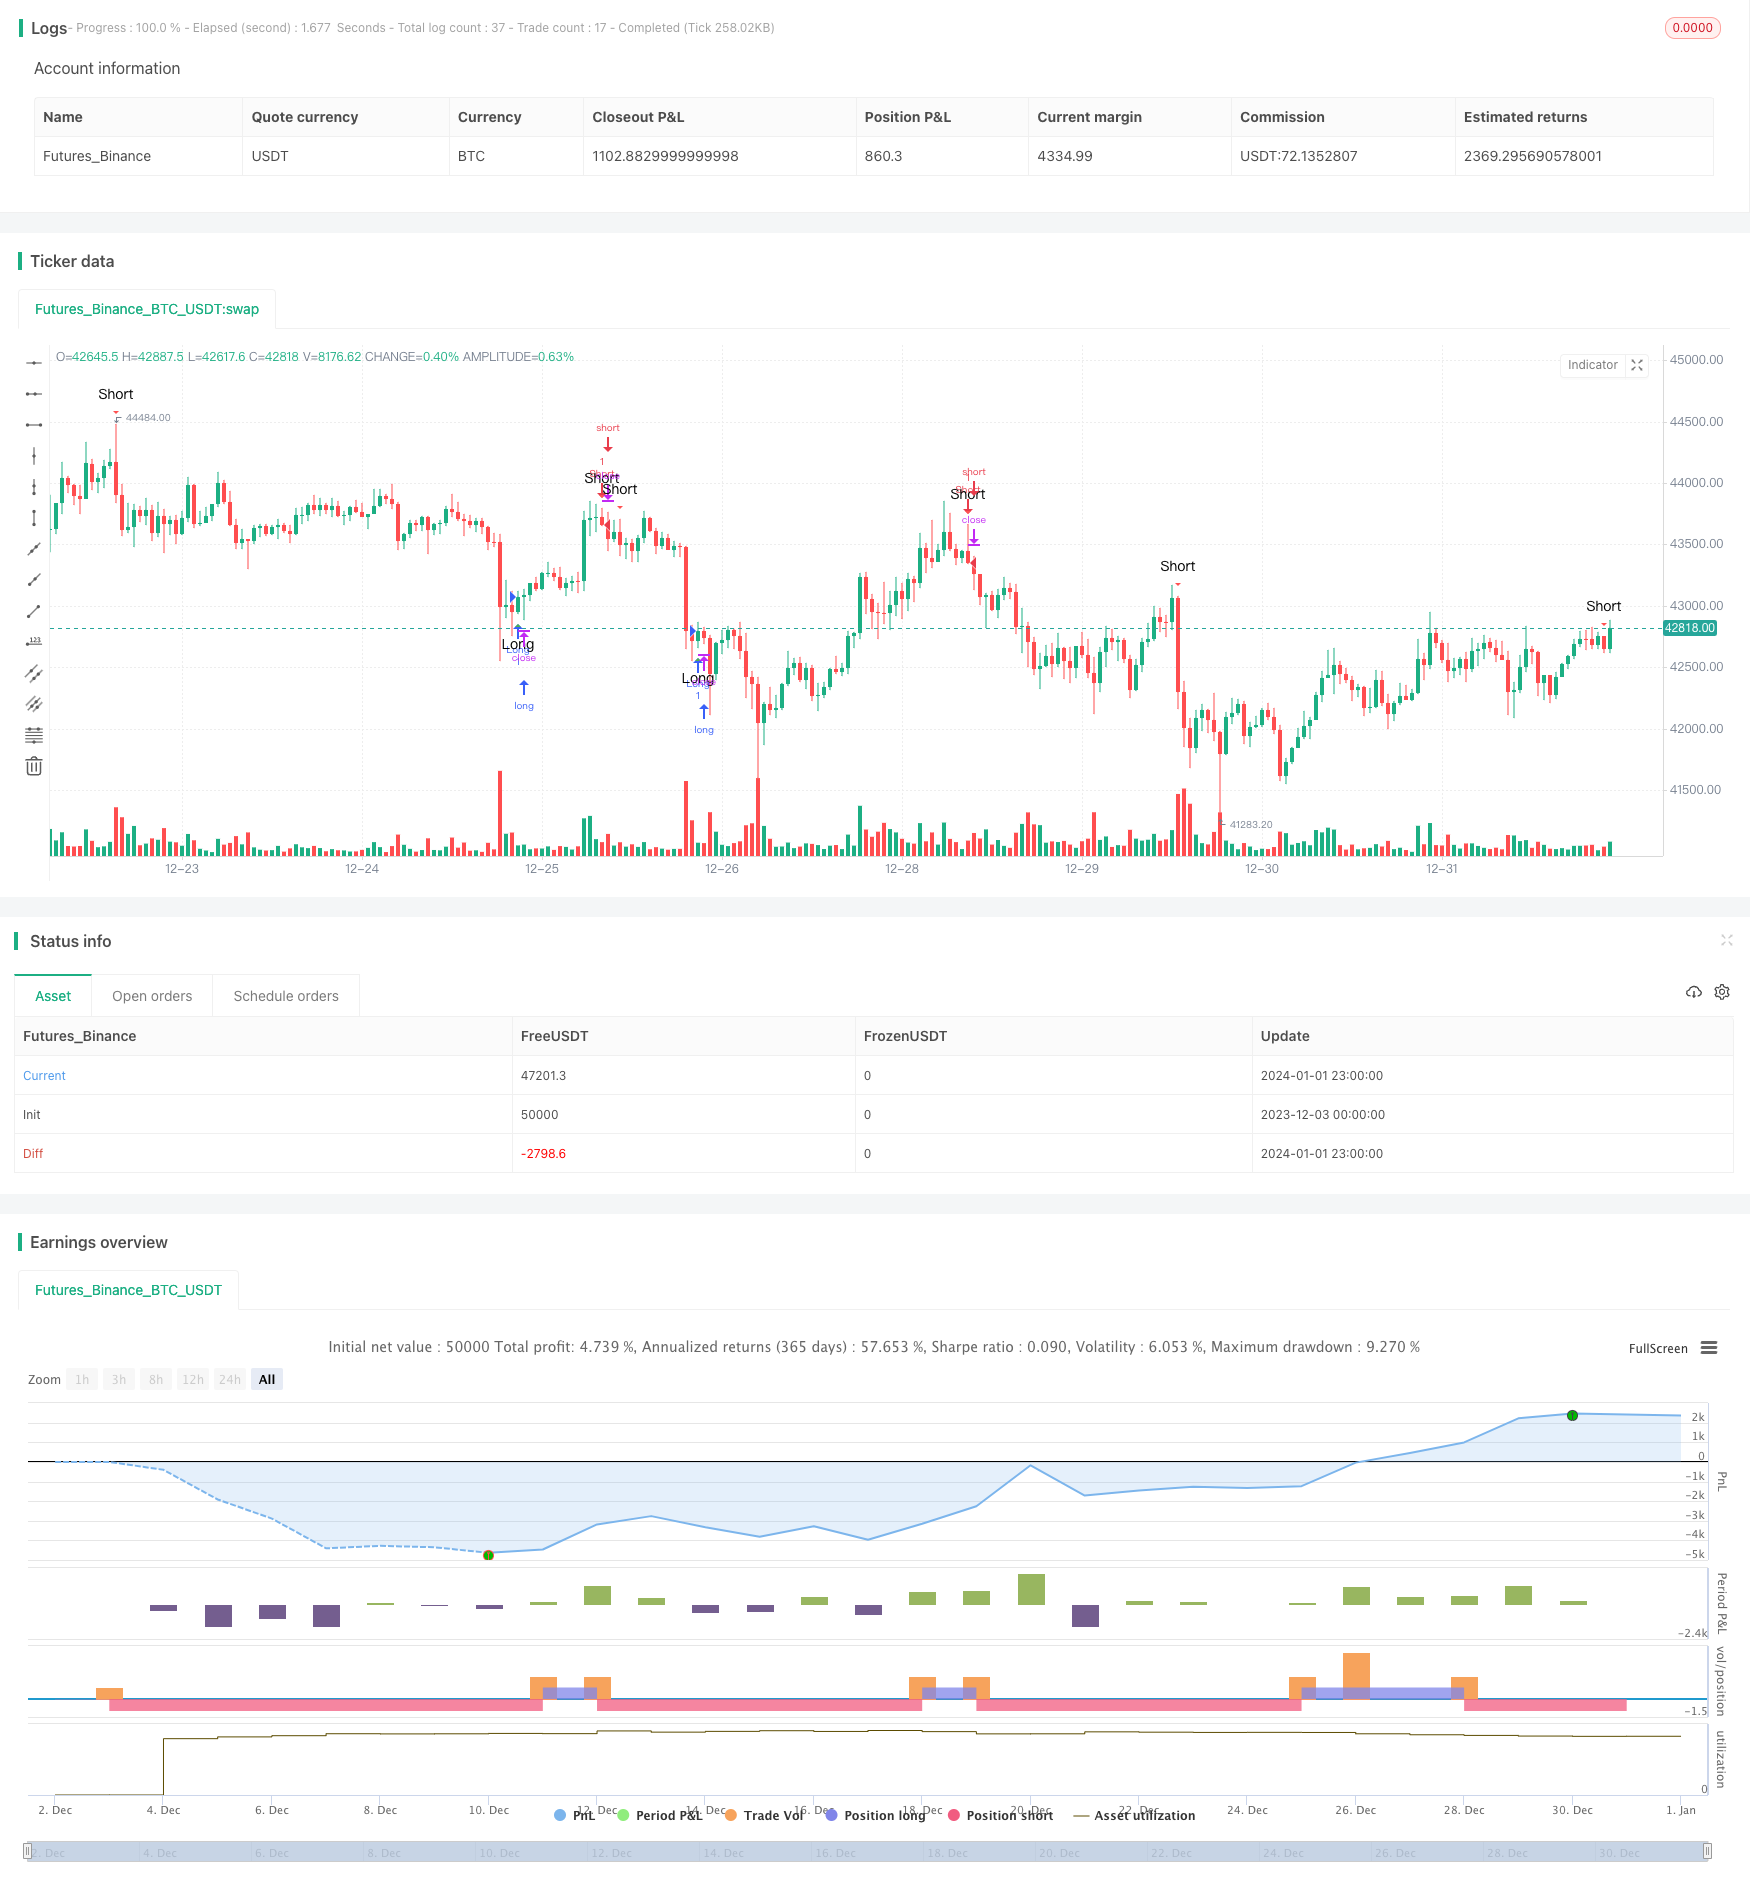
Name
基于RSI指标和包容涨跌形态的量化交易策略Quantitative-Trading-Strategy-Based-on-RSI-Indicator-and-Engulfing-Pattern
Author
ChaoZhang
Strategy Description
本策略的名称为“RSI指标与包容形态量化交易策略”。该策略的主要思路是同时利用RSI指标和包容形态来识别市场趋势,发出买入和卖出信号。
当RSI指标显示多空头极端状态并且出现向上或向下的包容形态时,我们认为是建立仓位的机会。RSI指标可以有效识别超买超卖现象,包容形态则可以进一步验证趋势的可靠性。
首先,我们设置RSI指标的参数,包括RSI的周期长度(一般为9或14)、超买水平(一般为70)和超卖水平(一般为30)。
然后,我们识别包容形态,判断是否出现了向上或向下的大阳线或大阴线包住了前一根K线。这表示目前的趋势正在发生转折。
此后,如果RSI显示超卖区域(超买或超卖),并且出现向上的阳包或向下的阴包,那么就产生买入信号或卖出信号。最后,我们利用RSI金叉和死叉来确定止盈止损。
这种策略结合了趋势指标RSI和特征技术指标包容形态,综合判断市场走势,较单一指标具有更强确认效果,可以有效过滤噪音交易信号。
RSI指标对市场中出现的多头空头状态的判断非常准确和清晰,而包容形态中蕴含的量价特征则可以进一步验证趋势转折的可靠性。
这种策略可以及时抓住超买超卖现象带来的反转机会,同时也避免在盘整时造成不必要的交易亏损。
这种策略最大的风险在于,RSI指标和包容形态出现错误信号的概率并不低。RSI指标容易形成失真,发生背离。而包容形态的识别可以通过调整K线窗口大小等参数进行操纵。
此外,反转信号出现时,不能完全排除震荡盘整的可能性。仓位建立后,市场短期内可能出现回调甚至反转。这都可能导致止损而亏损离场。
为了降低风险,我们要对RSI指标的设置参数进行优化,寻找最佳参数组合。此外选择具有代表性和流动性较好的交易品种也很重要。在仓位建立之后,需要控制好仓位规模并及时止损。
这种策略可以从以下几个方面进行进一步优化:
-
结合更多指标进行组合,例如KDJ、MACD等,形成多指标验证体系,提高信号的准确性。
-
对交易品种的流动性、振幅、交易成本等进行考量,选择最优品种,降低交易成本和滑点风险。
-
利用机器学习等方法对参数进行训练和优化。例如利用深度学习对RSI背离情况进行识别。
-
增加止损策略,通过移动止损、均线止损等方式来保护利润。
本策略利用RSI指标和包容形态的优势,设计出一套同时兼顾趋势判断和特征验证的量化交易体系。这可以有效利用反转机会且具有较强的可靠性。通过持续优化,这套策略可以成为一个稳定可靠的量化策略。
||
The name of this strategy is “RSI and Engulfing Pattern Quantitative Trading Strategy”. The main idea of this strategy is to identify market trends by using both RSI indicator and engulfing patterns to generate buy and sell signals.
When RSI indicator shows extremities and engulfing patterns appear, we believe it is an opportunity to establish positions. RSI indicator can effectively identify overbought and oversold situations, while engulfing patterns can further verify the reliability of trends.
Firstly, we set the parameters for RSI indicator, including the period length of RSI (usually 9 or 14), overbought level (usually 70) and oversold level (usually 30).
Then, we identify engulfing patterns to determine whether a large bullish or bearish candle has engulfed the previous candle. This indicates that the current trend is undergoing a reversal.
After that, if RSI shows overbought or oversold extremities and an bullish engulfing or bearish engulfing appears, buy or sell signals are triggered. Finally, RSI golden cross and death cross are used to determine take profit and stop loss.
This strategy combines the trend indicator RSI and the pattern indicator engulfing patterns to comprehensively judge market trends, which has stronger confirmation effectiveness compared to single indicator strategies, and can filter out noisy trading signals effectively.
RSI indicator judges overbought and oversold states very accurately and clearly, while the price-volume characteristics implied in engulfing patterns can further verify the reliability of trend reversals.
This strategy can timely capture reversal opportunities arising from overbought and oversold extremes, while avoiding unnecessary trading losses during consolidations.
The biggest risk of this strategy is that the probability of RSI indicator and engulfing patterns showing wrong signals is not low. RSI indicator is prone to distortions and divergences. And the identification of engulfing patterns can be manipulated by adjusting parameters like candlestick chart window size.
In addition, the possibility of oscillation and consolidation cannot be completely ruled out when reversal signals appear. The market may have pullbacks or even reversals in the short term after positions are established. These can all lead to stop loss and losses.
In order to reduce risks, we need to optimize the parameter settings of RSI indicator to find the best parameter combination. In addition, selecting trading instruments with strong representation and liquidity is also very important. After establishing positions, we need to properly control position sizing and set timely stop loss.
This strategy can be further optimized in the following aspects:
-
Incorporate more indicators such as KDJ and MACD to form a multi-indicator verification system to improve signal accuracy.
-
Consider factors like liquidity, volatility and transaction cost of trading instruments, and select the optimal ones to reduce trading cost and slippage risks.
-
Use machine learning methods to train and optimize parameters. For example, use deep learning to identify RSI divergences.
-
Add stop loss strategies, and protect profits through moving stop loss, MA stop loss etc.
This strategy utilizes the strengths of RSI indicator and engulfing patterns, and designs a quantitative trading system that takes into account both trend judgment and feature verification. It can effectively capture reversal opportunities while having high reliability. Through continuous optimization, this strategy can become a stable and reliable quantitative strategy.
[/trans]
Strategy Arguments
| Argument | Default | Description |
|---|---|---|
| v_input_1_close | 0 | RSI Source: close |
| v_input_2 | 9 | RSI Length |
| v_input_3 | 60 | RSI Overbought Level |
| v_input_4 | 25 | RSI Oversold Level |
Source (PineScript)
/*backtest
start: 2023-12-03 00:00:00
end: 2024-01-02 00:00:00
period: 1h
basePeriod: 15m
exchanges: [{"eid":"Futures_Binance","currency":"BTC_USDT"}]
*/

//@version=4
strategy(title="Lesson 6", shorttitle="RSI Swing Signals", overlay=true)

// Get user input
rsiSource = input(title="RSI Source", type=input.source, defval=close)
rsiLength = input(title="RSI Length", type=input.integer, defval=9)
rsiOverbought = input(title="RSI Overbought Level", type=input.integer, defval=60)
rsiOversold = input(title="RSI Oversold Level", type=input.integer, defval=25)

// Get RSI value
rsiValue = rsi(rsiSource, rsiLength)
rsiOB = rsiValue >= rsiOverbought
rsiOS = rsiValue <= rsiOversold

// Identify engulfing candles
bullishEC = close > open[1] and close[1] < open[1]
bearishEC = close < open[1] and close[1] > open[1]

// Define entry and exit conditions
longCondition = (rsiOS or rsiOS[1]) and bullishEC
shortCondition = (rsiOB or rsiOB[1]) and bearishEC

// Plot signals to chart
plotshape(longCondition, title="Long", location=location.belowbar, color=color.green, transp=0, style=shape.triangleup, text="Long")
plotshape(shortCondition, title="Short", location=location.abovebar, color=color.red, transp=0, style=shape.triangledown, text="Short")

// Strategy entry and exit
strategy.entry("Long", strategy.long, when=longCondition)
strategy.entry("Short", strategy.short, when=shortCondition)

// Define exit conditions
longExitCondition = crossover(rsiValue, 60) // You can customize this exit condition
shortExitCondition = crossunder(rsiValue, 40) // You can customize this exit condition

// Strategy exit
strategy.exit("ExitLong", from_entry="Long", when=longExitCondition)
strategy.exit("ExitShort", from_entry="Short", when=shortExitCondition)

// Send out an alert if this candle meets our conditions
alertcondition(longCondition or shortCondition, title="RSI Trade Alert!", message="RSI Swing Signal for XXX")
Detail
https://www.fmz.com/strategy/437488
Last Modified
2024-01-03 11:24:08
