Name
基于RSI指标的短线交易策略RSI-Indicator-Based-Short-term-Trading-Strategy
Author
ChaoZhang
Strategy Description
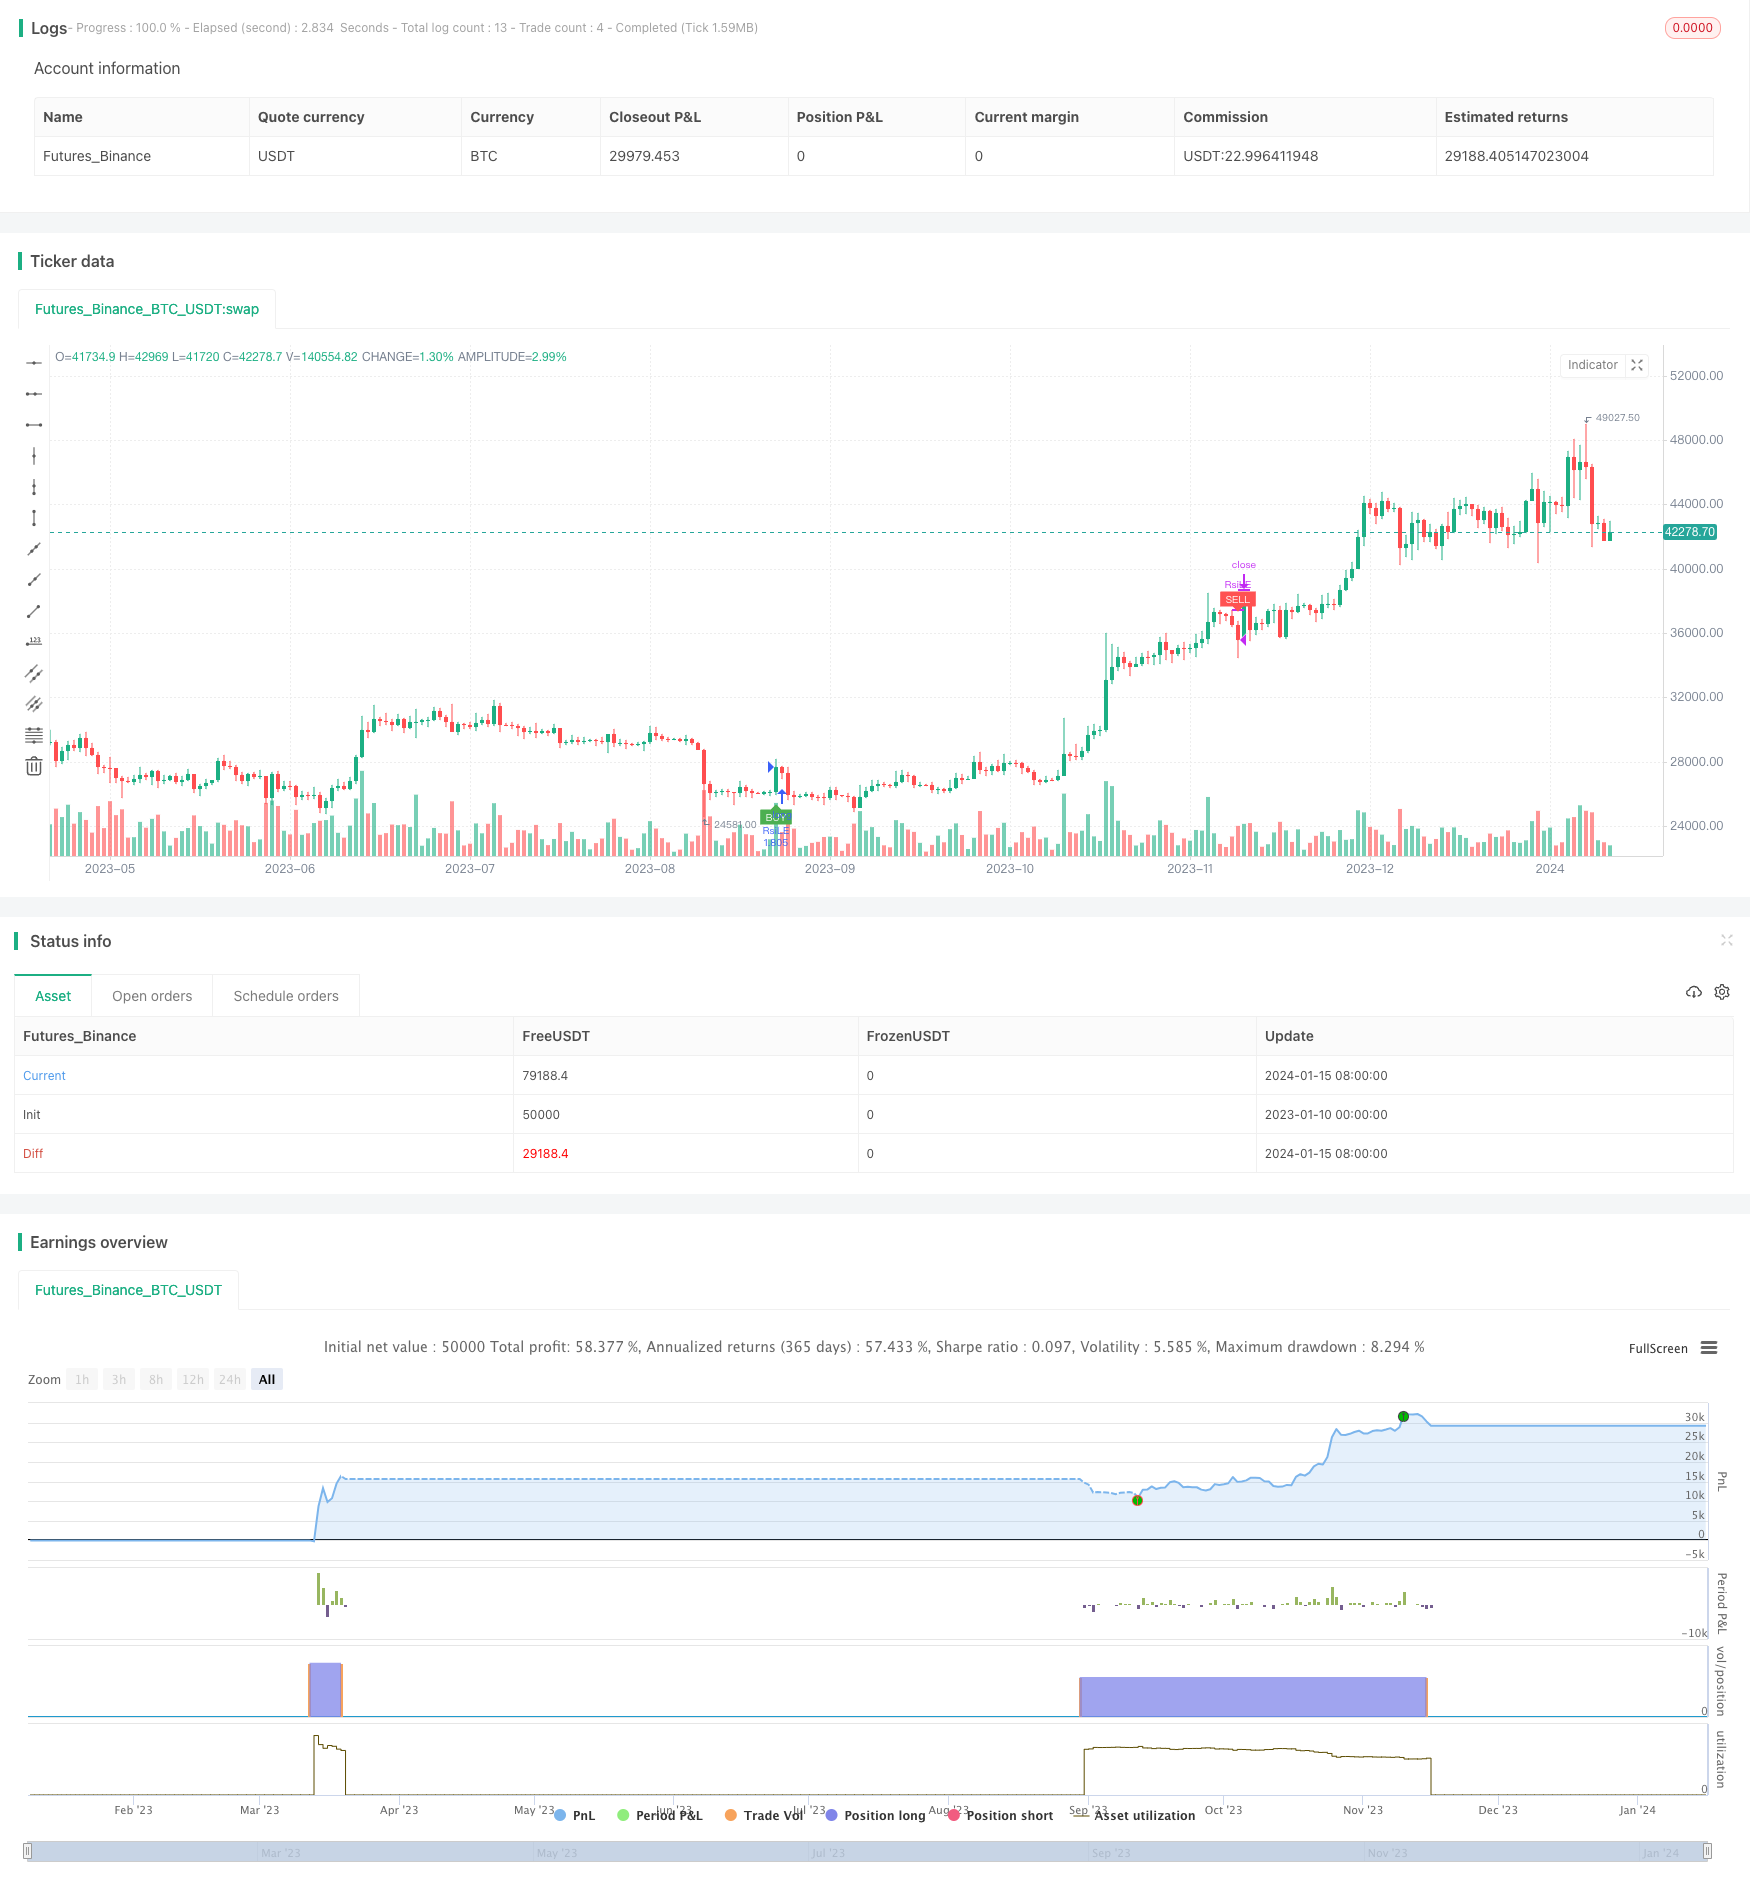
本策略基于相对强弱指数(RSI)指标设计了一个短线交易策略,主要用于15分钟时间框架下的交易。该策略通过计算RSI指标判断市场是否超买超卖,发出买入和卖出信号。当RSI指标上穿过低点30时产生买入信号,而当RSI指标下穿高点70时产生卖出信号。本策略适用于短线范围交易,可以捕捉中间的波动获利。
RSI指标是通过计算一定时间周期内价格涨跌幅度的比值,来判断市场是否超买或超卖的技术分析工具。RSI指标数值范围在0到100之间。数值在30以下表明资产被超卖现象,数值在70以上表明资产被超买现象。
本策略设置RSI指标参数为14周期,超买线为70,超卖线为30。当RSI从下方上穿30时产生买入信号,这意味着市场由超卖转为多头;当RSI从上方下穿70时产生卖出信号,这意味着市场由多头转为空头。策略收到信号后,以整个账户资金的1倍杠杆定向做多或做空,实现短线交易获利。
本策略最大的优势是规则简单清晰,容易理解和实现。相对强弱指数是一种很经典的量化指标,被广泛运用于判断市场的超买超卖现象。策略本身不需要预测市场未来走势和价格目标,只需要跟随RSI指标信号即可,降低了策略优化难度。
另一个优势是策略适应性强。本策略可应用在任何品种和任何时间框架,特别适合中短线捕捉区间震荡。此外,策略只需优化三个参数:RSI周期、超买线、超卖线,参数空间小,易于测试和优化找到最佳参数组合。
本策略最大的风险在于持仓时间不确定。当市场出现长时间的超买或超卖时,会导致策略持仓时间过长而承受更大的亏损。此时需要及时止损来控制风险。
另一个风险是交易频率可能过高。当市场在RSI超买超卖线附近上下波动时,会频繁触发买入卖出信号,增加交易费用和滑点成本。这需要适当调整参数,扩大超买超卖区间距离来减少无谓交易。
本策略可以从以下几个方面进行优化:
-
优化RSI参数,调整周期参数以及超买超卖线位置,找到最佳参数组合
-
增加止损止盈策略,设定合理的止损位和止盈位
-
增加过滤条件,避免无谓交易。例如设置最小波动幅度、交易量过滤等
-
优化资金利用率,设置动态仓位控制
-
结合其他指标进行组合,提高策略稳定性
本策略基于RSI指标设计了一个简单实用的短线交易策略。策略信号规则清晰,易于实现,资金利用率高,适合中短线捕捉市场的超买超卖现象进行否极性交易。通过持续的测试与优化,本策略可以成为一个非常稳定可靠的量化交易系统。
||
This strategy designs a short-term trading strategy based on the Relative Strength Index (RSI) indicator, mainly for trading in the 15-minute timeframe. The strategy generates buy and sell signals by calculating the RSI indicator to judge whether the market is overbought or oversold. It generates a buy signal when the RSI indicator crosses above the lower point of 30, and generates a sell signal when the RSI indicator crosses below the upper point of 70. This strategy is suitable for short-term range trading to capture profits from intermediate fluctuations.
The RSI indicator is a technical analysis tool that calculates the ratio of price uptrends and downtrends over a certain time period to determine whether the market is overbought or oversold. The RSI indicator value ranges from 0 to 100. A value below 30 indicates the asset is oversold, and a value above 70 indicates the asset is overbought.
This strategy sets the RSI indicator parameters to 14 periods, the overbought line to 70, and the oversold line to 30. When the RSI crosses above 30 from below, a buy signal is generated, which means the market turns from oversold to bullish. When the RSI crosses below 70 from above, a sell signal is generated, which means the market turns from bullish to bearish. After receiving the signal, the strategy takes a directional long or short position with 1x leverage of the total account funds to make profits from short-term trading.
The biggest advantage of this strategy is that the rules are simple and clear, easy to understand and implement. The Relative Strength Index is a very classic quantitative indicator, widely used to judge the overbought and oversold conditions of the market. The strategy itself does not need to predict future market trends and price targets, just follow the RSI indicator signals, which reduces the difficulty of strategy optimization.
Another advantage is that the strategy has strong adaptability. This strategy can be applied to any variety and timeframe, especially suitable for catching range oscillation in medium and short term. In addition, the strategy only needs to optimize three parameters: RSI period, overbought line and oversold line. The parameter space is small, which makes it easy to test and optimize to find the best parameter combination.
The biggest risk of this strategy is that the holding time is uncertain. When the market experiences prolonged overbought or oversold conditions, it will lead to excessively long holding periods of the strategy positions and greater losses. At this point, timely stop loss is needed to control risks.
Another risk is that the trading frequency may be too high. When the market fluctuates up and down around the RSI overbought and oversold lines, it will frequently trigger buy and sell signals, increasing transaction fees and slippage costs. This requires appropriate adjustments to parameters to widen the overbought and oversold interval distance to reduce unnecessary trading.
This strategy can be optimized in the following aspects:
-
Optimize RSI parameters to find the best combination of period parameters and overbought/oversold line positions.
-
Add stop loss/take profit strategies with reasonable stop loss price and take profit price.
-
Add filtering conditions to avoid unnecessary trading, e.g. minimum fluctuation range, trading volume filters.
-
Optimize capital utilization by setting dynamic position sizing.
-
Combine with other indicators to improve strategy stability.
This strategy designs a simple and practical short-term trading strategy based on the RSI indicator. The strategy signal rules are clear and easy to implement with high capital utilization. It is suitable for catching market overbought/oversold conditions for contrarian trading in medium and short term. Through continuous testing and optimization, this strategy can become a very stable and reliable quantitative trading system.
[/trans]
Strategy Arguments
| Argument | Default | Description |
|---|---|---|
| v_input_1 | 14 | length |
| v_input_2 | 30 | overSold |
| v_input_3 | 70 | overBought |
| v_input_4 | 10 | Stop Loss % |
| v_input_5 | true | Take Profit % |
Source (PineScript)
/*backtest
start: 2023-01-10 00:00:00
end: 2024-01-16 00:00:00
period: 1d
basePeriod: 1h
exchanges: [{"eid":"Futures_Binance","currency":"BTC_USDT"}]
*/

//@version=4
strategy("RSI Strategy", overlay=true)
length = input( 14 )
overSold = input( 30 )
overBought = input( 70 )
sl_inp = input(10.0, title='Stop Loss %')/100
tp_inp = input(1.0, title='Take Profit %')/100

haOpen = 0.0
haOpen := haOpen[1]

st_level = strategy.position_avg_price * (1 - sl_inp)
take_level = strategy.position_avg_price * (1 + tp_inp)
price = close
vrsi = rsi(price, length)
co = crossover(vrsi, overSold)
cu = crossunder(vrsi, overBought)
strategy.initial_capital =50000
orderSize = ((strategy.initial_capital * 1) / close)
if (not na(vrsi))
	if (co)
		strategy.order("RsiLE", strategy.long, orderSize, take_level, st_level, comment="RsiLE")
	if (cu)
		strategy.close("RsiLE")//strategy.entry("RsiSE", strategy.short, qty=orderSize, comment="RsiSE")

plotshape(not na(vrsi) and co and haOpen == 0.0, style=shape.labelup, location=location.belowbar, color=color.green, size=size.tiny, title="buy label", text="BUY", textcolor=color.white)
plotshape(not na(vrsi) and co and haOpen == 1.0, style=shape.labelup, location=location.belowbar, color=color.orange, size=size.tiny, title="buy label", text="INC", textcolor=color.white)
plotshape(not na(vrsi) and cu and haOpen == 1.0, style=shape.labeldown, location=location.abovebar, color=color.red, size=size.tiny, title="sell label", text="SELL", textcolor=color.white)

if (not na(vrsi))
	if (co)
	    haOpen := 1.0
	if (cu)
	    haOpen := 0.0
//strategy.exit("Stop Loss/TP","RsiLE", stop=stop_level, limit=take_level)
//plot(strategy.equity, title="equity", color=color.red, linewidth=2, style=plot.style_areabr)
Detail
https://www.fmz.com/strategy/439049
Last Modified
2024-01-17 11:49:15
