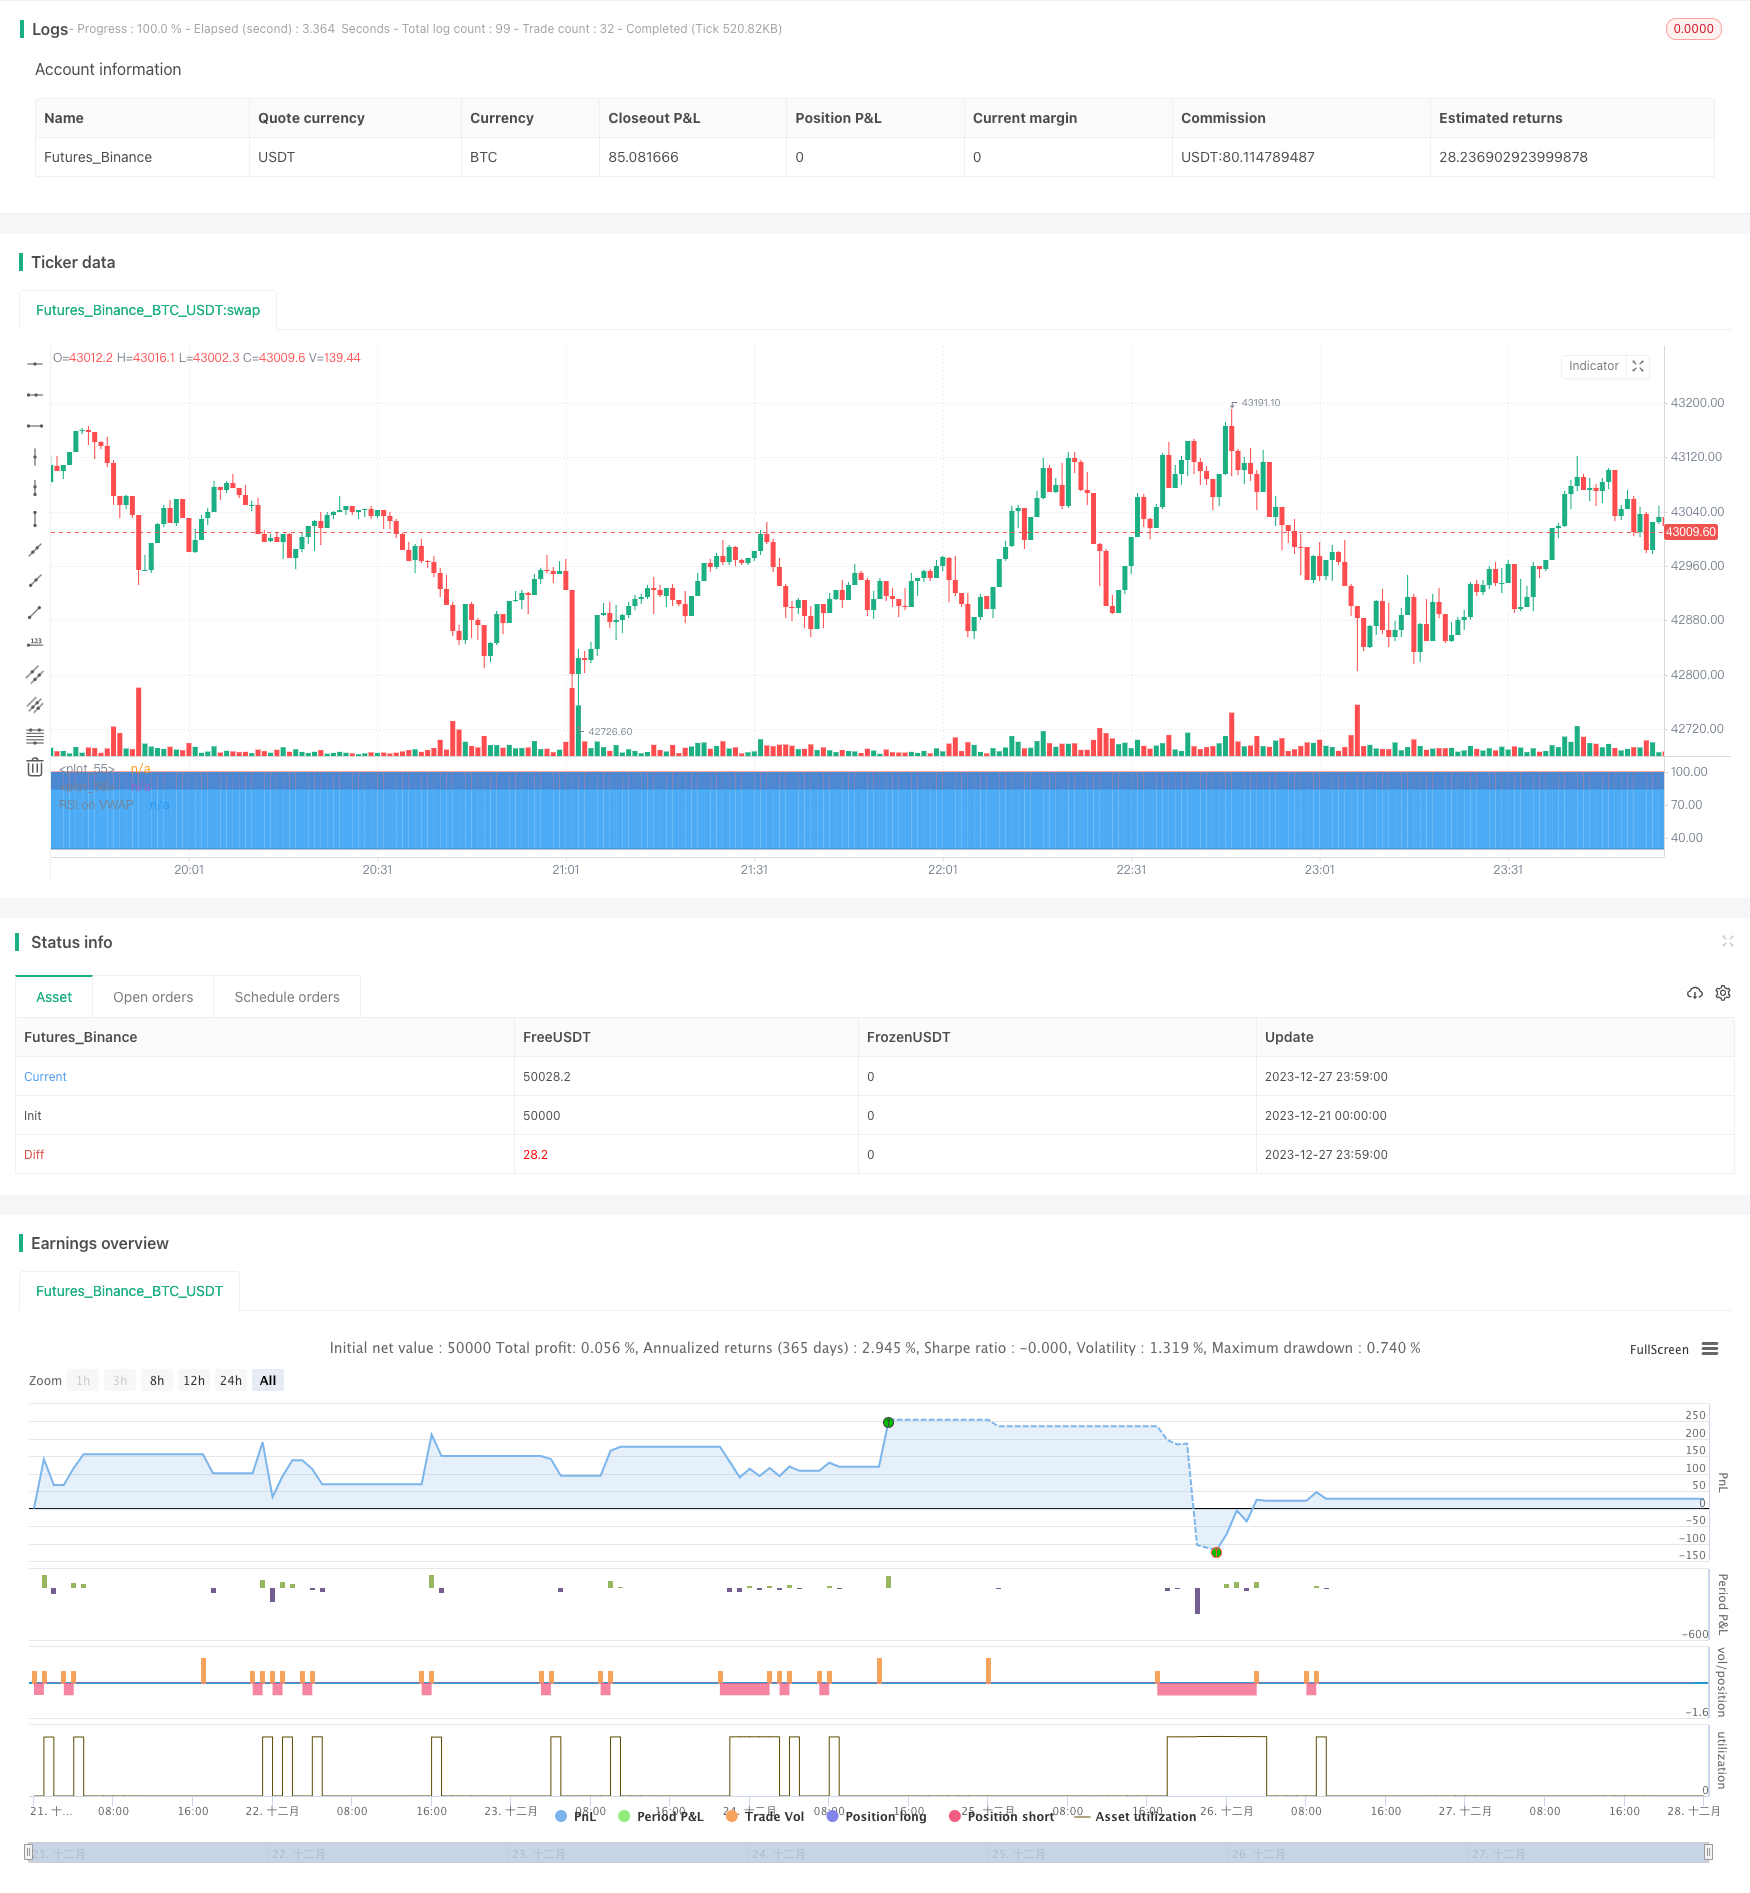
Name
基于RSI指标的跨时间框架策略VWAP-RSI-Oversold-Crossunder-BTC-Short-Strategy
Author
ChaoZhang
Strategy Description
本策略为基于RSI指标的跨时间框架BTC做空策略。该策略通过计算每笔K线的成交量加权平均价(VWAP)得到一个VWAP曲线,再对该曲线应用RSI指标。当RSI指标出现从超买区向下穿越的死叉信号时,做空BTC。
- 计算每根K线的成交量加权平均价(VWAP),得到一条VWAP曲线
- 对VWAP曲线应用RSI指标,参数为20日,超买线为85,超卖线为30
- 当RSI指标从超买区(85)向下穿越超卖区(30)时,开仓做空
- 持仓28根K线后,如果RSI指标再次上穿超卖线(30),平仓
- 使用VWAP而不是简单的收盘价,更能反映真实交易价格
- 应用RSI指标识别超买超卖状态,避免追高杀跌
- 跨时间框架操作,避免被套
- 风险可控,28根K线止损
- 突发事件导致价格急速上涨,无法止损
- 采用跨时间框架,降低被套风险
- 参数设置不当,容易错过机会
- 对RSI参数和超买超卖线进行测试和优化
- K线无法穿越进入超卖区
- 结合其他指标判断趋势,灵活调整参数
- 测试更多参数组合,找到最佳参数
- 结合MACD,KD等其他指标判断是否进入超买超卖区
- 根据不同品种分别测试参数设置
- 优化止损机制,根据波动率设置止损幅度
本策略通过VWAP和RSI的结合识别BTC的超买超卖状态,以跨时间框架的方式进行操作,能够有效控制风险。策略思路清晰易懂,值得进一步测试优化,应用于实盘交易。
||
This is a BTC short strategy across timeframes based on the RSI indicator of VWAP. It calculates the Volume Weighted Average Price (VWAP) of each candlestick to get a VWAP curve, and then applies the RSI indicator to the curve. When the RSI indicator crosses down from the overbought zone, it goes short on BTC.
- Calculate VWAP of each candlestick to get a VWAP curve
- Apply RSI indicator to VWAP curve, with length of 20 days, overbought level at 85 and oversold level at 30
- When RSI crosses down from overbought zone (85) to oversold zone (30), open short position
- Close position after holding for 28 candlesticks, or if RSI crosses oversold line (30) again
- Use VWAP instead of simple close price to reflect actual trading price
- Identify overbought/oversold status with RSI to avoid buying high and selling low
- Trade across timeframes to avoid being trapped
- Controllable risk with 28 candlesticks stop loss
- Price surges rapidly due to black swan events, unable to stop loss
- Adopt across timeframes trading to reduce risks of being trapped
- Inappropriate parameter settings, easily miss opportunities
- Test and optimize RSI parameters and overbought/oversold levels
- RSI unable to cross into oversold zone
- Combine with other indicators to determine trend, adjust parameters flexibly
- Test more parameter combinations to find optimum
- Combine with MACD, KD etc to judge overbought/oversold status
- Test parameter settings separately for different assets
- Optimize stop loss mechanism, set stop loss range based on volatility
This strategy identifies BTC overbought/oversold status with the combination of VWAP and RSI. By trading across timeframes, it can effectively control risks. The strategy logic is clear and easy to understand, worth further testing and optimizing for live trading.
[/trans]
Strategy Arguments
| Argument | Default | Description |
|---|---|---|
| v_input_1 | Resolution | |
| v_input_2 | 20 | RSI Length |
| v_input_3 | 30 | RSI Oversold level |
| v_input_4 | 85 | RSI Overbought level |
| v_input_5 | 28 | Number of candles |
| v_input_6 | true | Enter longs ? |
| v_input_7 | true | Enter shorts ? |
| v_input_8 | 2020 | Strategy Start Year |
| v_input_9 | true | Strategy Start Month |
| v_input_10 | true | Strategy Start Day |
| v_input_11 | false | Use Laguerre on RSI ? |
| v_input_12 | 0.06 | Laguerre Gamma |
Source (PineScript)
/*backtest
start: 2023-12-21 00:00:00
end: 2023-12-28 00:00:00
period: 1m
basePeriod: 1m
exchanges: [{"eid":"Futures_Binance","currency":"BTC_USDT"}]
*/


//@version=4

strategy("Soran Strategy 2 - SHORT SIGNALS", pyramiding=1, initial_capital=1000, default_qty_type=strategy.percent_of_equity, default_qty_value=50, overlay=false)


// ----------------- Inputs ----------------- //

reso = input(title="Resolution", type=input.resolution, defval="")
length = input(20, title="RSI Length", type=input.integer)
ovrsld = input(30, "RSI Oversold level", type=input.float)
ovrbgt = input(85, "RSI Overbought level", type=input.float)
lateleave = input(28, "Number of candles", type=input.integer)
// lateleave : numbers of bars in overbought/oversold zones where the position is closed. The position is closed when this number is reached or when the zone is left (the first condition).

// best parameters BTCUSDTPERP M15 : 20 / 30 / 85 / 28


stratbull = input(title="Enter longs ?", type = input.bool, defval=true)
stratbear = input(title="Enter shorts ?", type = input.bool, defval=true)

stratyear = input(2020, title = "Strategy Start Year")
stratmonth = input(1, title = "Strategy Start Month")
stratday = input(1, title = "Strategy Start Day")
stratstart = timestamp(stratyear,stratmonth,stratday,0,0)


// --------------- Laguerre ----------------- //

laguerre = input(title="Use Laguerre on RSI ?", type=input.bool, defval=false)
gamma = input(0.06, title="Laguerre Gamma")

laguerre_cal(s,g) =>
    l0 = 0.0
    l1 = 0.0
    l2 = 0.0
    l3 = 0.0
    l0 := (1 - g)*s+g*nz(l0[1])
    l1 := -g*l0+nz(l0[1])+g*nz(l1[1])
    l2 := -g*l1+nz(l1[1])+g*nz(l2[1])
    l3 := -g*l2+nz(l2[1])+g*nz(l3[1])
    (l0 + 2*l1 + 2*l2 + l3)/6


// ---------------- Rsi VWAP ---------------- //

rsiV = security(syminfo.tickerid, reso, rsi(vwap(close), length))

rsiVWAP = laguerre ? laguerre_cal(rsiV,gamma) : rsiV


// ------------------ Plots ----------------- //

prsi = plot(rsiVWAP, color = rsiVWAP>ovrbgt ? color.red : rsiVWAP<ovrsld ? color.green : color.white, title="RSI on VWAP", linewidth=1, style=plot.style_line)
hline = plot(ovrbgt, color = color.gray, style=plot.style_line)
lline = plot(ovrsld, color = color.gray, style=plot.style_line)
fill(prsi,hline, color = rsiVWAP > ovrbgt ? color.red : na, transp = 30)
fill(prsi,lline, color = rsiVWAP < ovrsld ? color.green : na, transp = 30)


// ---------------- Positions: only shows the Short and close shoret positions --------------- //

timebull = stratbull and time > stratstart
timebear = stratbear and time > stratstart


strategy.entry("Short", false, when = timebear and crossunder(rsiVWAP, ovrbgt), comment="")
strategy.close("Short", when = timebear and crossunder(rsiVWAP, ovrsld)[lateleave] or crossover(rsiVWAP, ovrsld), comment="")
Detail
https://www.fmz.com/strategy/437003
Last Modified
2023-12-29 14:12:54
