Name
基于RSI的量化交易策略RSI-Based-Quantitative-Trading-Strategy
Author
ChaoZhang
Strategy Description
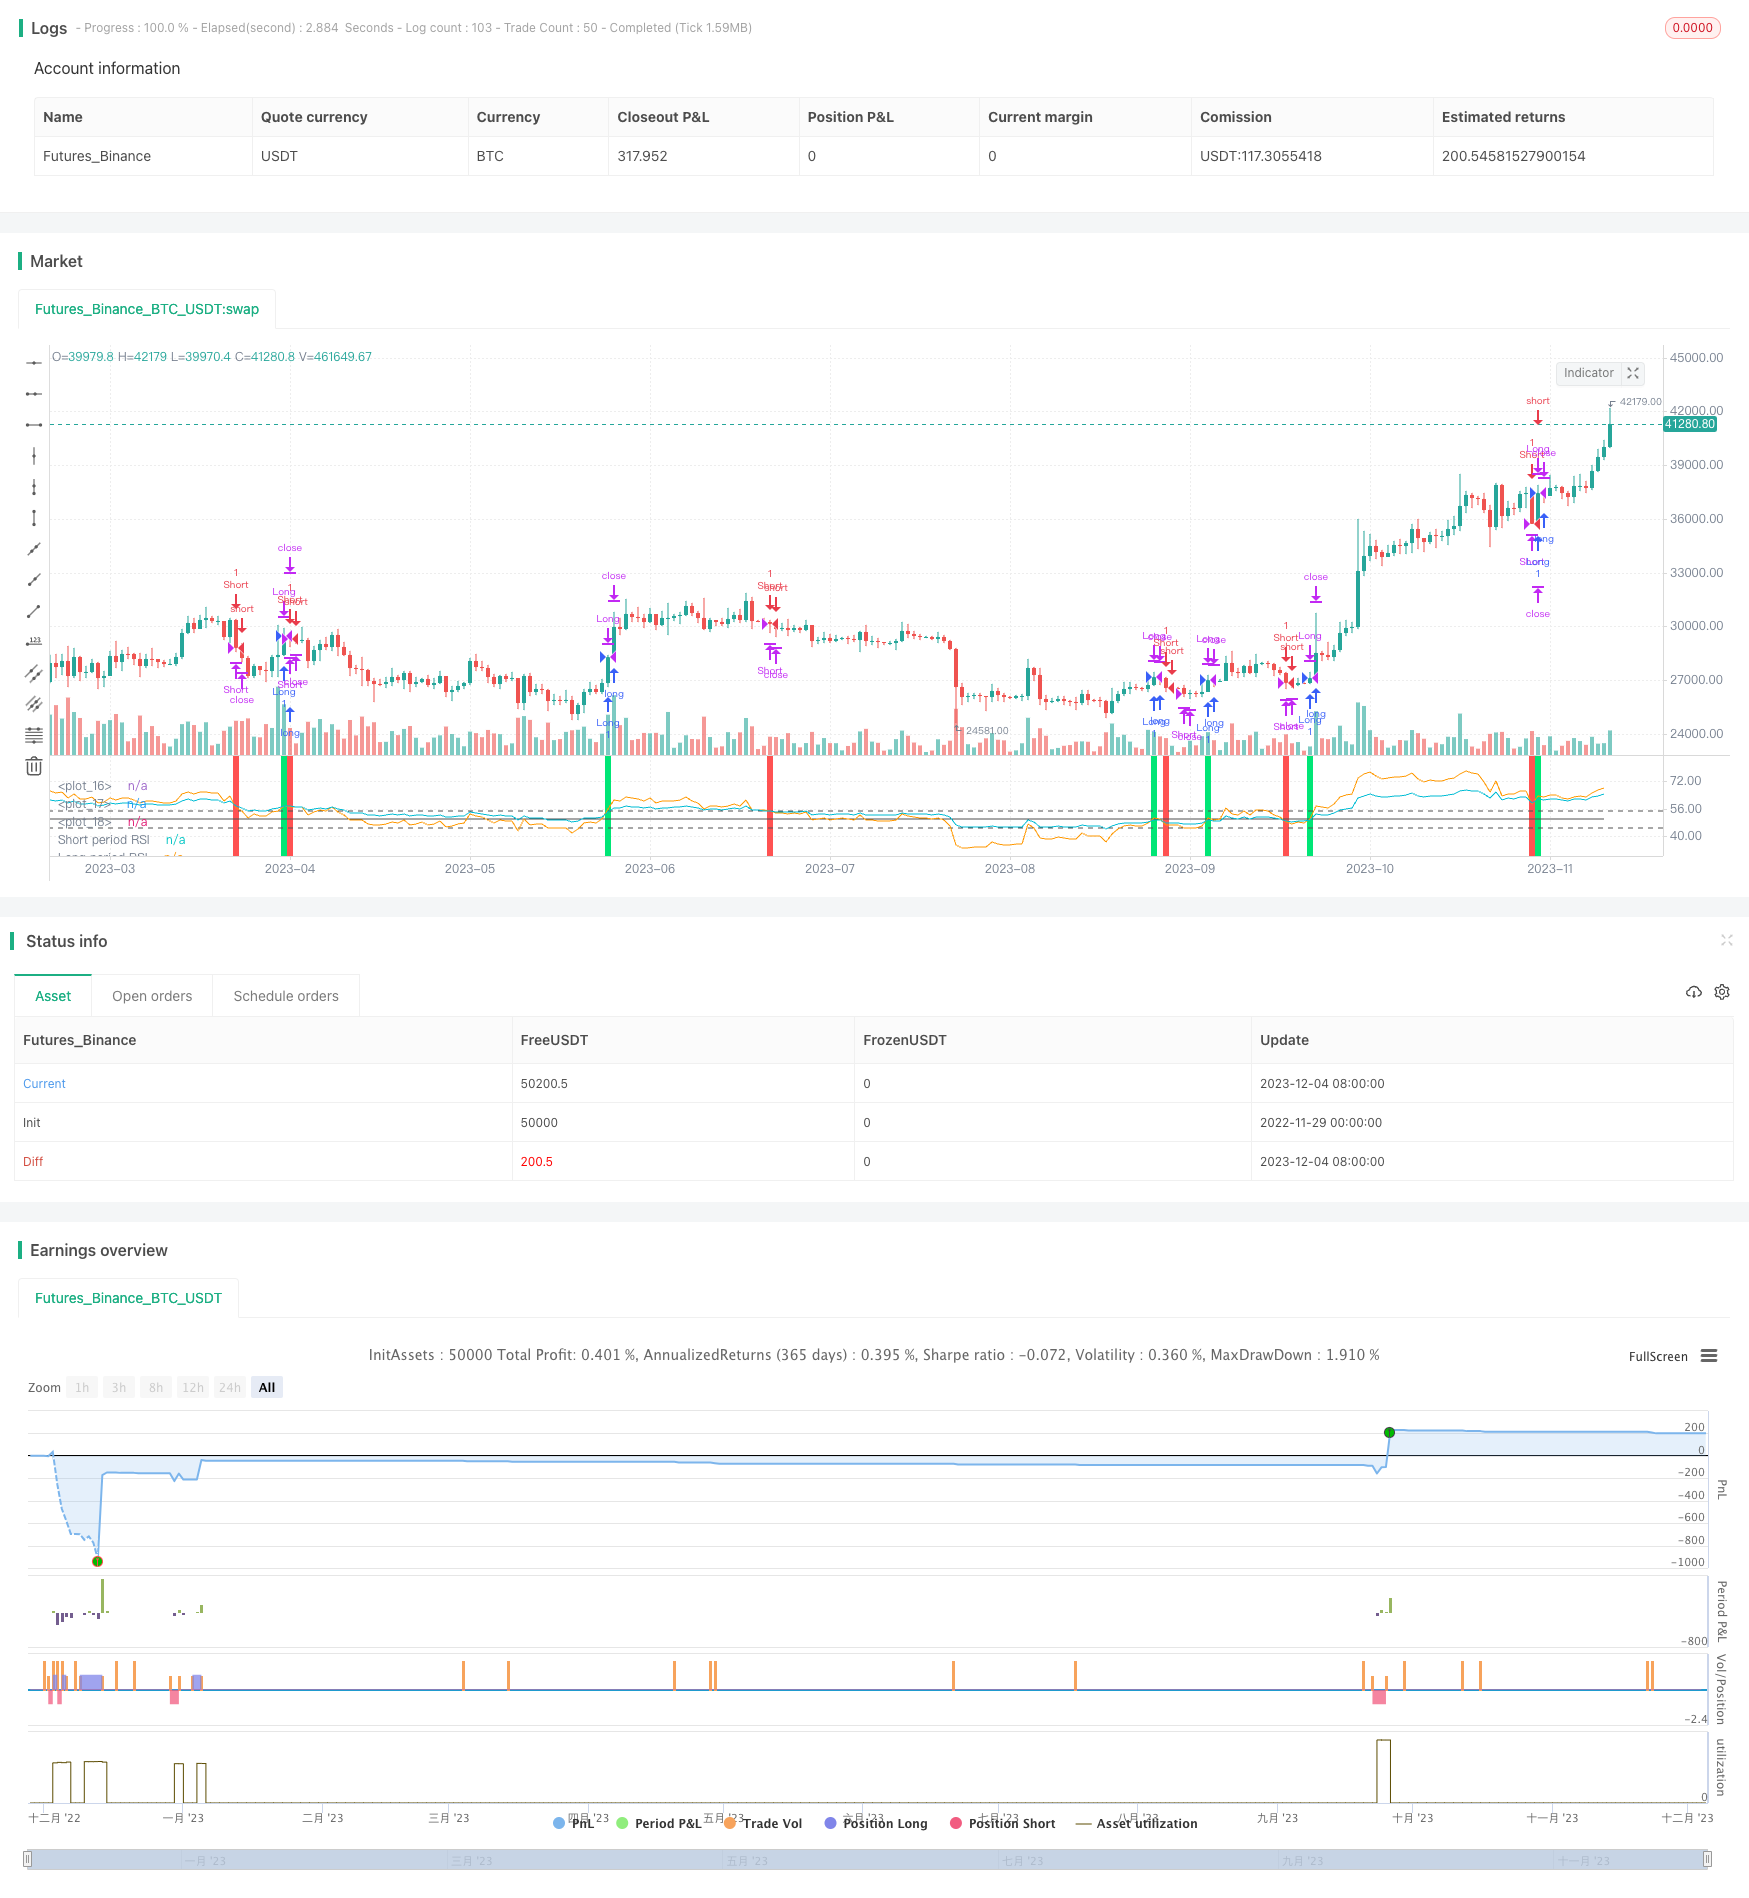
本策略名称为“双时间轴RSI反转”,它是一个基于相对强度指数(RSI)的量化交易策略。该策略运用两个不同周期的RSI作为买入和卖出信号,实现低买高卖,获取股票价格反转带来的交易机会。
该策略使用快速周期(默认55天)RSI和慢速周期(默认126天)RSI构建交易信号。当快速周期RSI上穿慢速周期RSI时生成买入信号,反之当快速周期RSI下穿慢速周期RSI时生成卖出信号。这样通过比较两个不同时间区间内价格动量的相对强弱,发现短期和长期趋势反转机会。
进入信号后,策略会设置止盈止损点。止盈点默认为进入价格的0.9倍,止损点默认为进入价格的3%。同时当重新出现反向信号时,也会平掉当前头寸。
- 利用双RSI比较发现短期和长期价格趋势的变化点,捕捉反转机会
- 双RSI滤除假突破带来的噪音交易
- 配置止盈止损点,可以限制单笔损失
- 股价剧烈波动期间,RSI信号可能频繁反转
- 止损点过小,可能导致小幅震荡后就止损
- 双RSI参数设置不当,可能错过大的反转趋势
- RSI参数可以测试更多组合,找到最佳参数
- 可以结合其他指标过滤假突破信号
- 动态调整止盈止损比例,让止盈更加灵活
本策略“双时间轴RSI反转”通过比较快速周期和慢速周期两个RSI的交叉作为交易信号,目标捕捉短期价格反转机会。同时设置止盈止损规则规避风险。这是一种典型的利用指标多时间轴比较实现价格反转交易的策略。优化空间在于参数调整和风控规则优化。
||
The strategy is named "Dual Timeframe RSI Reversal". It is a quantitative trading strategy based on Relative Strength Index (RSI). The strategy uses two RSI with different periods to generate buy and sell signals, aiming to buy low and sell high by capturing price reversal opportunities.
The strategy constructs trading signals by comparing a fast period RSI (default 55 days) and a slow period RSI (default 126 days). When the fast RSI crosses above the slow RSI, a buy signal is generated. When the fast RSI falls below the slow RSI, a sell signal is triggered. By comparing the relative strength between two different timeframes, it detects opportunities when short-term and long-term trends reversing.
After entering a position, profit target and stop loss will be set. Default profit target is 0.9 times the entry price. Default stop loss is 3% below the entry price. Positions will also be closed if a reverse signal is triggered.
- Catch short-term price reversals by comparing dual RSIs
- Filter out false signals using dual confirmation
- Limit loss on single bet with stop loss
- Frequent reverse signals during high volatility
- Stop loss too tight, easily knocked out by small fluctuations
- Miss major reversals with poorly configured parameters
- Test more RSI parameter combinations to find optimum
- Add other indicators to filter false signals
- Dynamic stop loss and take profit ratio for better profitability
The "Dual Timeframe RSI Reversal" strategy generates trading signals by comparing crossovers between fast and slow RSI periods. It aims to capture short-term price reversals. Profit and stop loss rules are set to limit risks. This is a typical strategy of using multi-timeframe indicator comparisons to trade reversals. Enhancement areas include parameter tuning and risk control rules.
[/trans]
Strategy Arguments
| Argument | Default | Description |
|---|---|---|
| v_input_1 | 55 | Short length |
| v_input_2 | 126 | Long length |
| v_input_3 | 55 | Overbought |
| v_input_4 | 45 | Oversold |
| v_input_5 | 0.9 | Take profit level % |
| v_input_6 | 3 | Stoploss level % |
Source (PineScript)
/*backtest
start: 2022-11-29 00:00:00
end: 2023-12-05 00:00:00
period: 1d
basePeriod: 1h
exchanges: [{"eid":"Futures_Binance","currency":"BTC_USDT"}]
*/

//@version=2
strategy(title="Relative Strength Index", shorttitle="RSI")
slen    = input(55, title="Short length")
llen    = input(126, title="Long length")
sup     = ema(max(change(close), 0), slen)
sdown   = ema(-min(change(close), 0), slen)
rsi1    = sdown == 0 ? 100 : sup == 0 ? 0 : 100 - (100 / (1 + sup / sdown))
lup     = ema(max(change(close), 0), llen)
ldown   = ema(-min(change(close), 0), llen)
rsi2    = ldown == 0 ? 100 : lup == 0 ? 0 : 100 - (100 / (1 + lup / ldown))
ob      = input(55, title="Overbought")
os      = input(45, title="Oversold")
tp      = input(.9, title="Take profit level %")*.01
sl      = input(3, title="Stoploss level %")*.01
mid     = avg(ob,os)
plot    (mid, color=#4f4f4f, transp=0)
hline   (ob, color=#4f4f4f)
hline   (os, color=#4f4f4f)
long    = crossover(rsi1,rsi2)
short   = crossunder(rsi1,rsi2)
vall    = valuewhen(long,close,0)
lexit1  = high>=(vall*tp)+vall
lexit2  = low<=vall-(vall*sl)
vals    = valuewhen(short,close,0)
sexit1  = low<=vals - (vals*tp)
sexit2  = high>=vals + (vals*sl)
bgcolor (color=long?lime:na,transp=50)
bgcolor (color=short?red:na, transp=50)
strategy.entry("Long", strategy.long, when=long)
strategy.close("Long", when=lexit1)
strategy.close("Long", when=lexit2)
strategy.close("Long", when=short)
strategy.entry("Short", strategy.short, when=short)
strategy.close("Short", when=sexit1)
strategy.close("Short", when=sexit2)
strategy.close("Short", when=long)
plot    (rsi1, color=orange, transp=0,linewidth=1, title="Short period RSI")
plot    (rsi2, color=aqua  , transp=0,linewidth=1, title="Long period RSI")
Detail
https://www.fmz.com/strategy/434480
Last Modified
2023-12-06 17:17:16
