Name
基于RSI的阈值交易策略RSI-Threshold-Trading-Strategy
Author
ChaoZhang
Strategy Description
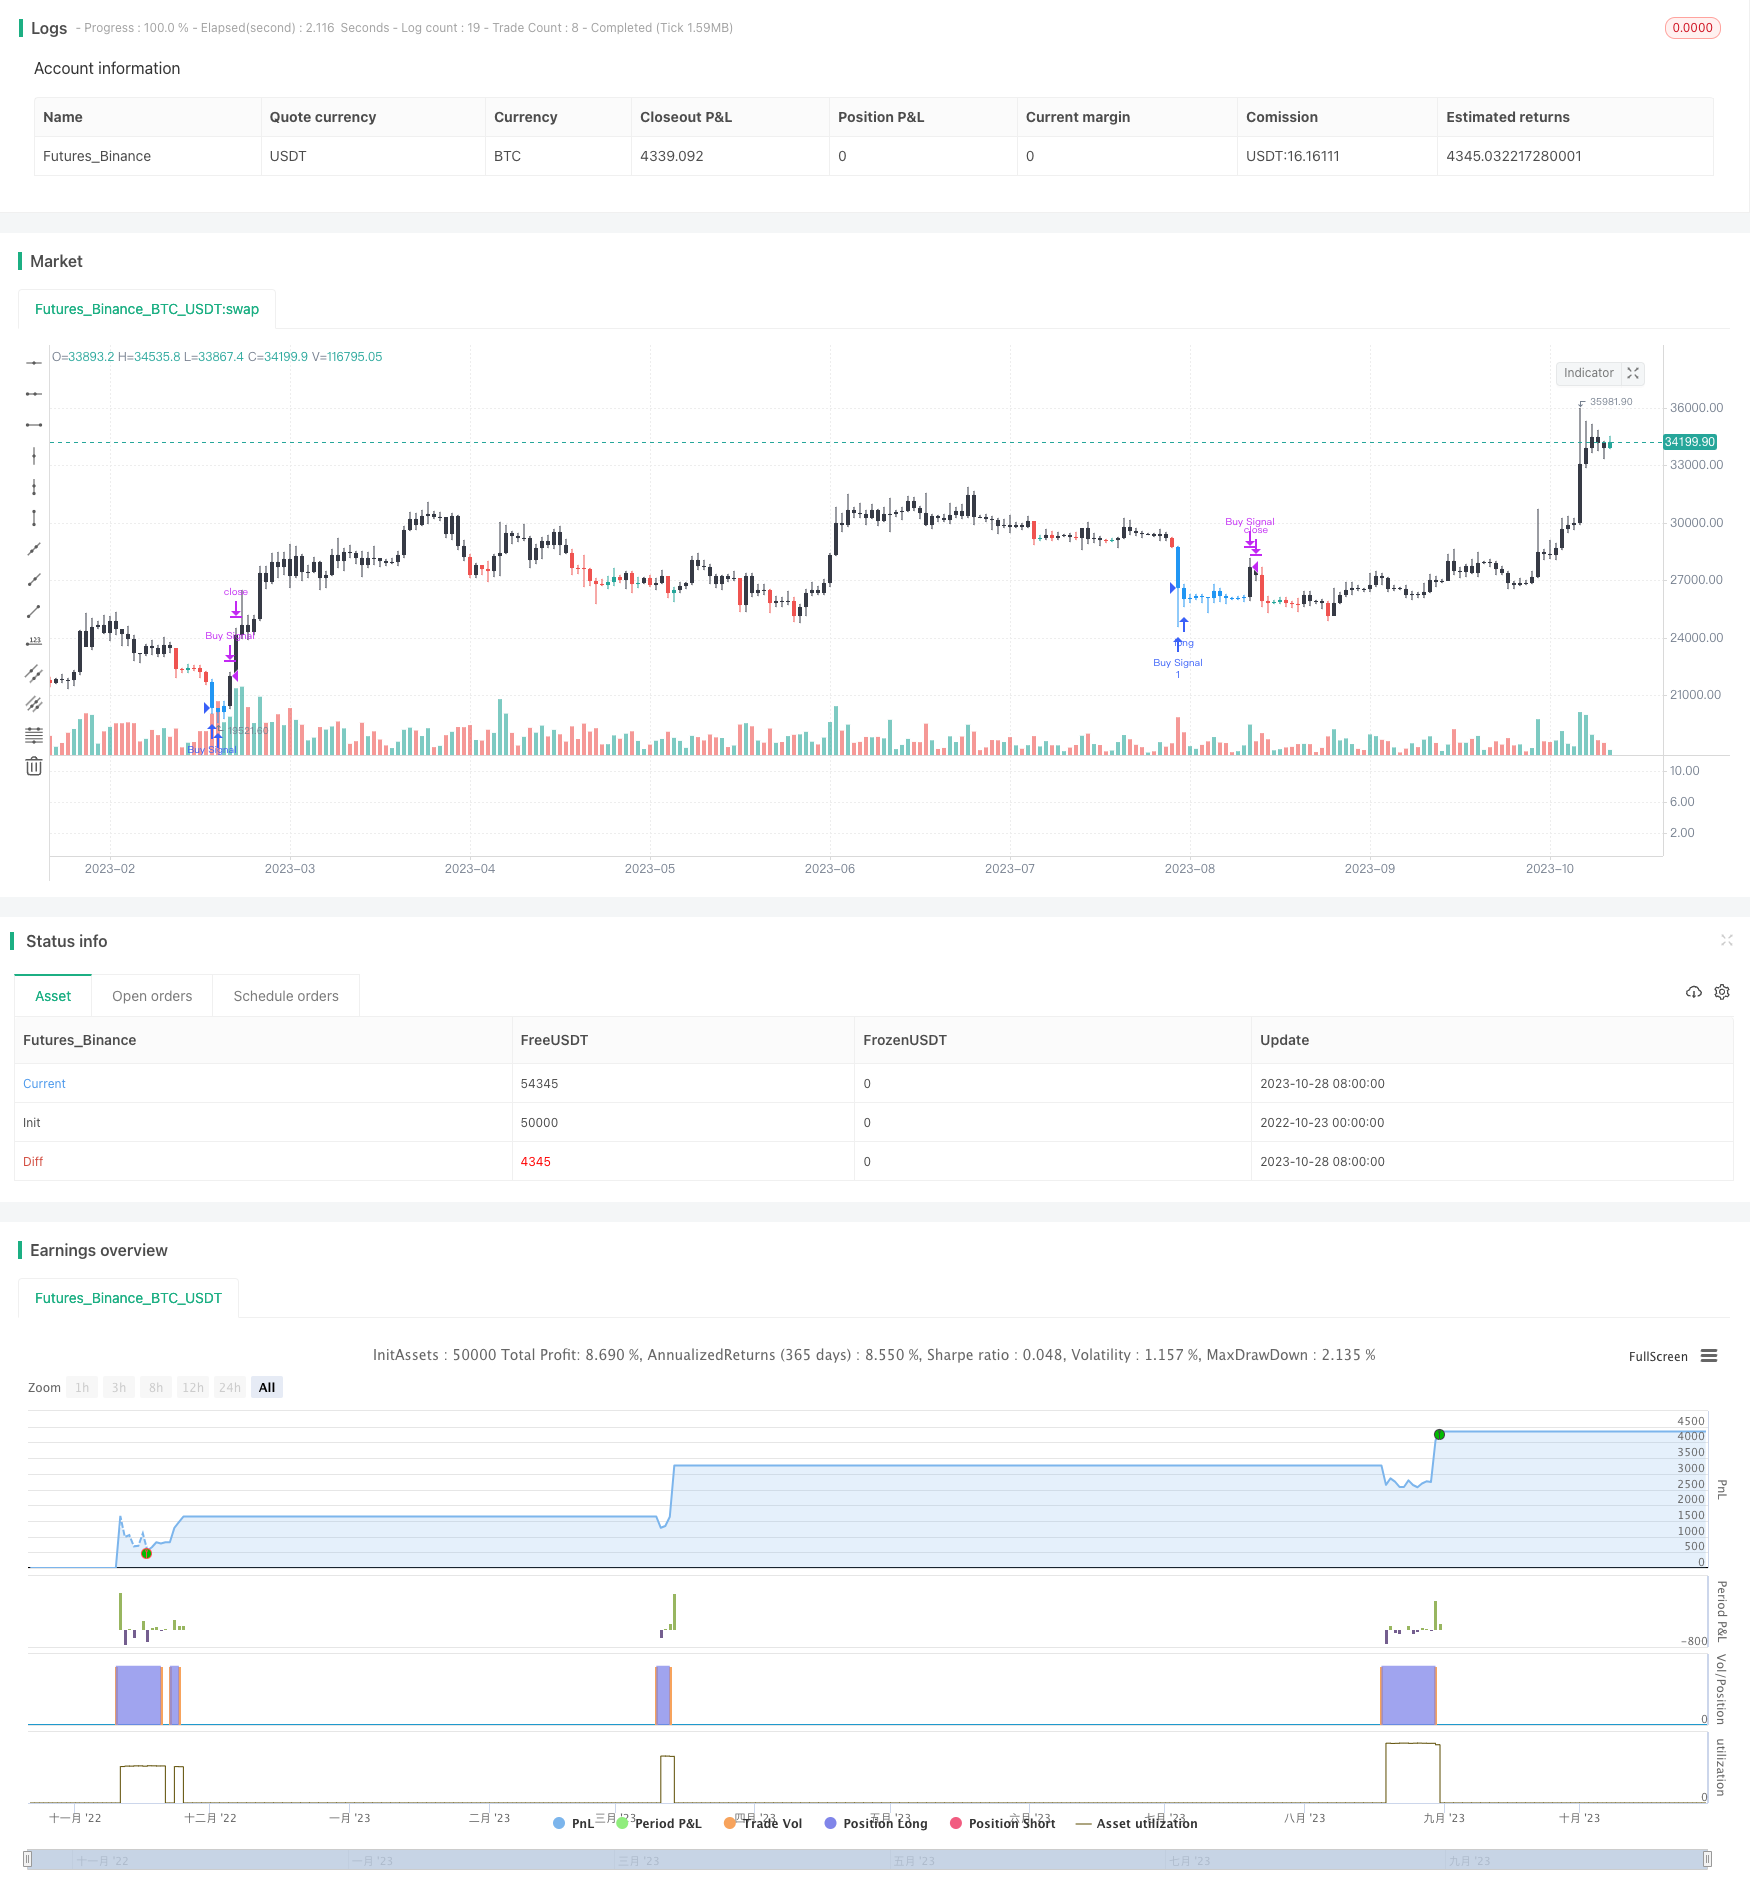
该策略基于相对强弱指标RSI实现了一个简单的阈值交易策略。当RSI低于阈值30时买入,当RSI高于阈值40时卖出。持仓时间固定为10天。该策略适合中短期交易。
该策略主要基于RSI指标的过卖区和过买区实现交易信号的产生。RSI指标反映了一个周期内涨跌幅的快慢。RSI低于30表示处于超过卖区,股价可能反弹;RSI高于70表示处于超过买区,股价可能下跌。
具体来说,该策略首先计算10日RSI,然后设定阈值30和40。当10日RSI低于30时产生买入信号,当10日RSI高于40时产生卖出信号。收到买入信号后,开仓买入。收到卖出信号后,如果持仓天数超过10天则直接卖出平仓;如果持仓天数不足10天,则继续持仓至第10天卖出。
该策略简单并且容易理解,通过RSI指标判断超卖超买区域,实现了一个基于指标的阈值交易策略。
- 使用广泛的RSI指标,参数优化空间大
该策略使用了广泛应用的RSI指标。RSI参数可以进行调整优化,适用于不同周期和市场环境。
- 实现了简单的趋势跟踪
RSI可以反映价格变化趋势。策略根据RSI指标来判断价格走势,实现了简单的趋势跟踪。
- 风险控制较好
策略采用了固定持仓期限,可以有效控制单笔损失。同时,RSI参数可以进行调整,降低错误交易概率。
- RSI参数容易过优化
RSI的参数可以灵活设置,但是过度优化及回测偏差会带来实盘风险。
- 存在一定的滞后性
RSI属于趋势跟踪指标,对突发事件反应较慢,存在一定滞后性。应结合其他指标优化。
- 固定持仓时间不够灵活
固定的持仓时间强制了止盈止损点,无法根据市场变化进行调整。希望进一步优化成动态调整止盈止损。
-
优化RSI参数,测试不同的参数对策略的影响
-
增加其他指标,形成指标组合,利用不同指标的优势
-
优化止盈止损策略,使其能够根据市场变化进行动态调整
-
优化仓位管理,根据市场情况动态调整仓位
-
测试适合该策略的品种,选择流动性好、波动较大的品种
-
优化交易时间,测试不同的交易时间对策略的影响
该策略整体较为简单,通过RSI指标实现了基于阈值的交易策略。策略优点是简单、易于理解,风险控制相对较好。但是也存在RSI参数优化困难、止盈止损不灵活等问题。未来的优化方向包括参数优化、止盈止损优化、仓位管理等。需要进一步优化后方可实盘。
||
This strategy implements a simple threshold trading strategy based on the Relative Strength Index (RSI). It buys when RSI falls below the threshold of 30 and sells when RSI rises above the threshold of 40. The holding period is fixed at 10 days. The strategy is suitable for medium-term trading.
The strategy mainly uses the oversold and overbought zones of the RSI indicator to generate trading signals. The RSI reflects the speed of price changes over a period. RSI below 30 indicates an oversold zone where price may bounce back. RSI above 70 indicates an overbought zone where price may fall.
Specifically, the strategy first calculates the 10-day RSI, then sets the thresholds at 30 and 40. When 10-day RSI falls below 30, a buy signal is generated. When 10-day RSI rises above 40, a sell signal is generated. Upon receiving the buy signal, it opens a long position. Upon receiving the sell signal, if the holding days exceed 10 days, it closes the position directly. Otherwise, it continues holding until the 10th day to sell out.
The strategy is simple and easy to understand, identifying oversold and overbought zones using the RSI to implement a threshold trading strategy based on an indicator.
- Uses the widely applied RSI indicator with room for parameter optimization
The strategy uses the prevalent RSI indicator. RSI parameters can be adjusted and optimized to suit different periods and market environments.
- Implements simple trend following
RSI can reflect price change trends. The strategy judges price moves based on RSI to achieve simple trend following.
- Relatively good risk control
The strategy adopts a fixed holding period to effectively control single loss. Meanwhile, RSI parameters can be tuned to reduce erroneous trading.
- RSI parameters susceptible to overoptimization
RSI parameters can be flexibly set but over-optimization and backtest bias may bring live trading risks.
- Lagging effect exists
RSI is a trend-following indicator and reacts slowly to sudden events, with some lagging effect. Other indicators should be combined.
- Fixed holding period lacks flexibility
The fixed holding period mandates profit-taking and stop-loss points and cannot be adjusted based on market changes. A dynamic adjustment of stop profit and stop loss is desired.
-
Optimize RSI parameters and test impacts of different values.
-
Add other indicators to form a combined system utilizing strengths of different indicators.
-
Enhance stop profit/loss strategy to allow dynamic adjustments based on market conditions.
-
Optimize position sizing to dynamically adjust positions based on market conditions.
-
Test products suitable for the strategy, choosing liquid products with high volatility.
-
Optimize trading hours and test impacts on the strategy.
The strategy is relatively simple, implementing a threshold-based trading strategy using RSI. Its advantages include simplicity, ease of understanding and relatively good risk control. However, issues like RSI parameter optimization difficulty and inflexible stop profit/loss exist. Future enhancements include parameter optimization, stop profit/loss enhancements, position sizing etc. Further optimizations are needed before live trading.
[/trans]
Strategy Arguments
| Argument | Default | Description |
|---|---|---|
| v_input_1 | 40 | overbought value |
| v_input_2 | 30 | oversold value |
| v_input_3 | 2018 | Backtest Start Year |
| v_input_4 | true | Backtest Start Month |
| v_input_5 | true | Backtest Start Day |
| v_input_6 | 2021 | Backtest Stop Year |
| v_input_7 | 16 | Backtest Stop Month |
| v_input_8 | 2 | Backtest Stop Day |
| v_input_9 | true | Color Background? |
Source (PineScript)
/*backtest
start: 2022-10-23 00:00:00
end: 2023-10-29 00:00:00
period: 1d
basePeriod: 1h
exchanges: [{"eid":"Futures_Binance","currency":"BTC_USDT"}]
*/

// This source code is subject to the terms of the Mozilla Public License 2.0 at https://mozilla.org/MPL/2.0/
// © Bitduke

//@version=4
// strategy("Simple RSI Buy/Sell at a level", shorttitle="Simple RSI Strategy", overlay=true,calc_on_every_tick=false,pyramiding=1, default_qty_type=strategy.cash,default_qty_value=1000, currency=currency.USD, initial_capital=1000,commission_type=strategy.commission.percent, commission_value=0.075)
overbought = input(40, title="overbought value")
oversold = input(30, title="oversold value")
// Component Test Periods Code Begin
testStartYear = input(2018, "Backtest Start Year")
testStartMonth = input(1, "Backtest Start Month")
testStartDay = input(1, "Backtest Start Day")
testPeriodStart = timestamp(testStartYear,testStartMonth,testStartDay,0,0)

testStopYear = input(2021, "Backtest Stop Year")
testStopMonth = input(16, "Backtest Stop Month")
testStopDay = input(2, "Backtest Stop Day")
testPeriodStop = timestamp(testStopYear,testStopMonth,testStopDay,0,0)

// A switch to control background coloring of the test period
testPeriodBackground = input(title="Color Background?", type=input.bool, defval=true)
testPeriodBackgroundColor = testPeriodBackground and (time >= testPeriodStart) and (time <= testPeriodStop) ? #00FF00 : na
bgcolor(testPeriodBackgroundColor, transp=97)

testPeriod() => true
// Component Test Periods Code End
//////////////////////////////////////////////////////////////////////

myrsi = rsi(close, 10) > overbought
myrsi2 = rsi(close, 10) < oversold

barcolor(myrsi ? color.black : na)
barcolor(myrsi2 ? color.blue : na)


myEntry = myrsi2 and hour(time) <= 9

strategy.entry("Buy Signal", strategy.long, when = myEntry and testPeriod())

// Close 10 bar periods after the condition that triggered the entry

//if (myEntry[10])
    //strategy.close("Buy Signal")
strategy.close("Buy Signal", when = barssince(myEntry) >= 10 or myrsi and testPeriod())

//strategy.entry("Sell Signal",strategy.short, when = myrsi2)
Detail
https://www.fmz.com/strategy/430576
Last Modified
2023-10-30 14:58:38
