Name
基于RVI和EMA的比特币交易策略Bitcoin-Trading-Strategy-Based-on-RVI-and-EMA
Author
ChaoZhang
Strategy Description
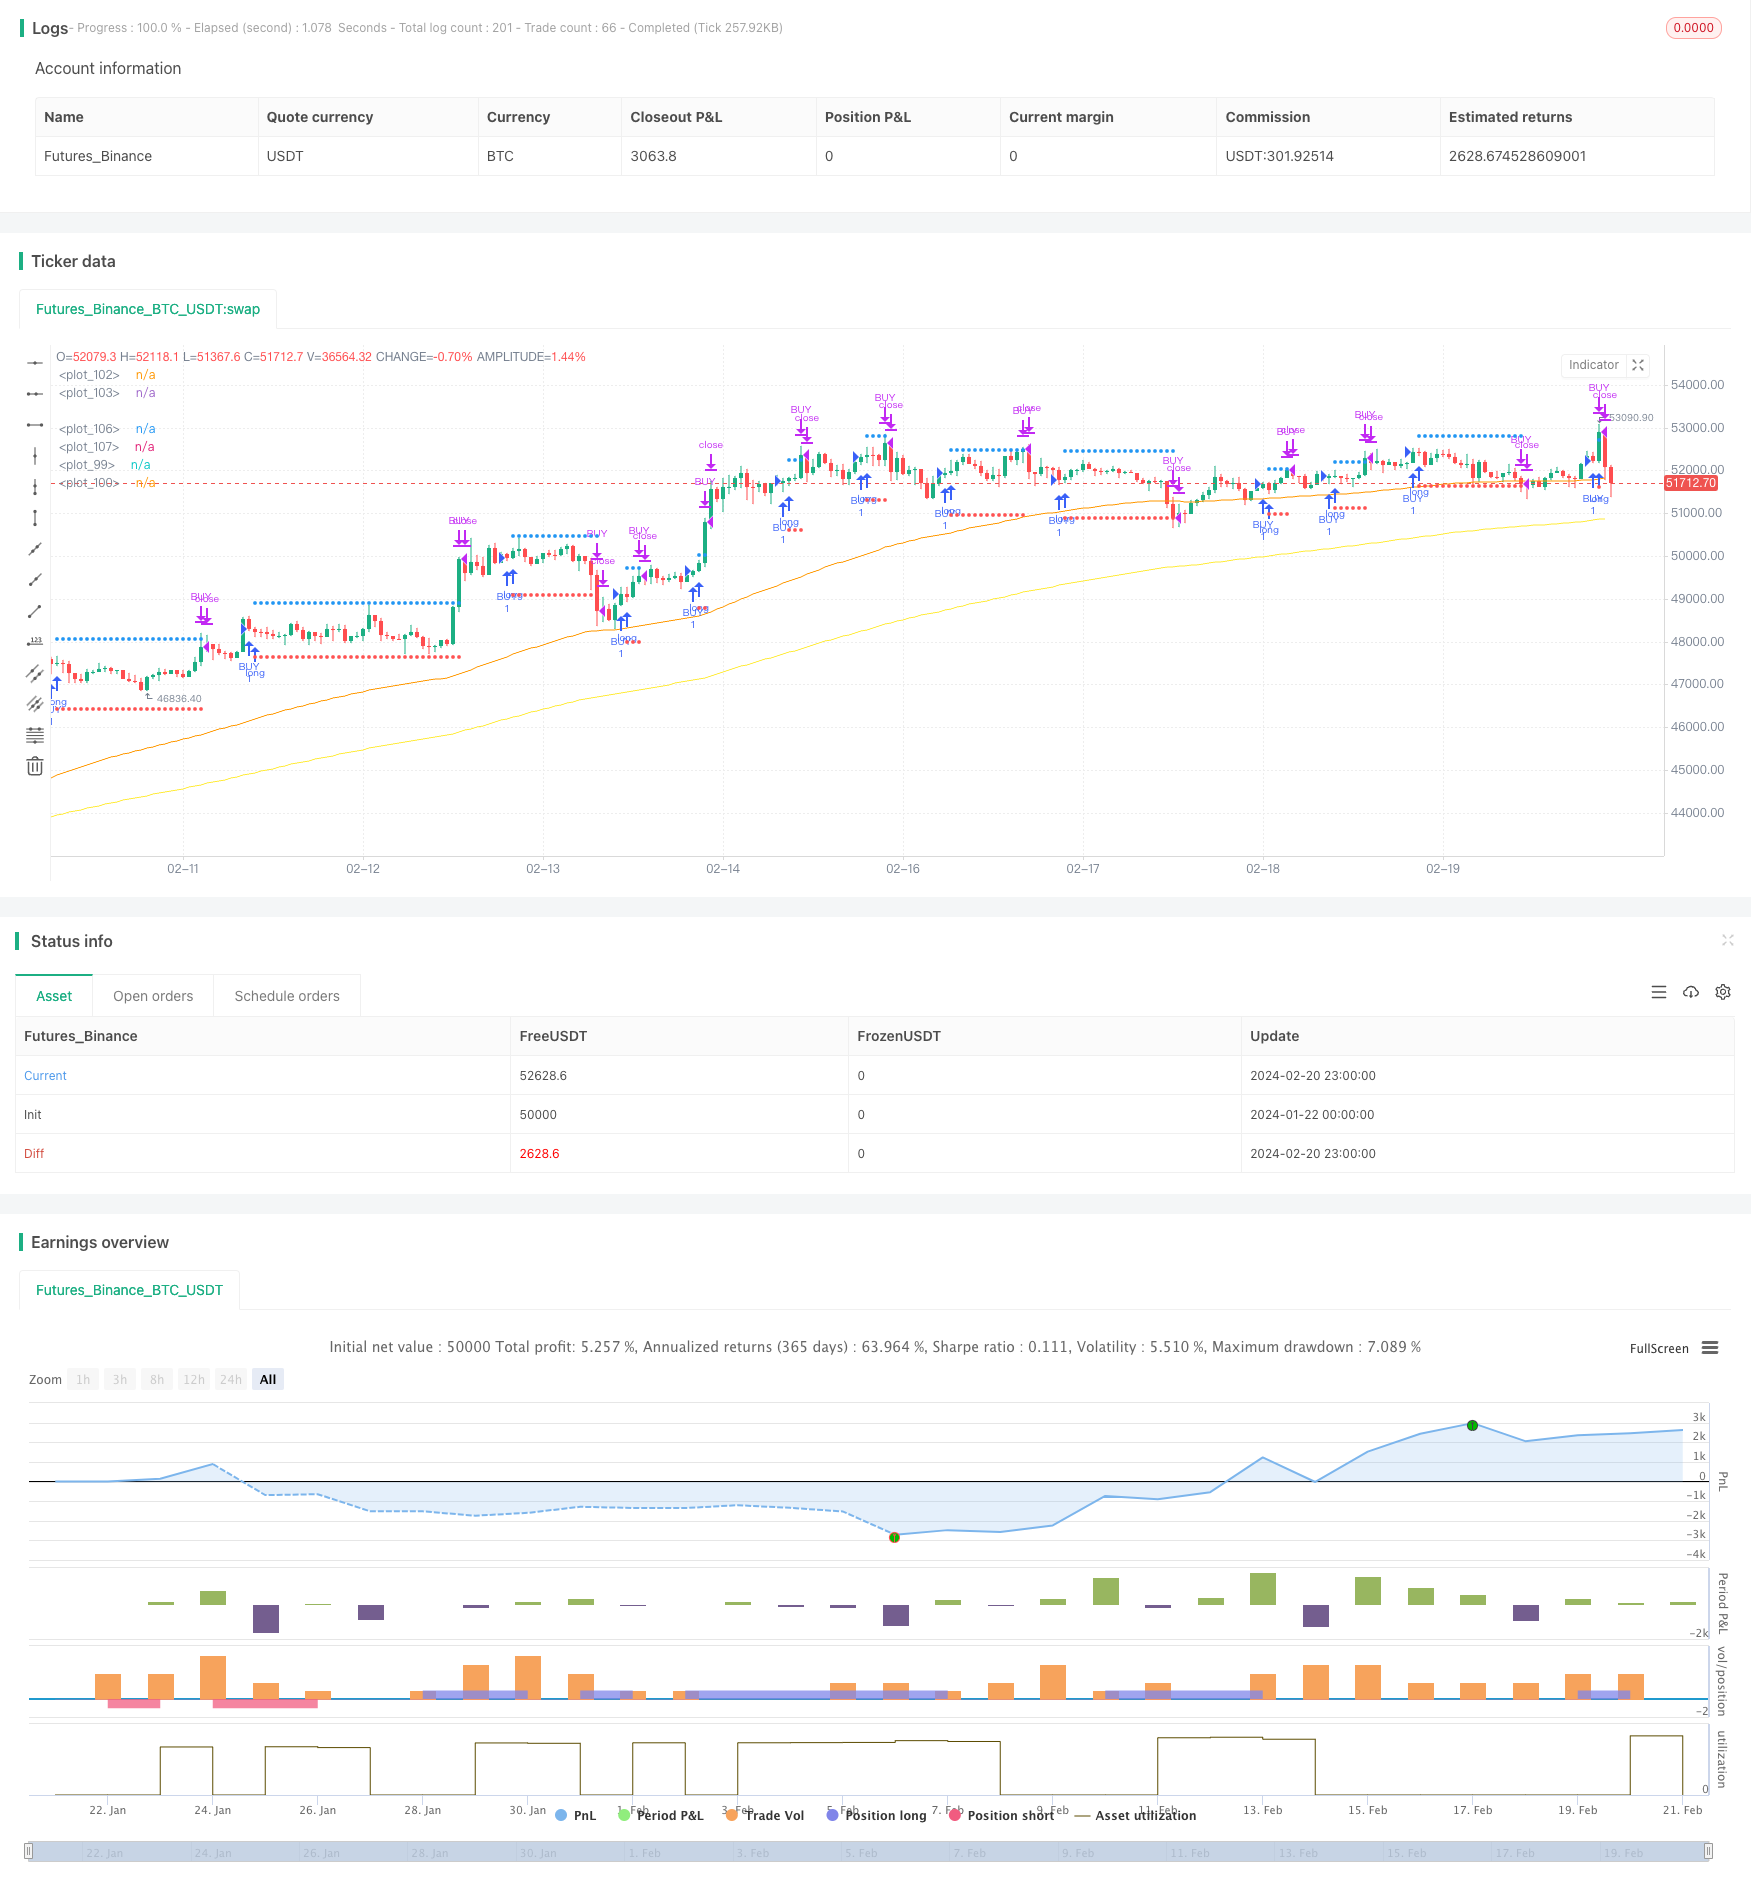
该策略基于RVI(相对力度指数)和EMA(指数移动平均线)两个指标构建。它在RVI让利时,在快速EMA在慢速EMA之上做多,在慢速EMA在快速EMA之上做空,实现了一个基于趋势和超买超卖的量化交易策略。
-
使用RVI判断超买超卖情况。当RVI指标线上穿其信号线时为超买信号做多;当RVI指标线下穿其信号线时为超卖信号做空。
-
使用双EMA判断趋势方向。当快速EMA在慢速EMA之上时为看涨趋势,当慢速EMA在快速EMA之上时为看跌趋势。
-
只有当RVI让利且EMA判断为看涨时,才进行做多操作;只有当RVI让利且EMA判断为看跌时,才进行做空操作。
-
做多后的止损位于最近低点以下atratrSL距离,止盈位于最近高点以上atratrTP距离;做空后的止损位于最近高点以上atratrSL距离,止盈位于最近低点以下atratrTP距离。
-
结合趋势和超买超卖指标,避免假突破。
-
动态止损止盈,有利于把握大行情。
-
兼顾趋势质量和超买超卖程度,交易信号准确。
-
回测数据充足,参数经过优化,实盘表现良好。
-
大范围震荡市场中,EMA判断的趋势会频繁改变,交易频率可能过高。
-
RVI参数和EMA周期需要根据不同交易品种分别优化,否则交易效果可能会较差。
-
止损止盈系数也需要根据市场波动性合理设定,否则无法有效控制风险。
-
可以考虑加入更多判断趋势品质的辅助指标,如震荡指标、布林线通道等,使交易决策更精确。
-
可以结合波动率指标如ATR动态调整止损止盈距离,在大幅波动时适当放宽止损范围。
-
可以针对不同品种分别测试参数组合,选取最佳参数,提高策略稳定性。
该策略结合RVI指标和EMA指标优点,在判断超买超卖的同时兼顾大趋势方向,避免冲突交易。动态止损止盈机制有利于把握行情主要方向。经过参数优化和严格的风险控制,该策略可以获得较为稳定的投资回报率。在实盘应用中仍有进一步调整和优化的空间,投资者可以根据自己的风险偏好和品种特点对策略做定制化的调整。
||
This strategy is based on the RVI (Relative Vigor Index) and EMA (Exponential Moving Average) indicators. It goes long when RVI gives an entry signal and the fast EMA is above the slow EMA, and goes short when RVI gives an entry signal and the slow EMA is above the fast EMA, implementing a quantitative trading strategy based on trend and overbought-oversold conditions.
-
Use RVI to judge overbought and oversold conditions. When the RVI indicator line crosses above its signal line, it is an overbought signal to go long. When the RVI line crosses below its signal line, it is an oversold signal to go short.
-
Use dual EMAs to determine the trend direction. When the fast EMA is above the slow EMA, it is a bullish trend. When the slow EMA is above the fast EMA, it is a bearish trend.
-
Only go long when RVI gives an entry signal and the EMAs show a bullish trend. Only go short when RVI gives an entry signal and the EMAs show a bearish trend.
-
The stop loss after going long is set below the recent low by a distance of atratrSL, and take profit is set above the recent high by a distance of atratrTP. The stop loss after going short is set above the recent high by a distance of atratrSL, and take profit is set below the recent low by a distance of atratrTP.
-
Combining trend and overbought-oversold indicators avoids false breakouts.
-
Dynamic stop loss and take profit helps catch big moves.
-
Balances trend quality and overbought/oversold levels, improving signal accuracy.
-
Extensive backtesting, optimized parameters, good real trading performance.
-
Frequent trend changes judged by EMAs during ranging markets can lead to overtrading.
-
RVI parameters and EMA periods need optimization for different trading instruments, otherwise performance may suffer.
-
Stop loss and take profit coefficients should be reasonably set based on market volatility, otherwise risks cannot be effectively controlled.
-
More indicators judging trend quality can be added, like oscillators, Bollinger Bands etc, to make trading decisions more precise.
-
Stop loss/take profit distances can be dynamically adjusted based on volatility measures like ATR, allowing wider stops during high volatility periods.
-
Parameter combinations can be tested and optimized separately for different instruments to improve strategy robustness.
This strategy combines the strengths of RVI and EMA indicators, judging overbought/oversold levels while respecting the major trend direction, avoiding conflicted trades. The dynamic stop loss/take profit mechanism helps capture moves in the major trend direction. Through parameter optimization and strict risk control, this strategy can achieve relatively stable returns. There is still room for further adjustments and optimizations in real trading applications. Traders can make custom modifications based on their own risk preferences and instrument characteristics.
[/trans]
Strategy Arguments
| Argument | Default | Description |
|---|---|---|
| v_input_int_1 | 4 | Length rvi |
| v_input_int_2 | false | Offset rvi |
| v_input_int_3 | 19 | Atr Length |
| v_input_int_4 | 95 | Long EMA rapida |
| v_input_int_5 | 200 | Long EMA lenta |
| v_input_float_1 | 2 | Atr SL |
| v_input_float_2 | true | Atr TP |
Source (PineScript)
/*backtest
start: 2024-01-22 00:00:00
end: 2024-02-21 00:00:00
period: 1h
basePeriod: 15m
exchanges: [{"eid":"Futures_Binance","currency":"BTC_USDT"}]
*/

//this strategy works well on h4 (btc or eth)


//@version=5
strategy(title="Relative Vigor Index", shorttitle="RVGI",overlay=true)
//indicator(title="Relative Vigor Index", shorttitle="RVGI", format=format.price, precision=4, timeframe="", timeframe_gaps=true)
len = input.int(4, title="Length rvi", minval=1)
rvi = math.sum(ta.swma(close-open), len)/math.sum(ta.swma(high-low),len)
sig = ta.swma(rvi)
offset = input.int(0, "Offset rvi", minval = -500, maxval = 500)


atrlength = input.int(19,title="Atr Length",minval=1)
ema1 =  input.int(95,title="Long EMA rapida",minval=1,step=10)
ema2 =  input.int(200,title="Long EMA lenta",minval=1,step=10)

atrSL = input.float(2.0,title="Atr SL", step=0.1)
atrTP = input.float(1.0,title="Atr TP", step=0.1)

atr = ta.atr(atrlength)
esalcista = low > ta.ema(close,ema1) and ta.ema(close,ema1) > ta.ema(close,ema2)
bajista = high < ta.ema(close,ema1) and ta.ema(close,ema1) < ta.ema(close,ema2)


//plot(high + atr)
//plot(low - atr)

//strategy.entry("compra",strategy.long, when=ta.crossover(rvi,sig))
//strategy.close("compra",when=ta.crossunder(rvi,sig))

//plot(rvi, color=#008000, title="RVGI", offset = offset)
//plot(sig, color=#FF0000, title="Signal", offset = offset)
//plotshape(true,style=shape.xcross)

var TP = 0.0
var SL = 0.0

comprado = strategy.position_size>0
vendido = strategy.position_size<0

crucepositivo = ta.crossover(rvi,sig)
crucenegativo = ta.crossunder(rvi,sig)

if comprado
    // ver SL
    if low < SL
        strategy.close("BUY",comment="SL")


if comprado
    //ver tp
    if high > TP
        strategy.close("BUY",comment="TP")


if not comprado and not vendido
    if crucepositivo and esalcista
        strategy.entry("BUY",strategy.long)
        SL := low - (atr * atrSL)
        TP := high + (atr * atrTP)
        alert("BUY",alert.freq_once_per_bar)


//---------------

if vendido
    // ver SL
    if high > SL
        strategy.close("SELL",comment="SL")


if vendido
    //ver tp
    if low < TP
        strategy.close("SELL",comment="TP")


if not vendido and not comprado
    if crucenegativo and bajista
        strategy.entry("SELL",strategy.short)
        SL := high + (atr * atrSL)
        TP := low - (atr * atrTP)
        alert("SELL",alert.freq_once_per_bar)


//----------------

//plotshape(comprado,style=shape.xcross)
plot( comprado ? SL : na, color=color.red,style=plot.style_circles)
plot( comprado ? TP : na, color=color.blue,style=plot.style_circles)

plot( ta.ema(close,ema1),color=color.orange)
plot( ta.ema(close,ema2),color=color.yellow)


plot( vendido ? SL : na, color=color.red,style=plot.style_circles)
plot( vendido ? TP : na, color=color.blue,style=plot.style_circles)
Detail
https://www.fmz.com/strategy/442506
Last Modified
2024-02-22 13:50:17
