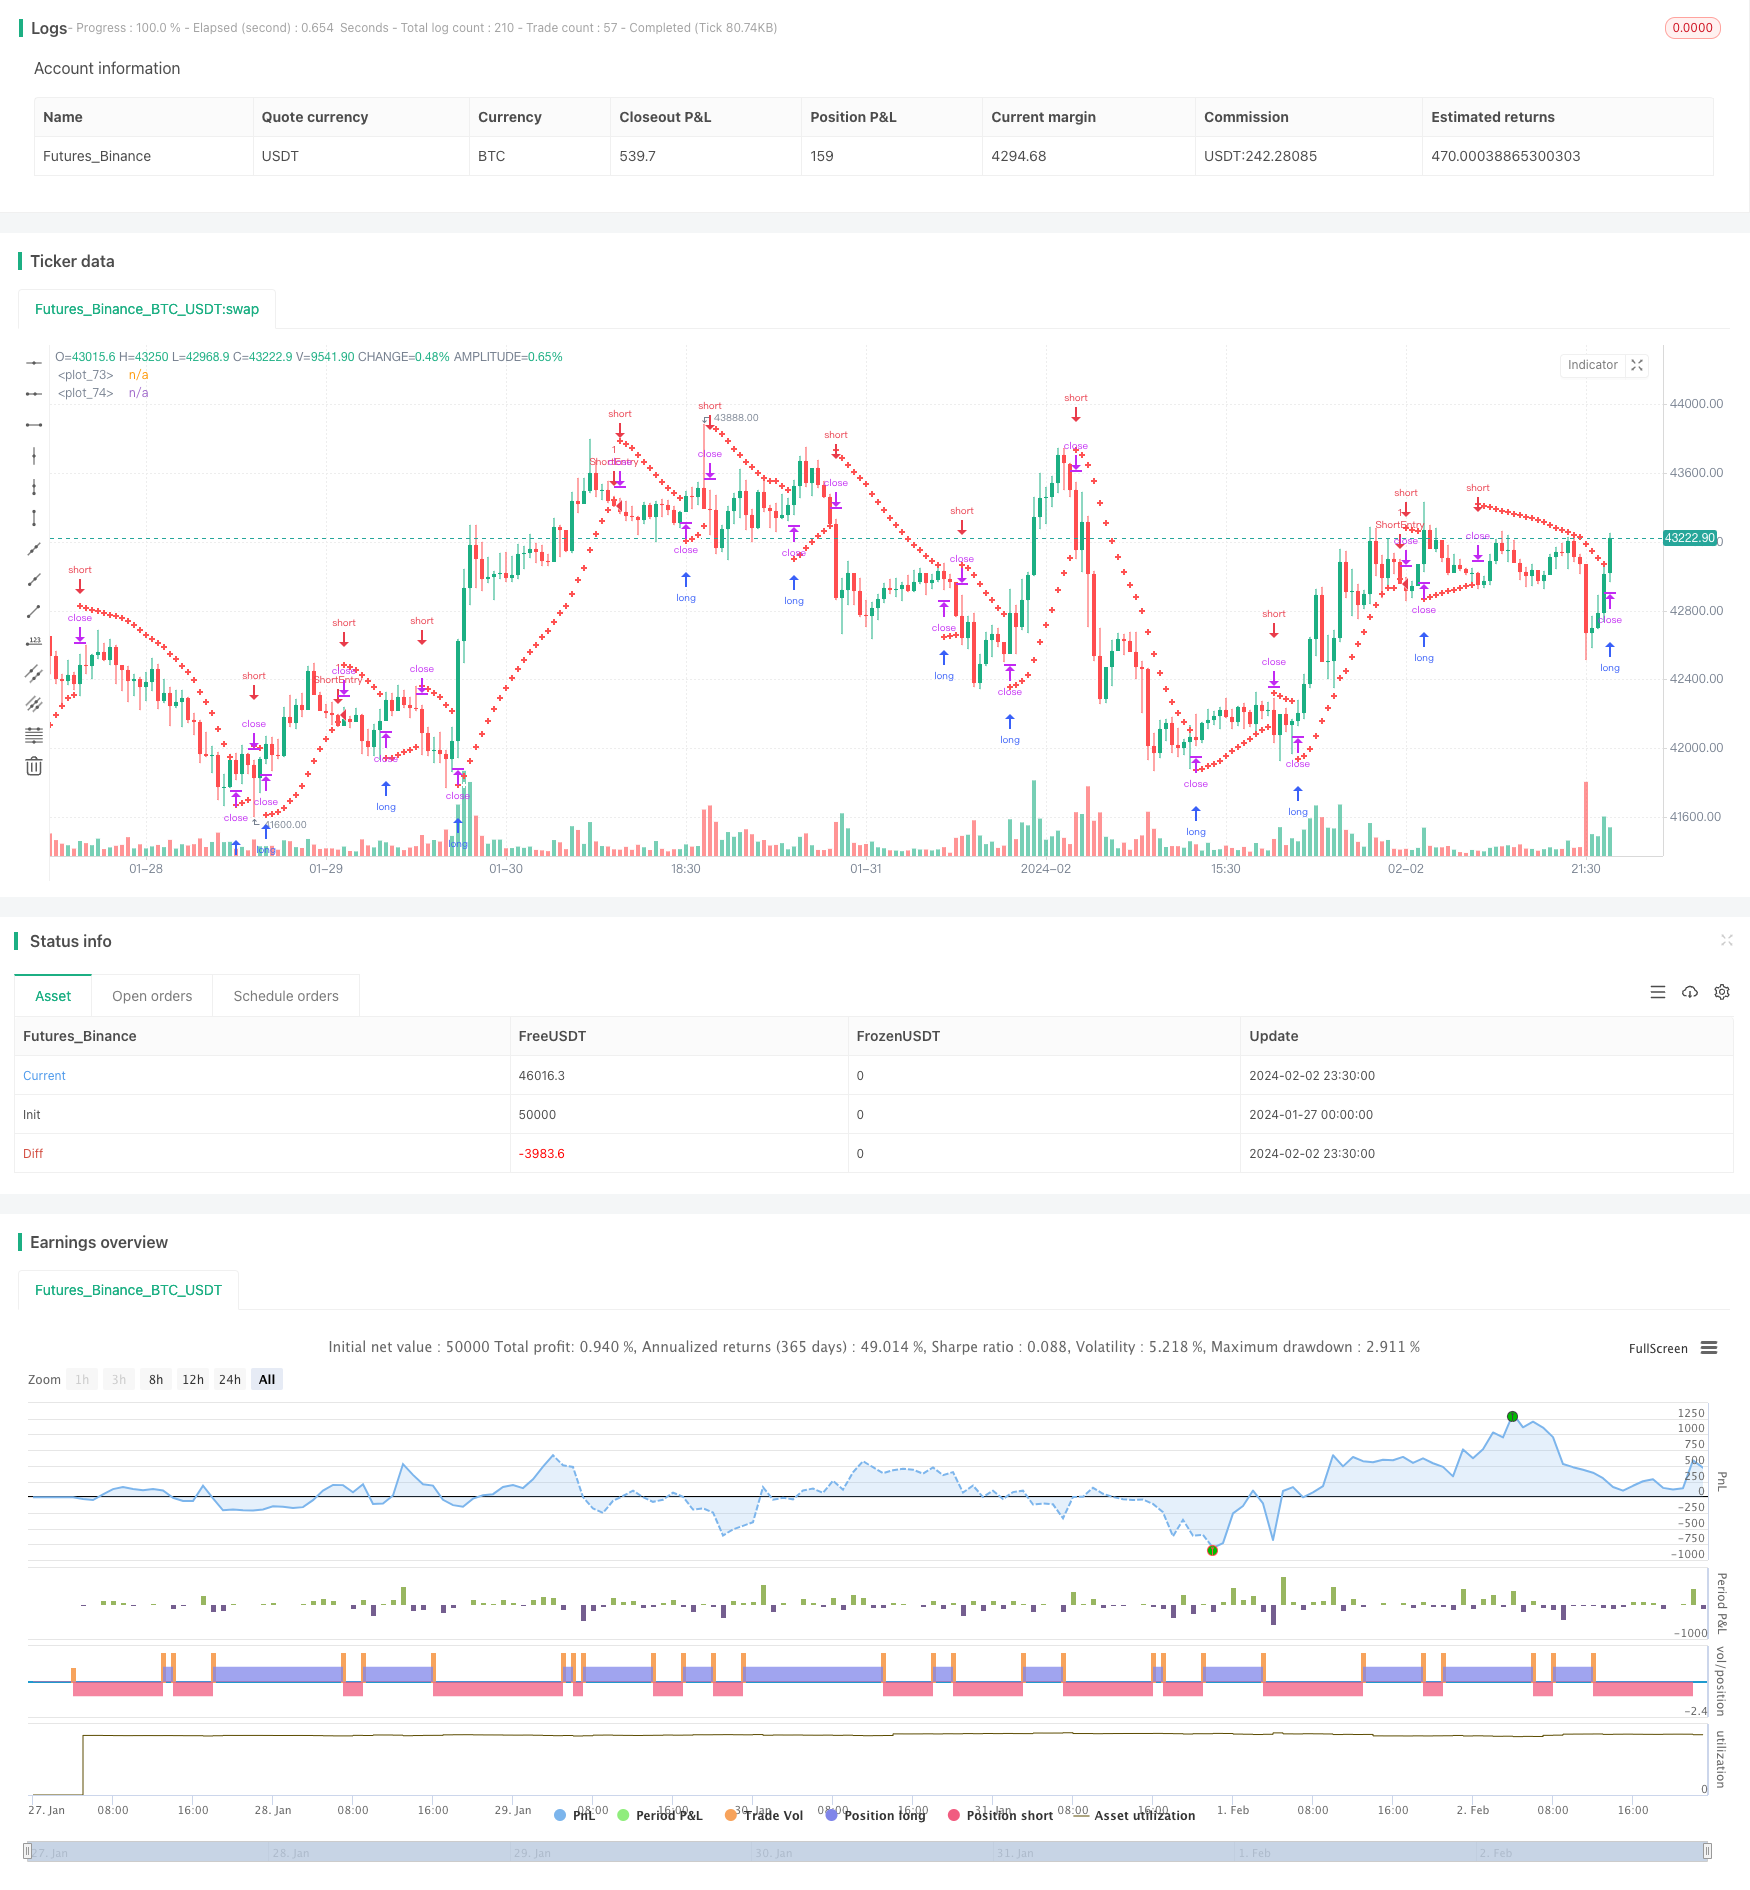
Name
基于SAR动量反转跟踪策略SAR-Momentum-Reversal-Tracking-Strategy
Author
ChaoZhang
Strategy Description
本文介绍了一种基于抛物线止损转向(Parabolic SAR)指标的动量反转跟踪策略。该策略利用 Parabolic SAR 指标识别 Nifty 期货市场中的潜在趋势反转,实现自动化的趋势跟踪交易。
该策略主要适用于偏好系统化交易方法的交易者,它提供清晰的入市和出市信号。通过捕捉市场趋势,该策略有助于实现交易者的财务目标。
该策略使用 Parabolic SAR 指标判断价格趋势方向。在看涨趋势中,SAR 值在价格突破之下,并随着新高点的出现而逐步上移;在看跌趋势中,SAR 值在价格突破之上,并随着新低点的出现而逐步下移。
当 SAR 值上穿或下穿价格时,表示潜在的趋势反转,该策略会相应地做空或做多以捕捉新的趋势方向。
具体来说,在初始计算出当前 SAR 值和加速因子后,策略持续追踪价格新高或新低,并相应调整 SAR 值。在获确认的K线上,如果是看涨趋势则在 SAR 值下方做空;如果是看跌趋势则在 SAR 值上方做多。
- 使用经典指标 Parabolic SAR 捕捉市场反转
- 提供清晰的系统化入市和出市信号
- 有助于跟踪趋势,获取额外的价格移动
- 自动化交易系统,无需人工决策
- SAR 指标并非百分之百可靠,可能出现错误信号
- 反转失败可能导致止损
- 需要考虑合约到期时间对策略的影响
- 需要考虑交易成本对策略盈利能力的影响
- 优化 SAR 指标参数(步长、初始值、最大值等)
- 结合其他反转信号指标(如 RSI、MACD 等)判断反转
- 增加条件逻辑(交易量等)过滤错误信号
- 考虑调整固定止损为追踪止损
- 考虑自动调整仓位规模
该策略提供了一种利用 Parabolic SAR 指标自动化捕捉市场趋势反转的交易系统。它为交易决策提供了清晰的入市出市信号,有助于跟踪趋势获利。但同时也需要考虑指标错误信号、止损风险等问题。通过持续优化,该策略有望成为一种可靠的趋势跟踪方法。
||
This article introduces a momentum reversal tracking strategy based on the Parabolic Stop and Reverse (SAR) indicator. This strategy utilizes the Parabolic SAR indicator to identify potential trend reversals in the Nifty Futures market for automated trend tracking trading.
The strategy is mainly suitable for traders who prefer a systematic trading approach, providing clear entry and exit signals. By capturing market trends, it helps traders achieve their financial goals.
The strategy uses the Parabolic SAR indicator to determine the price trend direction. In an uptrend, the SAR value is below the price and gradually moves up as new highs occur; In a downtrend, the SAR value is above the price and gradually moves down as new lows occur.
When the SAR value crosses above or below the price, it indicates a potential trend reversal and the strategy will take corresponding short or long positions to capture the new trend direction.
Specifically, after initially calculating the current SAR value and acceleration factor, the strategy keeps tracking new highs/lows and adjusts the SAR value accordingly. On a confirmed bar, if in an uptrend, it takes a short position below the SAR value; if in a downtrend, it takes a long position above the SAR value.
- Captures market reversals using the classic Parabolic SAR indicator
- Provides clear systematical entry and exit signals
- Helps tracking trends and capturing additional price movement
- Automated trading system without manual decision-making
- SAR indicator signals may not be 100% reliable, false signals could occur
- Failed reversals can cause stop loss
- Impact of contract expiry needs consideration
- Trading costs impact on strategy profitability
- Optimize SAR parameters (step, initial value, maximum value, etc.)
- Combine other reversal indicators (RSI, MACD etc.) to confirm reversals
- Add condition logics (volume etc.) to filter false signals
- Consider using trailing stops instead of fixed stops
- Consider auto-adjusting position sizing
The strategy provides an automated system to capture market trend reversals using the Parabolic SAR indicator. It gives clear entry and exit signals for trading decisions, helping profit from trend tracking. But issues like false signals, stop loss risks also need attention. With continuous optimization, it has the potential to become a reliable trend tracking method.
[/trans]
Strategy Arguments
| Argument | Default | Description |
|---|---|---|
| v_input_1 | 0.02 | initial |
| v_input_2 | 0.02 | step |
| v_input_3 | 0.2 | cap |
Source (PineScript)
/*backtest
start: 2024-01-27 00:00:00
end: 2024-02-03 00:00:00
period: 30m
basePeriod: 15m
exchanges: [{"eid":"Futures_Binance","currency":"BTC_USDT"}]
*/

//@version=5
strategy("Positional Parabolic SAR Strategy", overlay=true)
initial = input(0.02)
step = input(0.02)
cap = input(0.2)
var bool isUptrend = na
var float Extremum = na
var float SARValue = na
var float Accelerator = initial
var float futureSAR = na

if bar_index > 0
    isNewTrendBar = false
    SARValue := futureSAR
    if bar_index == 1
        float pastSAR = na
        float pastExtremum = na
        previousLow = low[1]
        previousHigh = high[1]
        currentClose = close
        pastClose = close[1]
        if currentClose > pastClose
            isUptrend := true
            Extremum := high
            pastSAR := previousLow
            pastExtremum := high
        else
            isUptrend := false
            Extremum := low
            pastSAR := previousHigh
            pastExtremum := low
        isNewTrendBar := true
        SARValue := pastSAR + initial * (pastExtremum - pastSAR)
    if isUptrend
        if SARValue > low
            isNewTrendBar := true
            isUptrend := false
            SARValue := math.max(Extremum, high)
            Extremum := low
            Accelerator := initial
    else
        if SARValue < high
            isNewTrendBar := true
            isUptrend := true
            SARValue := math.min(Extremum, low)
            Extremum := high
            Accelerator := initial
    if not isNewTrendBar
        if isUptrend
            if high > Extremum
                Extremum := high
                Accelerator := math.min(Accelerator + step, cap)
        else
            if low < Extremum
                Extremum := low
                Accelerator := math.min(Accelerator + step, cap)
    if isUptrend
        SARValue := math.min(SARValue, low[1])
        if bar_index > 1
            SARValue := math.min(SARValue, low[2])
    else
        SARValue := math.max(SARValue, high[1])
        if bar_index > 1
            SARValue := math.max(SARValue, high[2])
    futureSAR := SARValue + Accelerator * (Extremum - SARValue)
    if barstate.isconfirmed
        if isUptrend
            strategy.entry("ShortEntry", strategy.short, stop=futureSAR, comment="ShortEntry")
            strategy.cancel("LongEntry")
        else
            strategy.entry("LongEntry", strategy.long, stop=futureSAR, comment="LongEntry")
            strategy.cancel("ShortEntry")
plot(SARValue, style=plot.style_cross, linewidth=3, color=color.white)
plot(futureSAR, style=plot.style_cross, linewidth=3, color=color.red)
Detail
https://www.fmz.com/strategy/441011
Last Modified
2024-02-04 17:40:20
