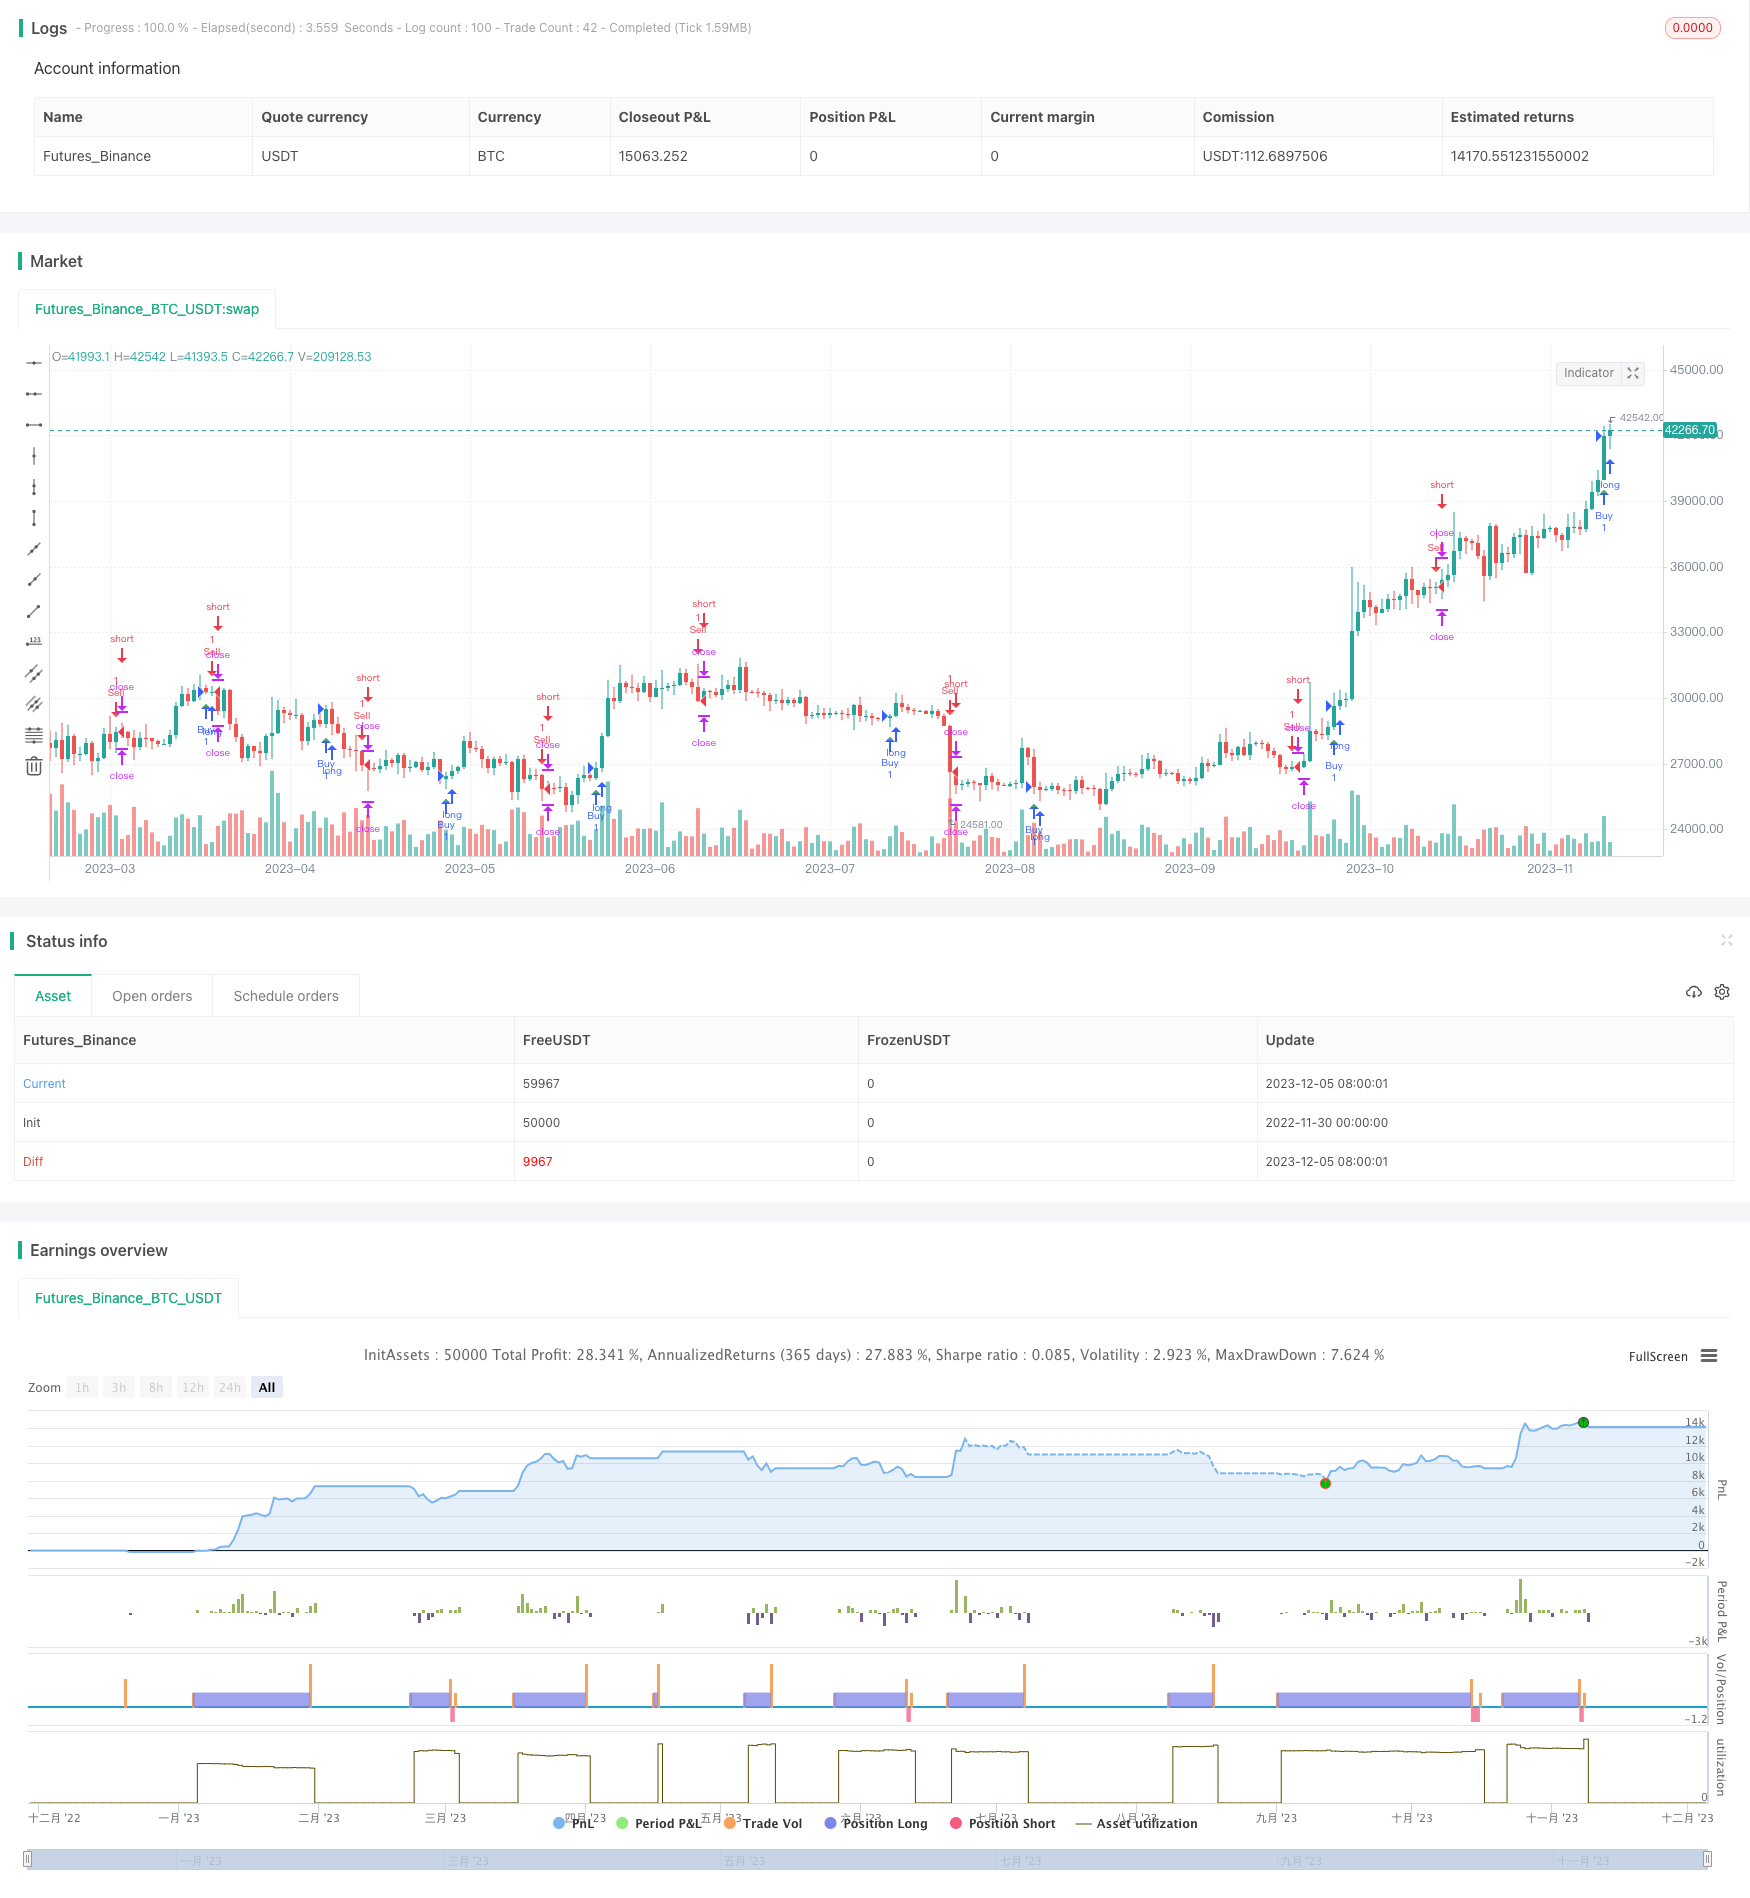
Name
基于SMA和EMA指标的短线交易策略Short-term-Trading-Strategy-Based-on-SMA-and-EMA
Author
ChaoZhang
Strategy Description
[trans]
本策略基于简单移动平均线(SMA)和指数移动平均线(EMA)这两个指标进行短线交易。当EMA上穿SMA时,进行买入操作;当SMA下穿EMA时,进行卖出操作。该策略适用于1分钟级别的高频交易。
该策略的核心指标是20期的SMA和21期的EMA。SMA指标能够有效地滤波价格中的随机波动, captures longer term trends。 EMA与SMA相比,对最近价格变化更加敏感,可以更早地发现新趋势的出现。
当EMA上穿SMA时,表示短期平均线上穿长期平均线,价格开始上涨,属于金叉信号,这是一个买入信号。当SMA下穿EMA时,表示长期平均线下穿短期平均线,价格开始下跌,属于死叉信号,是一个卖出信号。
该策略简单直接,容易理解和实现。只要捕捉到EMA和SMA的金叉死叉,就可以进行交易。
该策略具有以下优势:
-
使用了SMA和EMA两个广泛使用的简单指标,易于理解,容易实现。
-
采用了SMA和EMA指标的组合,使交易信号更加清晰。
-
适用于短线的高频交易,可以捕捉短期价格波动。
-
交易逻辑非常简单清晰,容易进行参数优化。
-
实现代码简洁,易于扩展和优化。
该策略也存在一些风险:
-
作用效果依赖参数选择,如果参数选择不当,可能出现过度交易或漏掉交易机会的情况。
-
在市场剧烈波动的时候,可能出现交易信号不明确或者产生错误信号的情况。
-
短期指标容易受到假突破的影响,可能导致不必要的损失。
-
高频交易需要充足的资金支持,否则存在超出最大损失的风险。
该策略可以从以下几个方面进行优化:
1.优化SMA和EMA的周期参数,找到最佳参数组合。可以通过遍历、遗传算法等方法寻优。
2.加入止损止盈策略,控制单笔损失和增加获利空间。
3.结合其他指标过滤假突破。例如KDJ、RSI等指标避免不必要的交易。
4.适当加入仓位控制,防止超出最大损失。
本策略基于SMA和EMA两个简单有效的指标,采用了组合指标的方法,形成比较清晰的交易信号。简单的交易逻辑使其易于实现和测试。同时该策略也存在一些风险,需要进一步测试和优化才能实际应用。总的来说,该策略为短线交易提供了有效的思路,值得进一步探索。
||
This strategy performs short-term trading based on two indicators - Simple Moving Average (SMA) and Exponential Moving Average (EMA). It generates buy signals when EMA crosses above SMA and sell signals when SMA crosses below EMA. The strategy is suitable for high-frequency trading at 1-minute timeframe.
The core indicators of this strategy are 20-period SMA and 21-period EMA. SMA can effectively filter out random price fluctuations and captures longer term trends. Compared with SMA, EMA reacts faster to recent price changes and can identify new trends earlier.
When EMA crosses above SMA, it indicates the short-term average line is above the long-term one and prices start to rise. This golden cross is a buy signal. When SMA crosses below EMA, it suggests the long-term average line is below the short-term one and prices start to decline. This death cross is a sell signal.
The strategy is simple and straightforward. By capturing the golden/death crosses between EMA and SMA, trading signals can be generated easily.
The advantages of this strategy include:
-
It uses two widely adopted simple indicators that are easy to understand and implement.
-
The combination of SMA and EMA generates clearer trading signals.
-
It is suitable for high-frequency short-term trading and captures short-term price swings.
-
The trading logic is very simple and clear, easy for parameter optimization.
-
The implementation code is concise and easy to expand and optimize.
There are also some risks of this strategy:
-
The performance relies heavily on parameter tuning. Improper parameters may lead to over-trading or missing trades.
-
Unclear or incorrect signals may occur during violent market fluctuation.
-
Short-term indicators are vulnerable to fake breakouts resulting in unnecessary losses.
-
High-frequency trading requires sufficient funding support, otherwise risks exceeding maximum loss.
The strategy can be further optimized from the following aspects:
-
Optimize the periods of SMA and EMA to find the best parameter combination using methods like grid search and genetic algorithms.
-
Incorporate stop loss and take profit to control single trade loss and increase profit space.
-
Combine with other indicators such as KDJ, RSI to filter out false breakouts.
-
Moderate position sizing to prevent exceeding maximum loss.
This strategy leverages SMA and EMA, two simple and effective indicators, and adopts a combination of indicators, generating clear trading signals. The simplicity of the logic makes it easy to implement and test. Meanwhile, there are still some risks of the strategy. Further testing and optimization are needed before real-world application. In conclusion, it provides an efficient idea for short-term trading and is worth exploring further.
[/trans]
Strategy Arguments
| Argument | Default | Description |
|---|---|---|
| v_input_1 | true | Stop Loss |
| v_input_2 | 2 | Take Profit |
Source (PineScript)
/*backtest
start: 2022-11-30 00:00:00
end: 2023-12-06 00:00:00
period: 1d
basePeriod: 1h
exchanges: [{"eid":"Futures_Binance","currency":"BTC_USDT"}]
*/

//@version=5
strategy("Cruce de SMA y EMA - Estrategia", overlay=true)

// Definición de variables
smaLength = 20
emaLength = 21

sma = ta.sma(close, smaLength)
ema = ta.ema(close, emaLength)

// Cruce de SMA y EMA hacia arriba (orden de compra)
buySignal = ta.crossover(ema, sma)

// Cruce de EMA y SMA hacia arriba (orden de venta)
sellSignal = ta.crossover(sma, ema)

// Configuración de la relación riesgo/recompensa
stopLoss = input(1, title="Stop Loss")
takeProfit = input(2, title="Take Profit")

// Gestión de órdenes
strategy.entry("Buy", strategy.long, when = buySignal)
strategy.entry("Sell", strategy.short, when = sellSignal)

strategy.exit("Take Profit/Stop Loss", from_entry = "Buy", stop = close * (1 - stopLoss/100), limit = close * (1 + takeProfit/100))
strategy.exit("Take Profit/Stop Loss", from_entry = "Sell", stop = close * (1 + stopLoss/100), limit = close * (1 - takeProfit/100))

// Marcado de señales en el gráfico
plotshape(buySignal, style=shape.triangleup, location=location.belowbar, color=color.green, title="Buy Signal")
plotshape(sellSignal, style=shape.triangledown, location=location.abovebar, color=color.red, title="Sell Signal")
Detail
https://www.fmz.com/strategy/434558
Last Modified
2023-12-07 15:29:12
