Name
基于SMA指标的短中期趋势跟踪策略Short-Mid-Term-Trend-Following-Strategy-Based-on-SMA-Indicators
Author
ChaoZhang
Strategy Description
[trans]
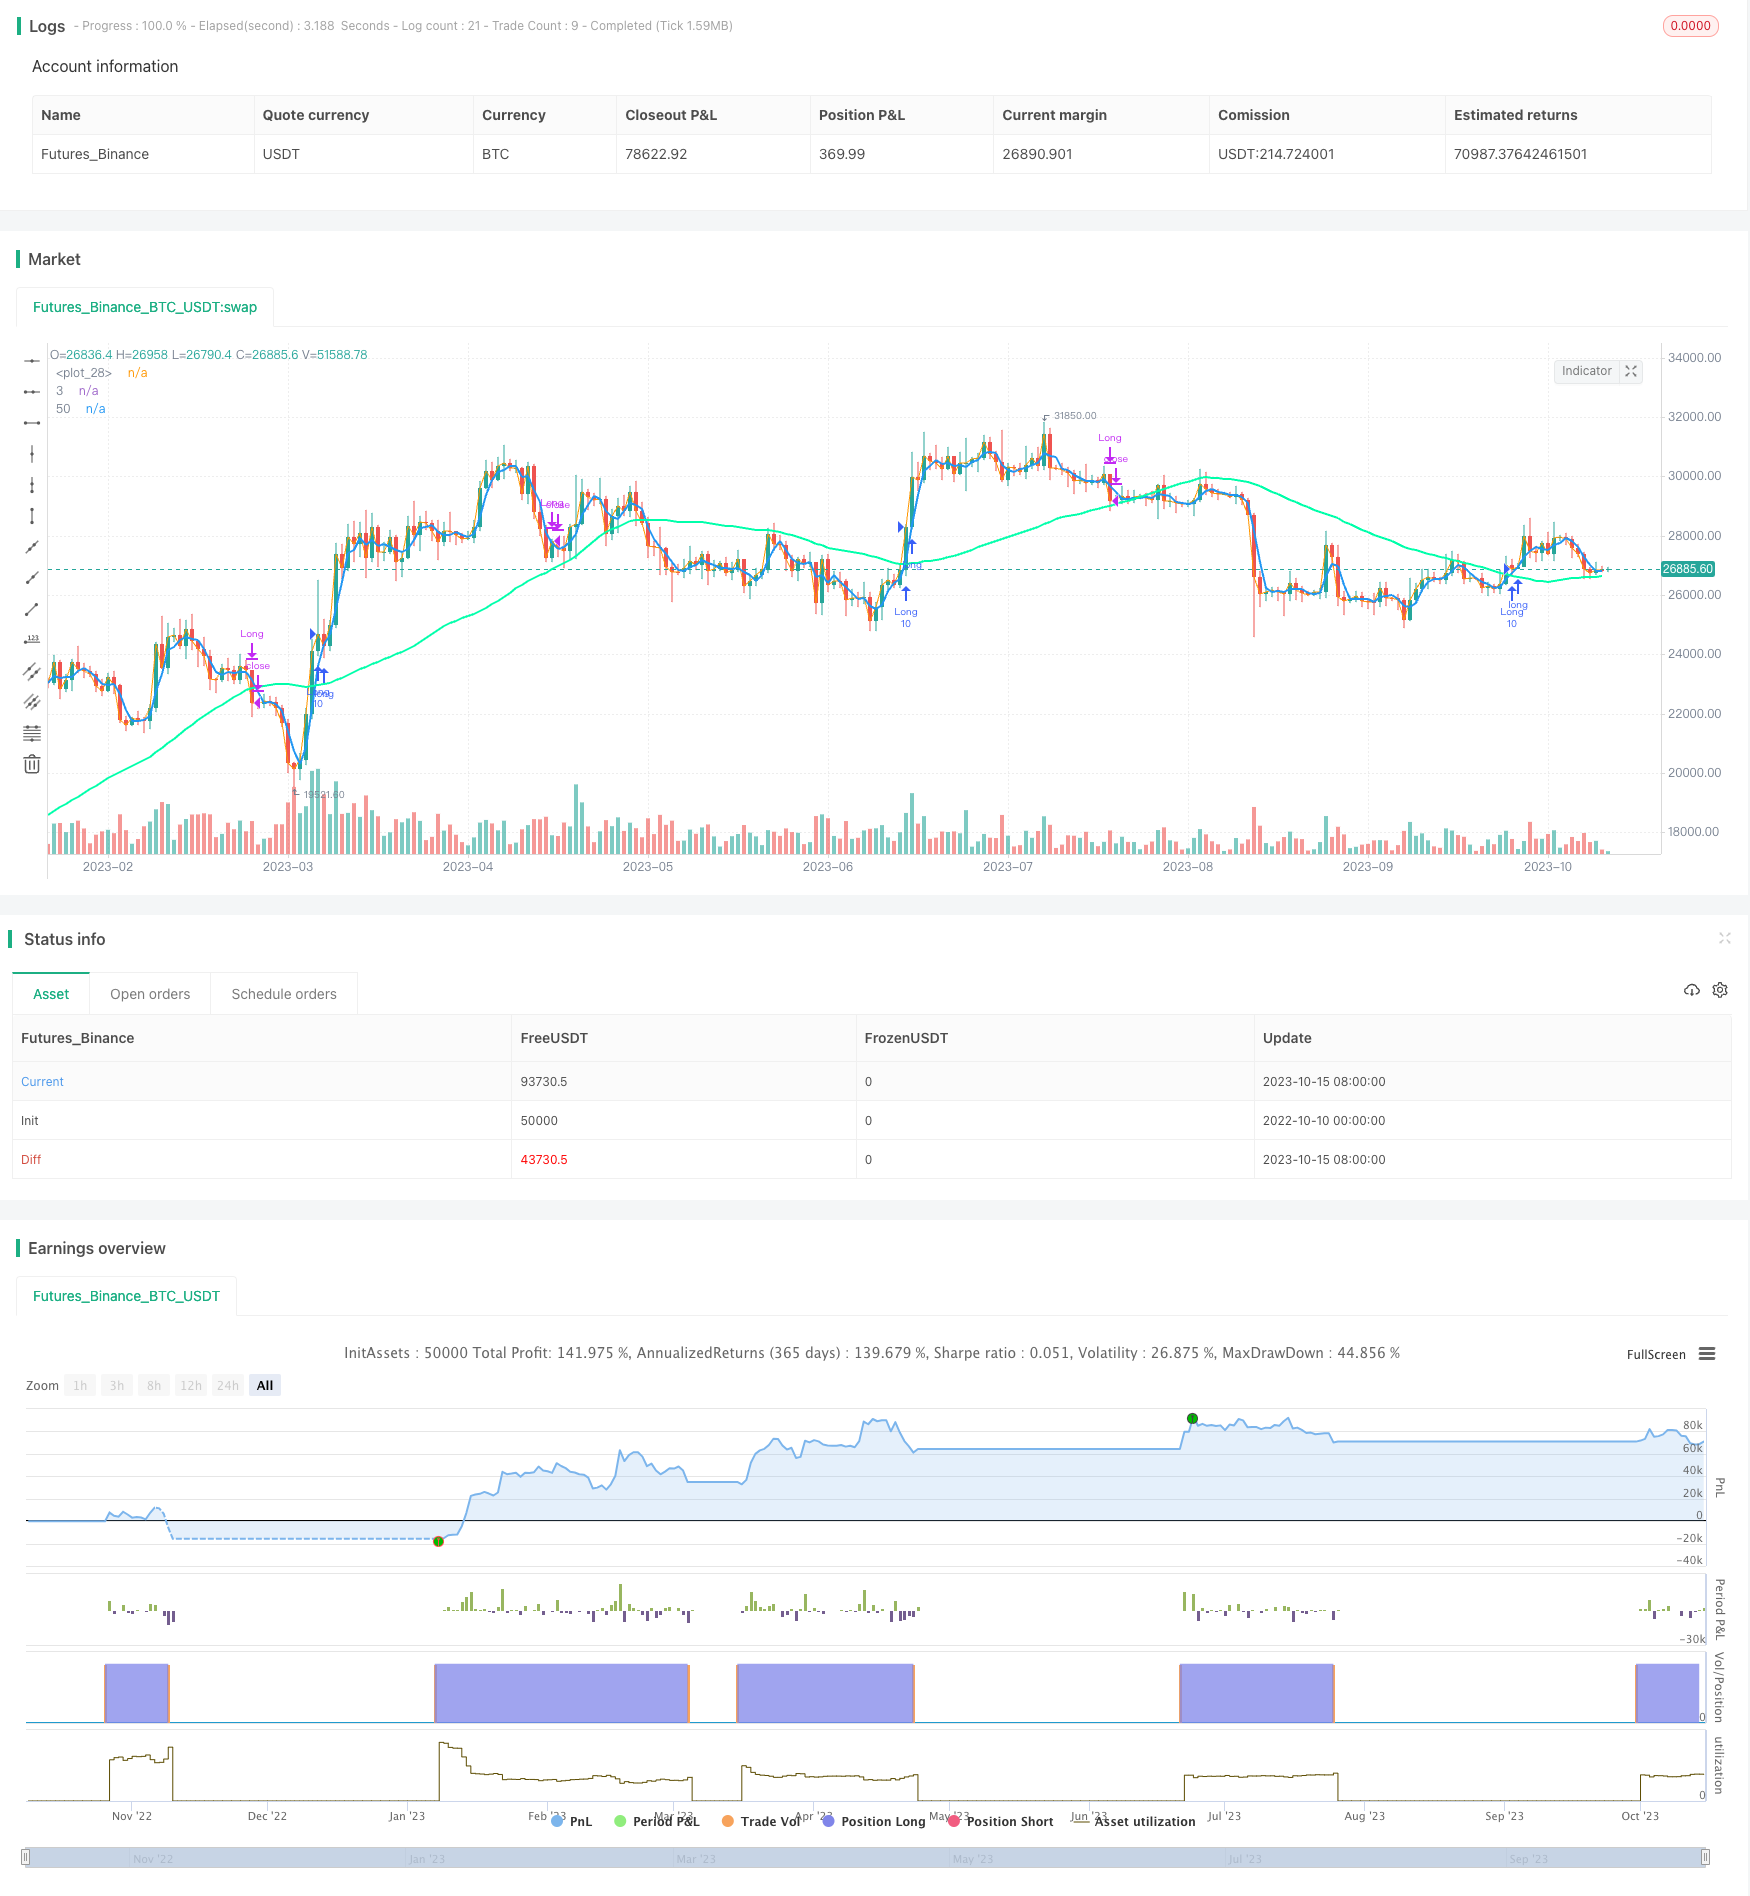
移动平均线交叉策略是一种趋势跟踪策略,通过计算不同周期的移动平均线,判断行情趋势方向,以发出买入和卖出信号。该策略使用3日和50日移动平均线交叉进行判断,当短期移动平均线上穿长期移动平均线时看涨买入,短期移动平均线下穿长期移动平均线时看跌卖出。
该策略通过计算3日和50日的简单移动平均线,当3日SMA上穿50日SMA时,表示短期趋势转为看涨,发出买入信号;当3日SMA下穿50日SMA时,表示短期趋势转为看跌,发出卖出信号。为了减少无谓的交易,该策略还加入了一个中期的40日SMA,如果3日SMA下穿40日SMA,也会发出卖出信号,快速止损。
该策略的关键在于使用不同周期的移动平均线划分市场波动的不同阶段,3日SMA表征的是最短期趋势,50日SMA表征中期趋势,它们的交叉表征短期和中期走势的转换,可以捕捉到价格在不同时间尺度上的变化。通过这种多时间轴的组合分析,可以比较准确地判断行情的转折点。
-
动量交叉清晰,信号比较明确。不同周期SMA的交叉可以有效判断短期和中期走势的变化,避免被市场的小幅震荡干扰。
-
通过快速止损sma3下穿sma40,可以减少损失,控制风险。
-
策略思路简单清晰,容易实现。指标和信号规则直接可操作。
-
可以灵活调整SMA的参数,适应不同的行情和交易品种。
-
在横盘和无明确趋势的市场中,SMA交叉信号频繁,可能导致过于频繁交易而增加交易成本和滑点损失。
-
SMA具有滞后性,交叉信号发出时,价格已经产生一定变化,容易让策略错过最佳买入卖出点位。
-
固定的SMA参数不适应所有行情,需要配合参数优化使用。
-
单一指标易受失效,可考虑加入其它技术指标或基本面指标进行组合验证。
-
优化SMA周期参数,寻找最佳参数组合
-
加入 stochastic,MACD等指标验证信号,避免假信号
-
根据市场变化调整开仓手数和止损幅度
-
考虑加入基本面指标,如财报、消息面等进行组合
-
结合量能指标,在高量突破时开仓
移动平均线交叉策略通过不同周期SMA的交叉判断市场短期和中期趋势的变化,采取趋势跟踪,属于较为简单直接的趋势策略。该策略优势是思路清晰,易于操作,可以通过参数优化和指标组合验证提高策略效果。但SMA本身具有滞后性,无法精确捕捉转折点。建议与其他先行指标组合使用,在大趋势下进行趋势跟踪获利。
||
The moving average crossover strategy is a trend following strategy that uses the crossover of different period moving averages to determine market trend direction and generate buy and sell signals. This strategy uses the crossover of 3-period and 50-period simple moving averages (SMA) to make judgments. When the short-term SMA crosses above the long-term SMA, it is considered a bullish signal to buy. When the short-term SMA crosses below the long-term SMA, it is considered a bearish signal to sell.
This strategy calculates the 3-period and 50-period simple moving averages. When the 3-day SMA crosses above the 50-day SMA, it indicates the short-term trend has turned bullish and a buy signal is generated. When the 3-day SMA crosses below the 50-day SMA, it indicates the short-term trend has turned bearish and a sell signal is generated. To reduce unnecessary trading, a 40-day median SMA is also added. If the 3-day SMA crosses below the 40-day SMA, a sell signal is also triggered for a quick stop loss.
The key to this strategy is using moving averages of different periods to divide market fluctuations into different stages. The 3-day SMA represents the shortest-term trend, the 50-day SMA represents the medium-term trend, and their crossover represents the conversion of short-term and medium-term trends, which can capture price changes across different time horizons. Through this multi-timeframe analysis, it can judge turning points in the market quite accurately.
-
Clear momentum crossover and explicit signals. Crossover of different period SMAs can effectively determine changes in short-term and medium-term trends, avoiding interference from minor market fluctuations.
-
Quick stop loss by SMA3 crossing below SMA40 reduces losses and controls risks.
-
Simple and clear strategy logic, easy to implement. Indicators and signal rules are directly actionable.
-
Flexibility to adjust SMA parameters for different market conditions and trading instruments.
-
Can incorporate other technical or fundamental indicators for combo validation to avoid false signals.
-
Frequent SMA crossover signals may lead to overtrading in sideways or non-trending markets, increasing costs.
-
SMA has lagging nature, signals may come after price has already moved substantially from ideal levels.
-
Fixed SMA parameters may not suit all market conditions, optimization needed.
-
Reliance on single indicator makes strategy vulnerable to failure.
-
Optimize SMA periods to find best parameter combinations.
-
Add oscillators like stochastic, MACD to validate signals and avoid false signals.
-
Adjust position sizing and stop loss based on changing market conditions.
-
Consider adding fundamental indicators like earnings, news.
-
Use volume indicators, enter on high volume breakouts.
The moving average crossover strategy judges changes in short-term and medium-term trends by crossing over different period SMAs, and takes trend following actions. It is a simple and direct trend following strategy. The advantages are its clear logic and ease of implementation. Performance can be enhanced through parameter optimization and combo validation. However, SMAs themselves have lagging nature and cannot precisely catch turns. It is recommended to combine with leading indicators and use for trend following in major trends.
[/trans]
Source (PineScript)
/*backtest
start: 2022-10-10 00:00:00
end: 2023-10-16 00:00:00
period: 1d
basePeriod: 1h
exchanges: [{"eid":"Futures_Binance","currency":"BTC_USDT"}]
*/

// This source code is subject to the terms of the Mozilla Public License 2.0 at https://mozilla.org/MPL/2.0/
// © Geduldtrader

//@version=4
strategy("MA Crossover", overlay = true)

start = timestamp(2009,2,1,0,0)

sma50 = sma(close, 50)
sma40 = sma(close, 40)
sma3 =  sma(close, 3)

plot(sma50,title='50', color=#00ffaa, linewidth=2)
plot(sma3,title='3', color=#2196F3, linewidth=2)

long = crossover(sma3,sma50)
neut = crossunder(close,sma50)
short = crossunder(sma3,sma40)

if time >= start
    strategy.entry("Long", strategy.long, 10.0, when=long)


strategy.close("Long", when = short)
strategy.close("Long", when = neut)


plot(close)
Detail
https://www.fmz.com/strategy/429470
Last Modified
2023-10-17 14:27:10
