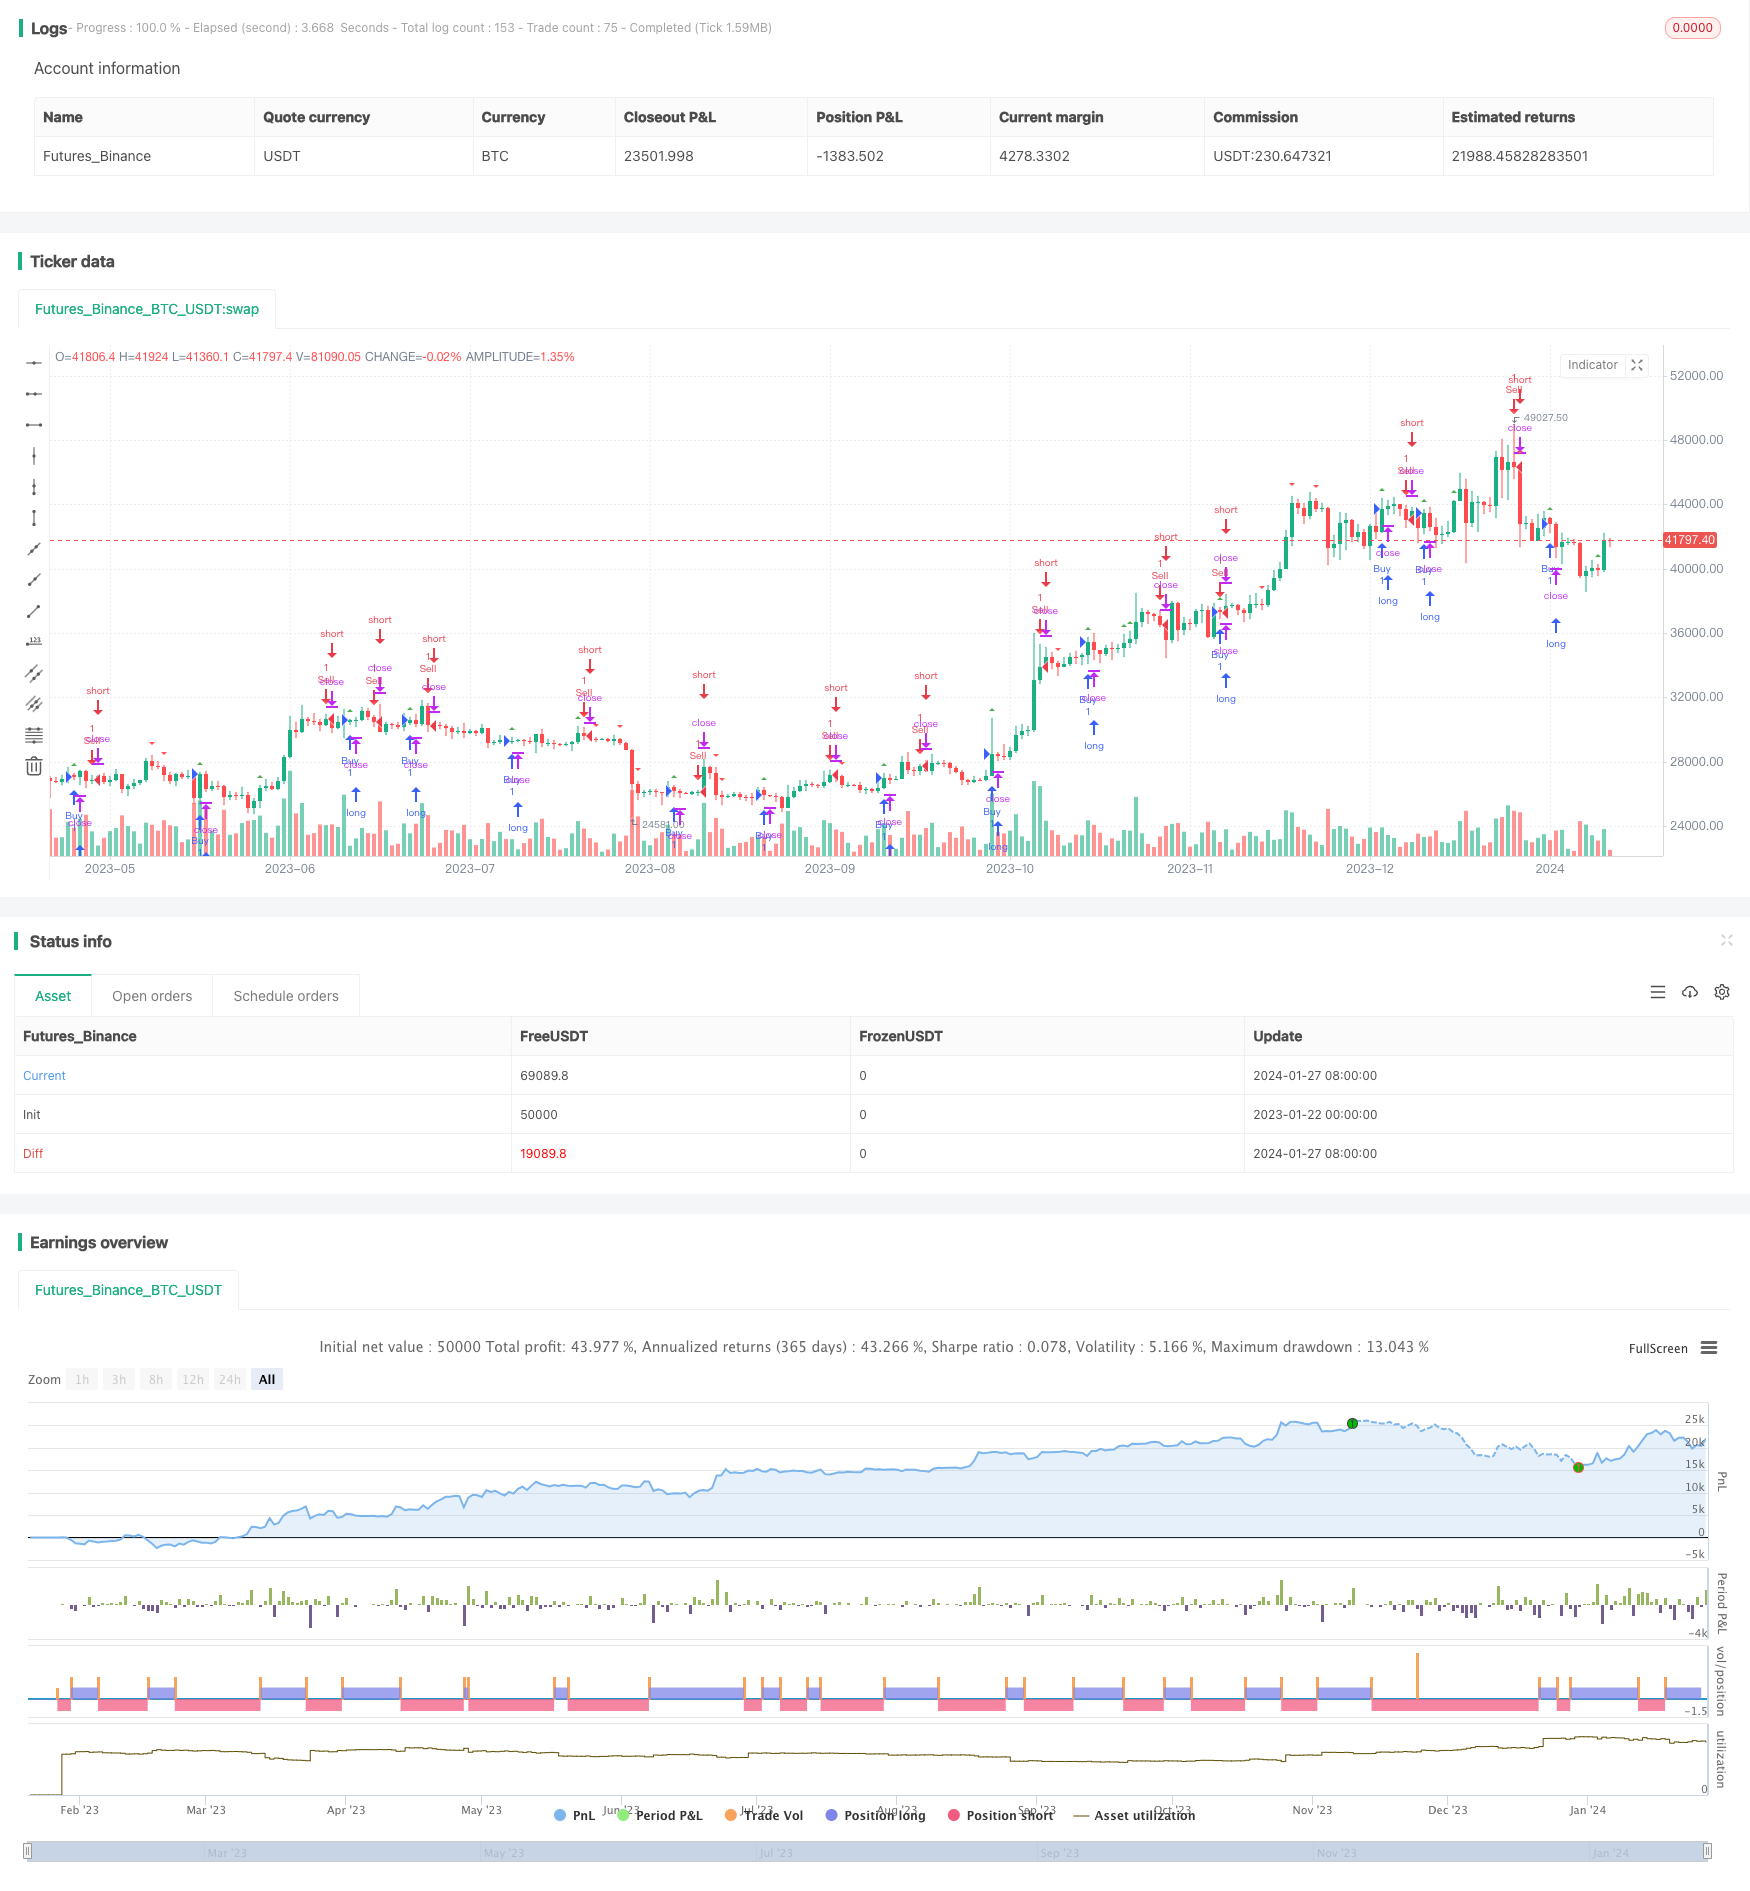
Name
基于Stoch-RSI和MFI的量化交易策略Quantitative-Trading-Strategy-Based-on-Stoch-RSI-and-MFI
Author
ChaoZhang
Strategy Description
该策略综合运用了Stochastic RSI和MFI两个指标来识别超买超卖现象,做出买入和卖出决策。其基本思路是在股票价格超买时考虑卖出;当股票价格超卖时考虑买入。
Stochastic RSI指标结合了随机指标(KDJ)和相对强弱指数(RSI)的优点。它先通过RSI计算出一段时间内的RSI数值,然后应用随机指标的方法来计算这个RSI数组的stochastics K和D值,从而判断RSI是否超买超卖。
Money Flow Index(MFI)指标则基于成交量和价格的变化判断市场供需关系和超买超卖情况。该指标认为,价格上涨是多头力量强于空头力量的体现,当波动加大时,多头力量强于空头力量,因此成交额上升预示着多头推动价格上涨。
本策略设置了Stochastic RSI的超买线和超卖线,以及MFI的超买线和超卖线。当Stochastic RSI指标的K线从下向上穿过超卖线或MFI指标从下向上穿过超卖线时产生买入信号;当Stochastic RSI指标的K线从上向下穿过超买线或MFI指标从上向下穿过超买线时产生卖出信号。
这种结合Stochastic RSI和MFI指标的策略,可以更可靠地识别市场的超买超卖现象,避免产生错误信号。
首先,Stochastic RSI指标本身就具有更高的可靠性和敏感性,相比普通随机指标更能准确判断超买超卖情况。 其次,MFI指标从成交量和价格变化的角度判断超买超卖,提供了另一个维度的参考,避免仅从一个角度判断的错误。
最后,Stochastic RSI和MFI指标具有互补性。Stochastic RSI更侧重于价格本身的变动判断,而MFI更侧重成交量和成交额的变化。两者结合使用,可以从更全面的角度判断市场状态,做出更准确可靠的交易决策。
该策略主要存在以下几个方面的风险:
-
指标发出错误信号的风险。尽管Stochastic RSI和MFI指标都具有较高的可靠性,但仍有可能在特定市场环境下发出错误的买入卖出信号,导致交易亏损。
-
超买超卖指标参数设置不当的风险。Stochastic RSI和MFI指标的参数设置会对交易信号产生很大影响,如果参数设置不当,会减弱指标的效用。
-
指标滞后信号的风险。Stochastic RSI和MFI指标多少会存在一定的滞后,可能错过最佳的买入卖出时机。
-
空仓期间的盘整风险。在指标没有发出信号的空仓期间,如果遇到了横盘整理的行情,会带来一定的机会成本损失。
对应风险的解决方案包括:调整指标参数、设置止损、缩减仓位、结合其他指标等。
该策略可从以下几个方面进行优化:
-
结合动量类指标,在Stochastic RSI和MFI指标信号基础上增加判断条件,避免在盘整期间交易。例如添加收盘价/成交量的突破判断。
-
添加止损机制。针对长线持仓增加移动止损,或短线交易时设置一定的点位止损,控制单笔损失。
-
优化参数设定。调整Stochastic RSI和MFI的参数长度、超买超卖线的位置等,使参数设置更贴合市场行情。
-
根据市场情况动态调整策略。识别趋势行情和盘整行情,在趋势行情中追踪趋势运行策略,在盘整行情中关掉策略避免交易。
-
结合机器学习算法自动优化。应用强化学习等算法根据回测结果动态调整参数和规则,实现策略的自动优化。
||
This strategy combines the Stochastic RSI and MFI indicators to identify overbought and oversold conditions and make buy and sell decisions. The basic idea is to consider selling when stock prices are overbought and consider buying when stock prices are oversold.
The Stochastic RSI indicator combines the advantages of the Stochastic Oscillator (KDJ) and the Relative Strength Index (RSI). It first calculates RSI values over a period of time through RSI, and then applies the Stochastic method to calculate the Stochastics K and D values of this RSI array to determine whether the RSI is overbought or oversold.
The Money Flow Index (MFI) indicator judges the market supply-demand relationship and overbought/oversold conditions based on changes in volume and price. The indicator believes that rising prices reflect the bullish forces being stronger than the bearish forces. When volatility increases, the bullish forces are stronger than the bearish forces, so increasing turnover heralds the bulls driving up prices.
This strategy sets overbought and oversold levels for Stochastic RSI and MFI. When the K line of the Stochastic RSI indicator crosses oversold line upward or the MFI indicator crosses oversold line upward, a buy signal is generated. When the K line of the Stochastic RSI indicator crosses overbought line downward or the MFI indicator crosses overbought line downward, a sell signal is generated.
This strategy of combining Stochastic RSI and MFI indicators can more reliably identify overbought/oversold conditions in the market and avoid generating wrong signals.
Firstly, the Stochastic RSI indicator itself has higher reliability and sensitivity, and can judge overbought/oversold conditions more accurately than the ordinary Stochastic Oscillator.
Secondly, the MFI indicator judges overbought/oversold conditions from the perspective of changes in volume and price, providing a reference from another dimension to avoid errors caused by judging from a single perspective.
Finally, Stochastic RSI and MFI indicators are complementary. Stochastic RSI focuses more on price changes itself to determine market conditions, while MFI focuses more on changes in volume and turnover. Using the two in combination allows judging market conditions from a more comprehensive perspective and making more accurate and reliable trading decisions.
The main risks of this strategy include:
-
The risk of indicators generating wrong signals. Although Stochastic RSI and MFI indicators both have high reliability, they may still generate wrong buy/sell signals in certain market environments, resulting in trading losses.
-
The risk of improper parameter settings for overbought/oversold indicators. The parameter settings of Stochastic RSI and MFI indicators have a great influence on trading signals. If the parameters are set improperly, it will weaken the utility of the indicators.
-
The risk of lagging signals from indicators. Stochastic RSI and MFI indicators more or less have some lag, which may miss the best buy/sell timing.
-
The risk of consolidation during vacant periods. If the market consolidates sideways during the vacant periods when indicators have not issued any signals, it will lead to some opportunity cost.
The solutions to corresponding risks include: adjusting indicator parameters, setting stop loss, reducing position size, incorporating other indicators, etc.
The strategy can be optimized in the following aspects:
-
Incorporate momentum indicators. Add judgment conditions based on momentum indicator signals on top of the Stochastic RSI and MFI indicator signals to avoid trading during consolidation periods. For example, adding breakout criteria for close price/volume.
-
Add stop loss mechanism. For long-term holdings, add moving stop loss. For short-term trading, set stop loss points to control single loss.
-
Optimize parameter settings. Adjust parameters of Stochastic RSI and MFI like length, position of overbought/oversold lines etc, so that parameter settings fit better with market conditions.
-
Dynamically adjust strategies according to market conditions. Identify trending and consolidating markets, run trend-following strategies during trending markets and disable strategies during consolidating markets to avoid unnecessary trading.
-
Incorporate machine learning algorithms to automatically optimize. Apply reinforcement learning algorithms to dynamically adjust parameters and rules based on backtest results to achieve automatic optimization of strategies.
[/trans]
Strategy Arguments
| Argument | Default | Description |
|---|---|---|
| v_input_1 | 14 | Stochastic RSI Length |
| v_input_2 | 3 | Stochastic RSI K |
| v_input_3 | 3 | Stochastic RSI D |
| v_input_4 | 70 | Stochastic RSI Overbought Level |
| v_input_5 | 20 | Stochastic RSI Oversold Level |
| v_input_6 | 14 | MFI Length |
| v_input_7 | 70 | MFI Overbought Level |
| v_input_8 | 20 | MFI Oversold Level |
Source (PineScript)
/*backtest
start: 2023-01-22 00:00:00
end: 2024-01-28 00:00:00
period: 1d
basePeriod: 1h
exchanges: [{"eid":"Futures_Binance","currency":"BTC_USDT"}]
*/

// This source code is subject to the terms of the Mozilla Public License 2.0 at https://mozilla.org/MPL/2.0/
// © carterac

//@version=5
strategy("MFI and Stoch RSI Bot", overlay=true)

// Stochastic RSI settings
length = input(14, title="Stochastic RSI Length")
smoothK = input(3, title="Stochastic RSI K")
smoothD = input(3, title="Stochastic RSI D")

// Stochastic RSI overbought and oversold levels
stochRSIOverbought = input(70, title="Stochastic RSI Overbought Level")
stochRSIOversold = input(20, title="Stochastic RSI Oversold Level")

// Money Flow Index (MFI) settings
mfiLength = input(14, title="MFI Length")
mfiOverbought = input(70, title="MFI Overbought Level")
mfiOversold = input(20, title="MFI Oversold Level")

// Calculate RSI
rsiValue = ta.rsi(close, 11)

// Calculate Stochastic RSI
rsiHigh = ta.highest(rsiValue, 11)
rsiLow = ta.lowest(rsiValue, 7)
k = ta.sma(100 * (rsiValue - rsiLow) / (rsiHigh - rsiLow), 3)
d = ta.sma(k, 3)

// Calculate MFI
mfiValue = ta.mfi(volume, mfiLength)

// Determine buy and sell signals
buyCondition = ta.crossover(k, stochRSIOversold) or ta.crossover(mfiValue, mfiOversold)
sellCondition = ta.crossunder(k, stochRSIOverbought) or ta.crossunder(mfiValue, mfiOverbought)

// Plotting signals
plotshape(buyCondition, location.belowbar, color=color.green, style=shape.triangleup, title="Buy Signal")
plotshape(sellCondition, location.abovebar, color=color.red, style=shape.triangledown, title="Sell Signal")

strategy.entry("Buy", strategy.long, when = buyCondition)
strategy.entry("Sell", strategy.short, when = sellCondition)
Detail
https://www.fmz.com/strategy/440298
Last Modified
2024-01-29 10:11:14
