Name
基于StochRSI的量化交易策略StochRSI-Based-Quantitative-Trading-Strategy
Author
ChaoZhang
Strategy Description
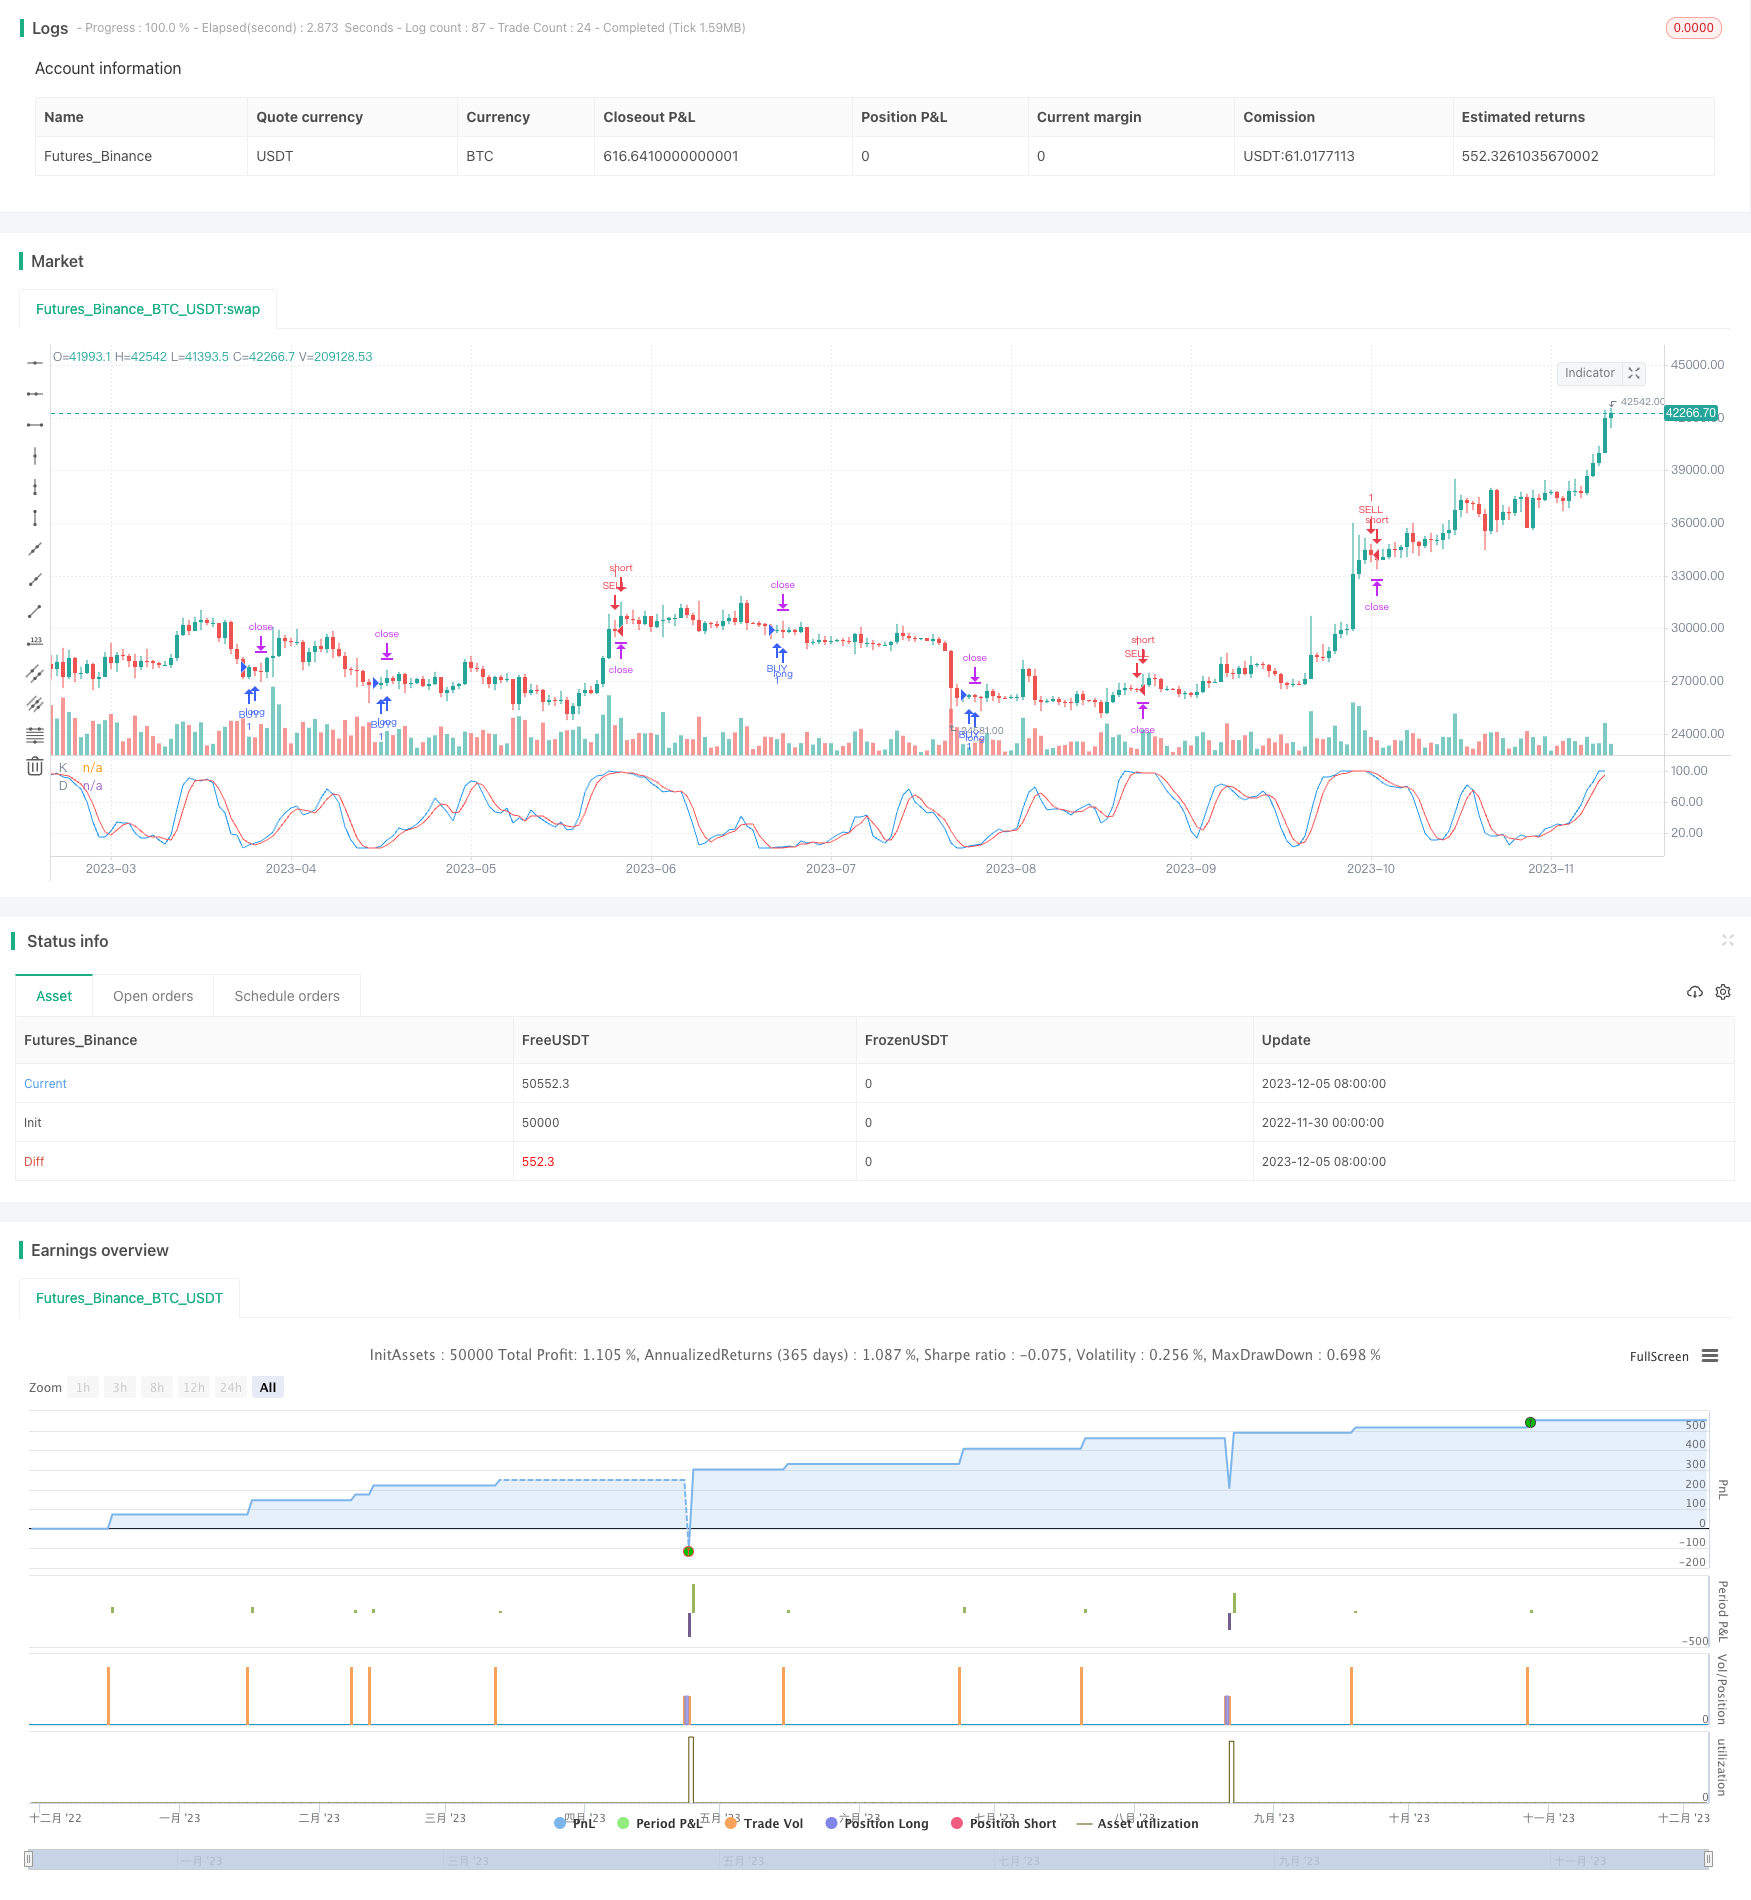
本策略基于StochRSI指标开发。该策略主要使用StochRSI指标判断超买超卖情况,结合RSI指标过滤掉一些虚假信号,在StochRSI指标显示超卖区域时做空,显示超卖区域时做多,实现获利。
本策略主要应用StochRSI指标判断市场超买超卖区域。StochRSI指标由K线和D线组成,其中K线反映当前RSI的值在最近一段时期RSI价格范围中的位置,D线是K线的移动平均线。当K线上穿D线时为超卖区域,这时可以做多;当K线下穿D线时为超卖区域,这时可以做空。
具体来说,策略首先计算长度为14的RSI指标的值,然后在RSI指标上应用StochRSI指标。StochRSI指标参数设置长度为14,平滑周期K线为3,D线也为3。当K线上穿用户设定的超卖区域(默认为1)时,做多;当K线下穿用户设定的超卖区域(默认为99)时,做空。
此外,策略还设置了止损和止盈参数。止损参数默认为10000;止盈根据参数设置为曲线trailing stop,默认后踪点数为300,偏移量为0。
- 使用StochRSI指标判断超买超卖区域,相比单一RSI指标更可靠
- 结合RSI过滤信号,避免虚假突破
- 设置止损止盈机制控制风险
- StochRSI指标存在头假信号的可能
- 需要合理设置超买超卖参数,否则将误操作
- 止损点过小容易被套,止盈点过大可能获得收益有限
针对以上风险,可以设置更长的参数周期或考虑与其他指标组合使用来过滤信号,调整超买超卖参数适应不同市场,以及测试不同的止损止盈参数。
- 可以考虑与其他指标组合使用,例如MACD、布林线等,用以过滤假信号
- 可以测试不同的参数周期设置,以适应更多市场情况
- 可以优化止损止盈点,在回测中多次测试,找到最优参数
本策略基于StochRSI指标判断超买超卖区域进行交易。相比单一RSI指标,StochRSI结合KDJ的思想,能更准确判断转折点。同时结合RSI过滤假信号,并设置止损止盈控制风险。优化空间还很大,可与其他指标组合使用,或优化参数设置。
||
This strategy is developed based on the StochRSI indicator. The strategy mainly uses the StochRSI indicator to judge overbought and oversold situations. Combined with the RSI indicator to filter out some false signals, go short when the StochRSI indicator shows overbought area and go long when it shows oversold area to make profits.
This strategy mainly applies the StochRSI indicator to judge overbought and oversold areas in the market. The StochRSI indicator consists of the K line and the D line. The K line reflects the position of the current RSI value in the RSI price range over a recent period. The D line is the moving average of the K line. When the K line crosses above the D line, it is an overbought area and long positions can be taken. When the K line falls below the D line, it is an oversold area and short positions can be taken.
Specifically, the strategy first calculates the value of the 14-period RSI indicator, and then applies the StochRSI indicator on the RSI indicator. The StochRSI indicator parameters are set with a length of 14, smoothed K line period of 3 and smoothed D line period of 3. When the K line crosses above the user-defined oversold area (default is 1), long position will be taken. When the K line falls below the user-defined overbought area (default is 99), short position will be taken.
In addition, stop loss and take profit parameters are set in the strategy. The stop loss is default to 10000. The take profit uses trailing stop with default trailing points of 300 and offset of 0.
- Using StochRSI indicator to determine overbought and oversold areas is more reliable than single RSI indicator
- Filtering signals with RSI avoids false breakouts
- Setting stop loss and take profit mechanisms to control risks
- StochRSI indicator may have false signals
- Need to set overbought and oversold parameters reasonably, otherwise it will cause misoperation
- If stop loss point is too small, it’s easy to be trapped. If take profit point is too large, the profit gaining may be limited.
For the above risks, longer cycle parameters can be set or consider using in combination with other indicators to filter out signals, adjust overbought and oversold parameters to adapt to different markets, and test different stop loss and take profit parameters.
- Consider using in combination with other indicators such as MACD, Bollinger Bands etc to filter out false signals
- Test different parameter cycle settings to adapt to more market conditions
- Optimize stop loss and take profit points by multiple backtestings to find the optimal parameters
This strategy trades based on overbought and oversold areas judged by the StochRSI indicator. Compared with single RSI indicator, StochRSI combines the idea of KDJ and can judge turning points more accurately. At the same time, false signals are filtered out by RSI and risks are controlled by stop loss and take profit. There is still large room for optimization, it can be combined with other indicators or optimized parameter settings.
[/trans]
Strategy Arguments
| Argument | Default | Description |
|---|---|---|
| v_input_1 | 10 | lengthrsi |
| v_input_2 | true | overSold |
| v_input_3 | 99 | overBought |
| v_input_4 | 300 | call_trail_stop |
| v_input_5 | false | call_trail_offset |
| v_input_6 | 10000 | call_sl |
| v_input_7 | 3 | smoothK |
| v_input_8 | 3 | smoothD |
| v_input_9 | 14 | lengthRSI |
| v_input_10 | 14 | lengthStoch |
| v_input_11_close | 0 | RSI Source: close |
Source (PineScript)
/*backtest
start: 2023-11-06 00:00:00
end: 2023-12-06 00:00:00
period: 1h
basePeriod: 15m
exchanges: [{"eid":"Futures_Binance","currency":"BTC_USDT"}]
*/

//@version= 2
strategy("STOCHRSI JURE", overlay=false)
lengthrsi = input(10)
overSold = input( 1 )
overBought = input(99)

call_trail_stop = input(300)
call_trail_offset = input(0)
call_sl = input(10000)

price = ohlc4
vrsi = rsi(price, lengthrsi)

smoothK = input(3, minval=1)
smoothD = input(3, minval=1)
lengthRSI = input(14, minval=1)
lengthStoch = input(14, minval=1)
src = input(close, title="RSI Source")

rsi1 = rsi(src, lengthRSI)
k = sma(stoch(rsi1, rsi1, rsi1, lengthStoch), smoothK)
d = sma(k, smoothD)


plot( k, color=blue, linewidth=1, title="K")
plot( d, color=red, linewidth=1, title="D")

if (crossover(k, overSold) )
    strategy.entry("BUY", strategy.long, stop=close, oca_name="TREND",  comment="BUY")
    strategy.exit("BUY EXIT", "BUY", trail_points=call_trail_stop, trail_offset=call_trail_offset, loss = call_sl)


if (crossunder(k, overBought) )
    strategy.entry("SELL", strategy.short,stop=close, oca_name="TREND", comment="SELL")
    strategy.exit("SELL EXIT", "SELL", trail_points=call_trail_stop, trail_offset=call_trail_offset, loss = call_sl)


//if (  ( crossover(k,d)) and ( (vrsi<overSold) or crossover(vrsi,overSold) )  and   year >= yearfrom and year <= yearuntil and month>=monthfrom and month <=monthuntil and dayofmonth>=dayfrom and dayofmonth < dayuntil)
//    strategy.entry("BUY", strategy.long, stop=close, oca_name="TREND", oca_type=strategy.oca.cancel, comment="BUY")
//else
//    strategy.cancel(id="BUY")

//if ( ( crossunder(k,d) ) and ( (vrsi >overBought) or crossunder(vrsi,overBought) ) and   year >= yearfrom and year <= yearuntil and month>=monthfrom and month <=monthuntil and dayofmonth>=dayfrom and dayofmonth < dayuntil )
//    strategy.entry("SELL", strategy.short,stop=close, oca_name="TREND", oca_type=strategy.oca.cancel, comment="SELL")
//else
//    strategy.cancel(id="SELL")
Detail
https://www.fmz.com/strategy/434567
Last Modified
2023-12-07 16:05:17
