Name
基于T3和CCI指标的趋势追踪策略T3-CCI-Trend-Tracking-Strategy
Author
ChaoZhang
Strategy Description
[trans]
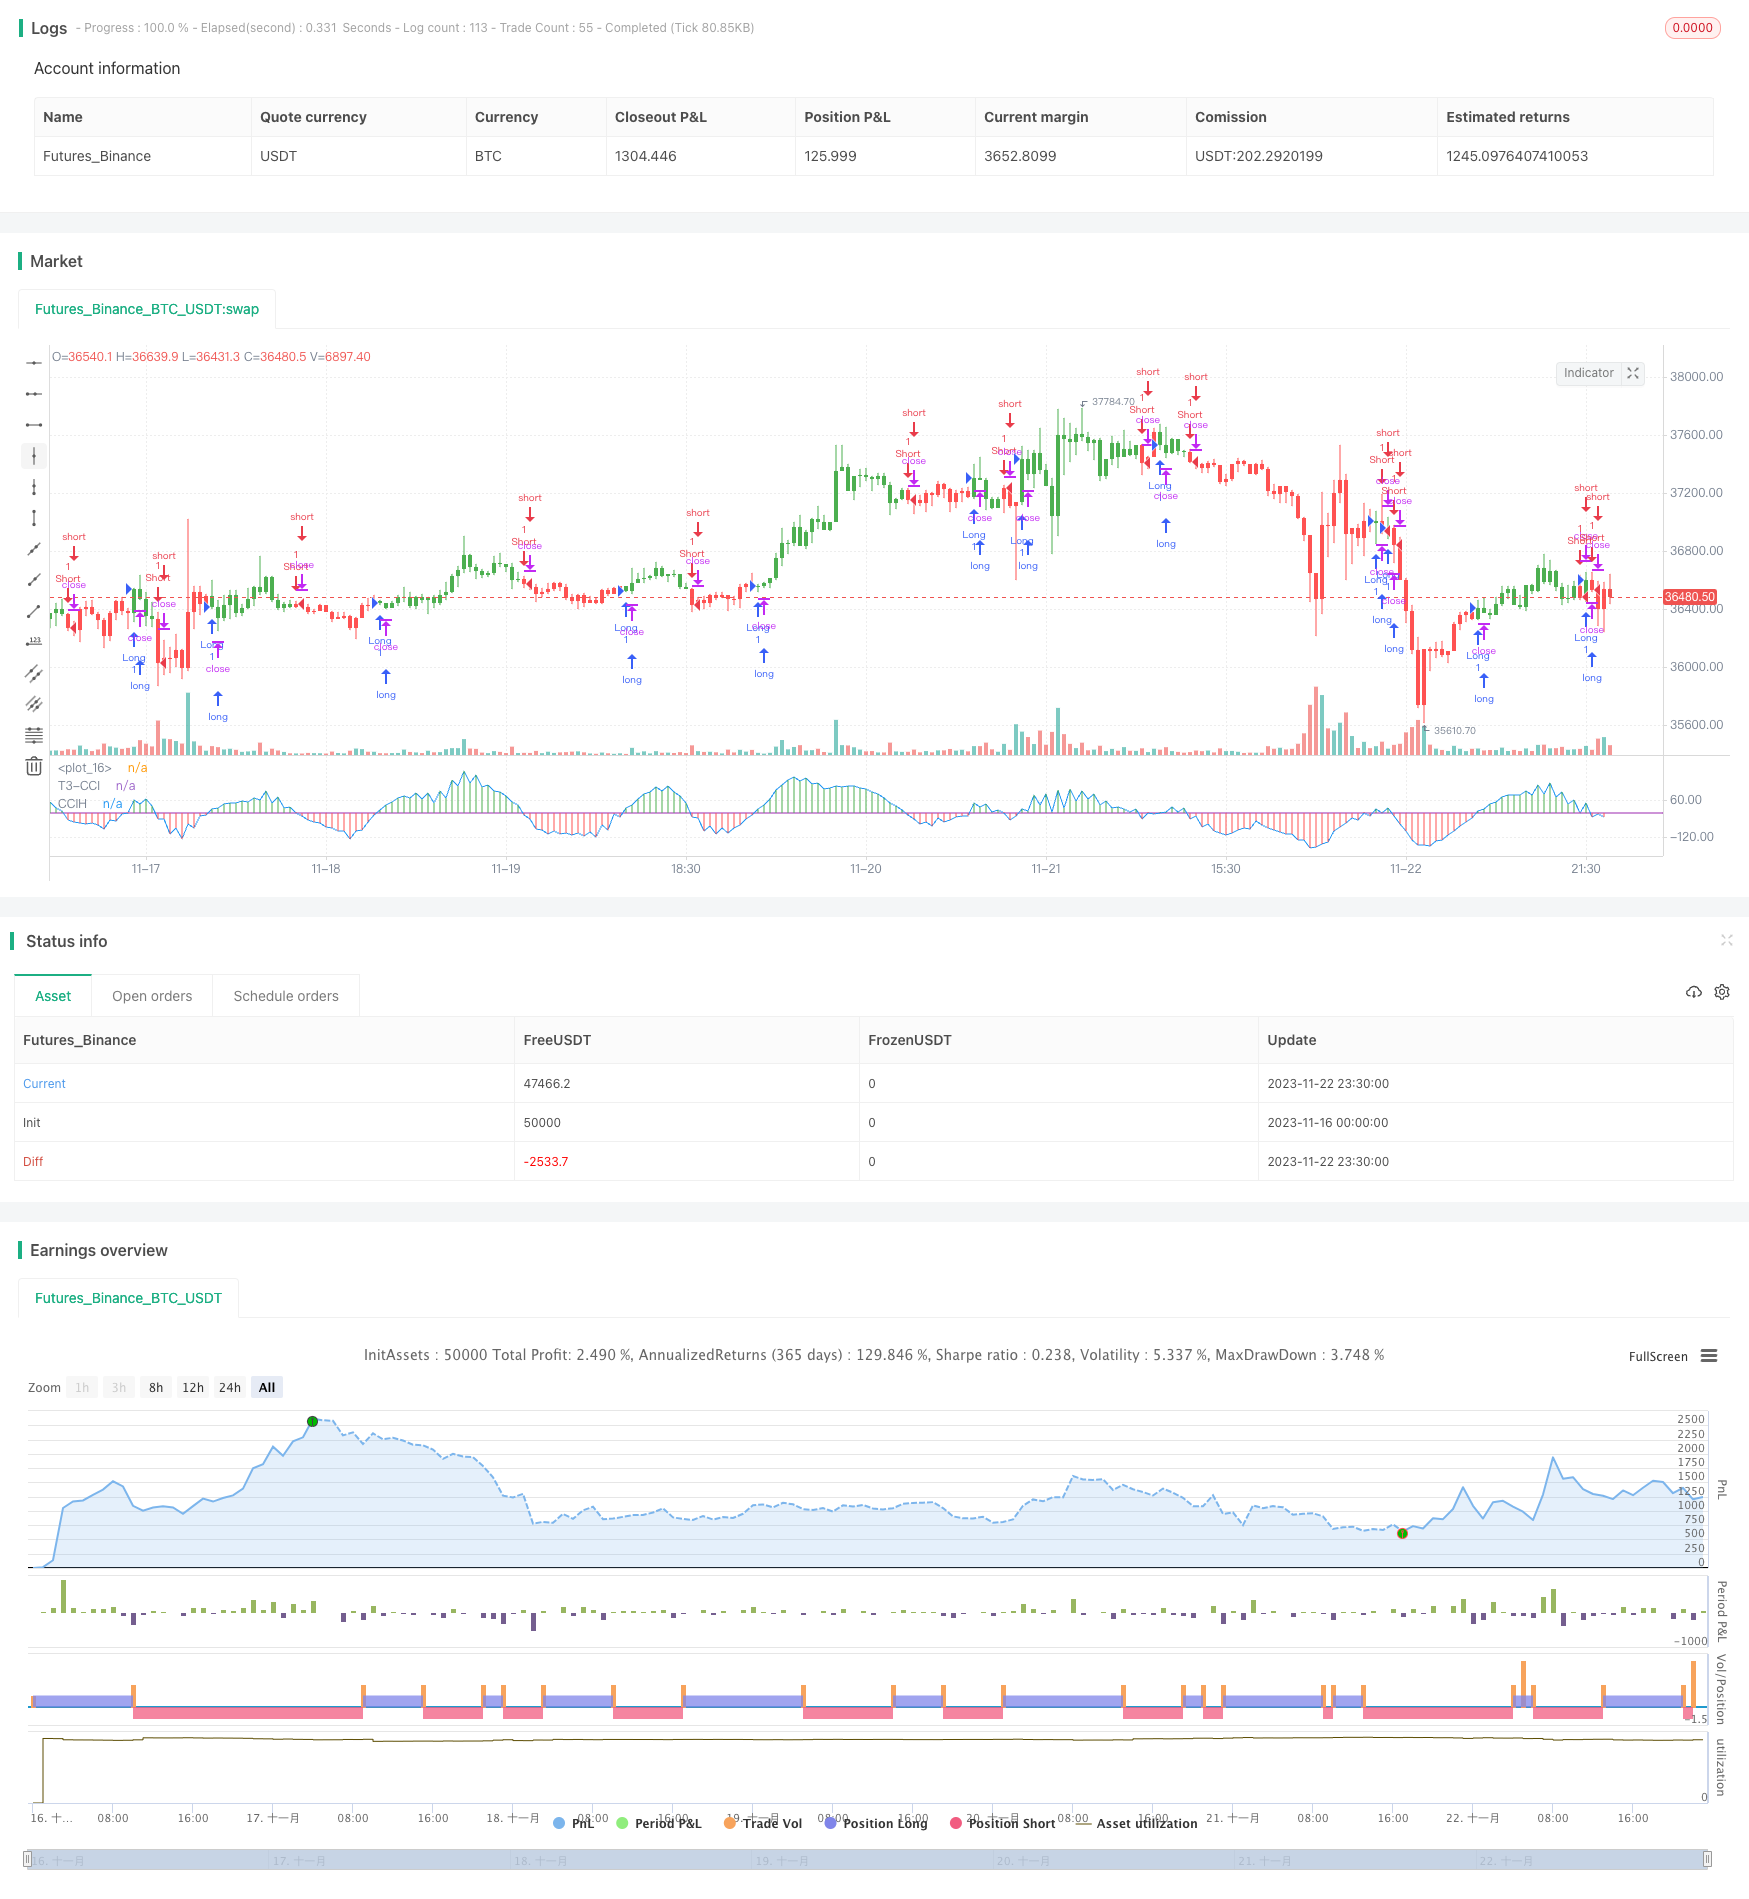
这是一个利用T3平滑移动平均线和CCI指标实现趋势追踪的量化策略。该策略通过计算T3-CCI指标来识别趋势,并在获得双重确认信号时入市,以追踪趋势。
该策略首先计算出T3平滑移动平均线和CCI指标。然后将CCI指标通过一系列滤波计算成T3-CCI指标。当T3-CCI指标上穿0轴线时产生买入信号,下穿0轴线时产生卖出信号。为了过滤假信号,该策略要求T3-CCI指标连续两个周期保持同一信号才会下单。
具体来说,该策略采用以下步骤:
- 计算CCI指标和T3指标
- 将CCI指标通过一系列数字滤波器转换为T3-CCI指标
- 判断T3-CCI指标的多空状态
- 等待两个bar的持续信号作为入市信号
该策略具有以下优势:
- 利用T3指标有效平滑CCI指标,过滤市场噪音
- 采用双重确认机制,避免产生假信号
- 追踪中长线趋势,避开短期回调
该策略也存在一定的风险:
- 在震荡行情中容易产生假信号
- 双重确认机制可能错过短线机会
- 大幅趋势反转时止损风险较大
对策:
- 调整CCI和T3参数,优化指标效果
- 可以适当缩短确认周期,或同时运行快慢参数组合
- 采用移动止损或及时止损,控制单笔损失
该策略可以从以下几个方向进行优化:
- 调整CCI和T3参数,适应不同周期和市场
- 增加趋势判断指标,提高信号质量
- 基于波动率自动调整止损位置
- 利用机器学习方法动态优化参数
该策略整体来说是一个可靠的中长线趋势追踪策略。它利用双重确认和趋势跟踪特点控制了风险,可以作为趋势交易的基础策略。通过参数和规则优化,可以进一步提高策略表现。
||
This is a quantitative strategy that utilizes the T3 smoothed moving average line and CCI indicator to track trends. The strategy identifies trends by calculating the T3-CCI indicator and enters the market after obtaining double confirmation signals to follow trends.
The strategy first calculates the T3 smoothed moving average line and CCI indicator. It then converts the CCI indicator into the T3-CCI indicator through a series of filtering calculations. It generates a buy signal when the T3-CCI indicator crosses above the 0 axis and a sell signal when crossing below the 0 axis. To filter out false signals, the strategy requires the T3-CCI indicator to maintain the same signal for two consecutive periods before placing an order.
Specifically, the strategy takes the following steps:
- Calculate the CCI indicator and T3 indicator
- Convert the CCI indicator into the T3-CCI indicator through a series of digital filters
- Judge the long/short state of the T3-CCI indicator
- Wait for persistent signals over two bars as entry signals
The strategy has the following advantages:
- Effectively smooths the CCI indicator using the T3 indicator to filter out market noise
- Adopts a double confirmation mechanism to avoid false signals
- Tracks medium-to-long-term trends and avoids short-term pullbacks
The strategy also has some risks:
- It is prone to generating false signals in range-bound markets
- The double confirmation mechanism may miss short-term opportunities
- High risk of stop loss in major trend reversals
Countermeasures:
- Adjust CCI and T3 parameters to optimize indicator performance
- Appropriately shorten confirmation periods or run fast/slow parameter combinations simultaneously
- Adopt moving stop loss or timely stop loss to control single transaction loss
The strategy can be optimized in the following directions:
- Adjust CCI and T3 parameters to suit different cycles and markets
- Increase trend judgment indicators to improve signal quality
- Automatically adjust stop loss position based on volatility
- Dynamically optimize parameters using machine learning methods
Overall, this is a reliable medium-to-long-term trend tracking strategy. It controls risks with double confirmation and trend tracking features, and can serve as a basic trend trading strategy. Further performance improvement can be achieved through parameter and rule optimization.
[/trans]
Strategy Arguments
| Argument | Default | Description |
|---|---|---|
| v_input_1 | 14 | CCI_Period |
| v_input_2 | 5 | T3_Period |
| v_input_3 | 0.618 | b |
| v_input_4 | false | Trade reverse |
Source (PineScript)
/*backtest
start: 2023-11-16 00:00:00
end: 2023-11-23 00:00:00
period: 30m
basePeriod: 15m
exchanges: [{"eid":"Futures_Binance","currency":"BTC_USDT"}]
*/

//@version = 2
////////////////////////////////////////////////////////////
//  Copyright by HPotter v1.0 19/12/2016
// This simple indicator gives you a lot of useful information - when to enter, when to exit
// and how to reduce risks by entering a trade on a double confirmed signal.
//
// You can use in the xPrice any series: Open, High, Low, Close, HL2, HLC3, OHLC4 and ect...
// You can change long to short in the Input Settings
// Please, use it only for learning or paper trading. Do not for real trading.
////////////////////////////////////////////////////////////
strategy(title="FX Sniper:  T3-CCI Strategy", shorttitle="T3-CCI")
CCI_Period = input(14, minval=1)
T3_Period = input(5, minval=1)
b = input(0.618)
reverse = input(false, title="Trade reverse")
hline(0, color=purple, linestyle=line)
xPrice = close
b2 = b*b
b3 = b2*b
c1 = -b3
c2 = (3*(b2 + b3))
c3 = -3*(2*b2 + b + b3)
c4 = (1 + 3*b + b3 + 3*b2)
nn = iff(T3_Period < 1, 1, T3_Period)
nr = 1 + 0.5*(nn - 1)
w1 = 2 / (nr + 1)
w2 = 1 - w1
xcci = cci(xPrice, CCI_Period)
e1 = w1*xcci + w2*nz(e1[1])
e2 = w1*e1 + w2*nz(e2[1])
e3 = w1*e2 + w2*nz(e3[1])
e4 = w1*e3 + w2*nz(e4[1])
e5 = w1*e4 + w2*nz(e5[1])
e6 = w1*e5 + w2*nz(e6[1])
xccir = c1*e6 + c2*e5 + c3*e4 + c4*e3
cciHcolor =  iff(xccir >= 0 , green,
               iff(xccir < 0, red, black))
pos =  iff(xccir > 0, 1,
         iff(xccir < 0, -1, nz(pos[1], 0)))
possig = iff(reverse and pos == 1, -1,
          iff(reverse and pos == -1, 1, pos))
if (possig == 1)
    strategy.entry("Long", strategy.long)
if (possig == -1)
    strategy.entry("Short", strategy.short)
barcolor(possig == -1 ? red: possig == 1 ? green : blue )
plot(xccir, color=blue, title="T3-CCI")
plot(xccir, color=cciHcolor, title="CCIH", style = histogram)
Detail
https://www.fmz.com/strategy/433075
Last Modified
2023-11-24 10:33:31
