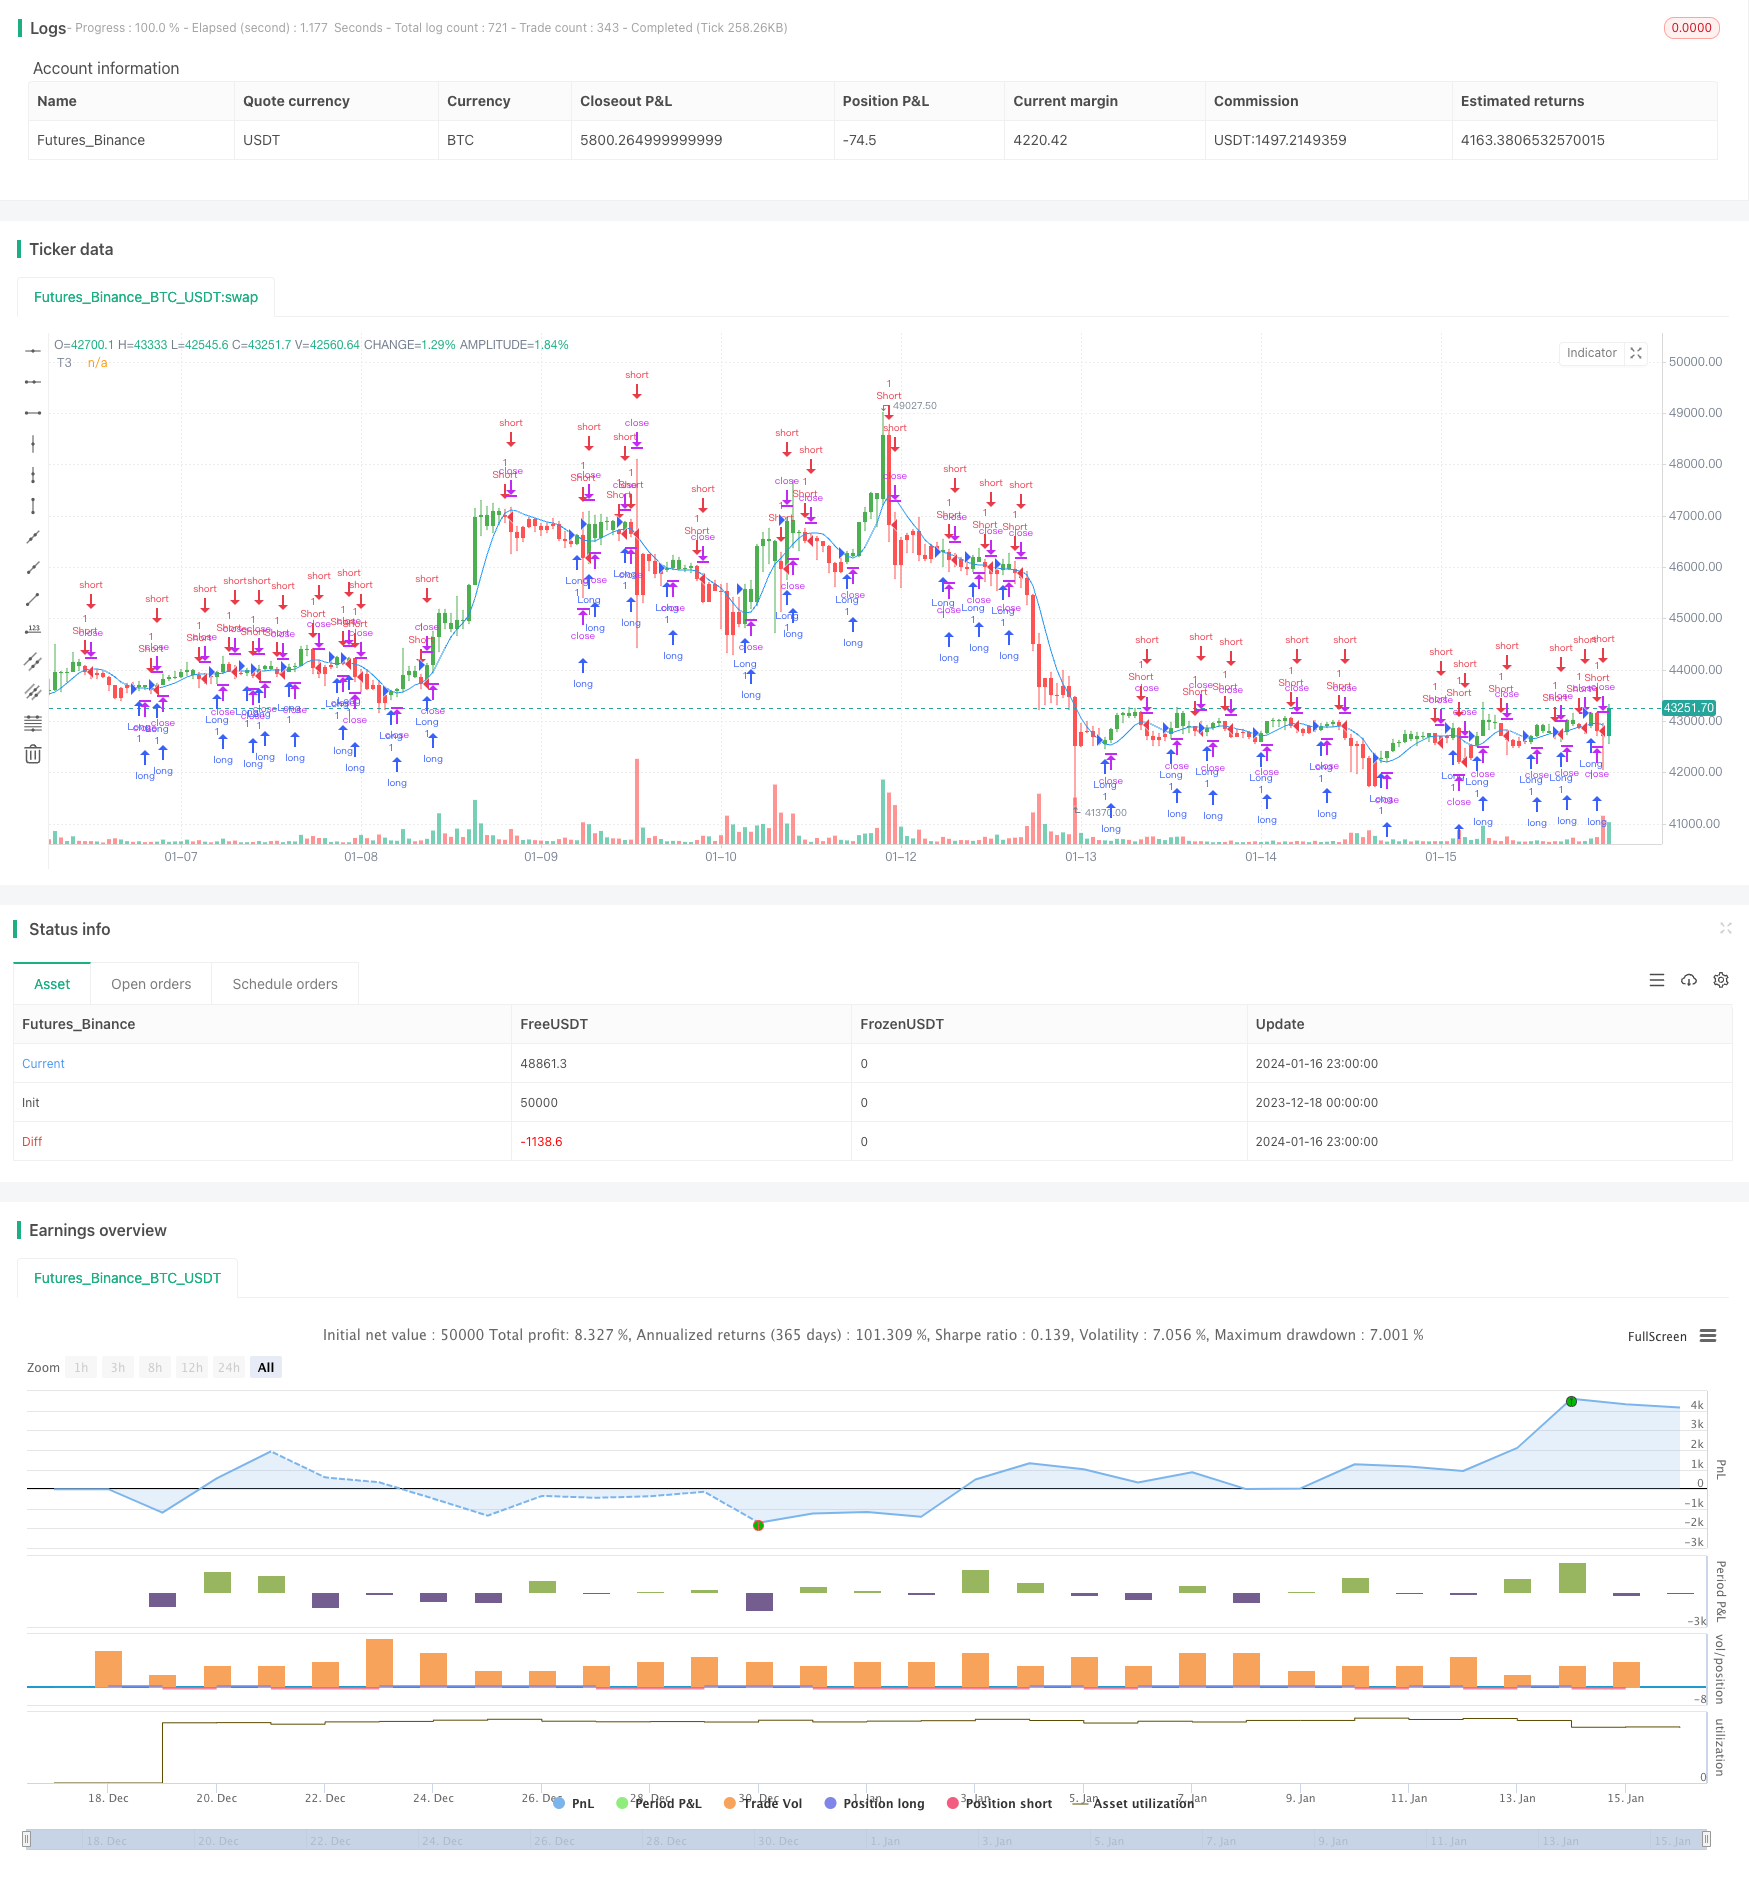
Name
基于T3指标的趋势追踪交易策略Trend-Following-Trading-Strategy-Based-on-T3-Indicator
Author
ChaoZhang
Strategy Description
该策略基于T3移动平均线指标设计了一个趋势追踪交易系统。该系统可以自动识别价格趋势方向,并相应做多做空。当价格上扬时做多,当价格下跌时做空。该系统还具有反转交易的功能。
该策略使用T3指标判断价格趋势方向。T3指标是一个自适应移动平均线,它具有更高的灵敏度,可以更快速地响应价格变化。该指标的计算公式为:
T3(n) = GD(GD(GD(n)))
其中,GD代表广义DEMA(双指数移动平均线),计算公式为:
GD(n,v) = EMA(n) * (1+v)-EMA(EMA(n)) * v
v是体量因子,决定了移动平均线对价格线性趋势的响应灵敏度。当v=0时,GD=EMA;当v=1时,GD=DEMA。作者建议设置v=0.7。
该策略将T3指标与价格进行对比,当T3上穿价格时判断为价格上涨趋势,做多;当T3下穿价格时判断为价格下跌趋势,做空。
- 使用自适应移动平均线T3指标,对价格趋势变化响应灵敏
- 自动判断价格趋势方向,无需手动判断
- 可配置反转交易,灵活应对市场变化
- T3指标可能出现盘整震荡时难以判断趋势方向的情况
- 自适应移动平均线指标容易产生误差信号
- 反转交易时的风险控制需要谨慎
可以通过调整T3指标的参数,或者增加其他指标过滤来减少误交易。也可以设置止损来控制单次损失。
- 增加其他指标滤波,例如MACD、RSI等指标进行组合
- 增加趋势判断规则,避免震荡市时的误操作
- 优化参数,调整v的值获得更佳的参数组合
- 加入止损逻辑
该策略通过T3指标自动判断价格趋势方向,无需人工判断,可以自动做多做空。同时可配置反转交易逻辑,应对更加复杂的市场情况。指标参数、交易逻辑等都有优化空间,可以使策略表现更加出色。
||
This strategy designs a trend following trading system based on the T3 moving average indicator. It can automatically identify the direction of price trends and take corresponding long or short positions. It goes long when prices rise and goes short when prices fall. The system also has the function of reversal trading.
The strategy uses the T3 indicator to determine the direction of the price trend. The T3 indicator is an adaptive moving average with higher sensitivity that can respond to price changes faster. Its calculation formula is:
T3(n) = GD(GD(GD(n)))
Where GD represents the generalized DEMA (double exponential moving average), which is calculated as:
GD(n,v) = EMA(n) * (1+v)-EMA(EMA(n)) * v
v is the volume factor, which determines the sensitivity of the moving average's response to linear price trends. When v=0, GD=EMA; when v=1, GD=DEMA. The author suggests setting v=0.7.
The strategy compares the T3 indicator with the price. When T3 crosses above the price, it determines an upward price trend and goes long. When T3 crosses below the price, it determines a downward price trend and goes short.
- Uses adaptive moving average T3 indicator, sensitive to price trend changes
- Automatically determines price trend direction, no manual judgment needed
- Configurable reversal trading, flexible to cope with market changes
- T3 indicator may have difficulty determining trend direction during range-bound consolidation
- Adaptive moving average indicators tend to produce false signals
- Risk control for reversal trading needs to be cautious
This can be mitigated by adjusting T3 parameters or adding other indicators for filtration, as well as setting stop loss to control single loss.
- Add other indicators for filtration, such as MACD, RSI etc for combination
- Add trend judgment rules to avoid false operations during sideways markets
- Optimize parameters, adjust v value for better parameter combination
- Add stop loss logic
The strategy automatically determines the price trend direction through the T3 indicator, without the need for manual judgment, and can automatically go long or short. It can also be configured for reversal trading to cope with more complex market situations. There is room for optimizing parameters, trading logic etc. to make the strategy perform even better.
[/trans]
Strategy Arguments
| Argument | Default | Description |
|---|---|---|
| v_input_1 | 5 | Length |
| v_input_2 | 0.7 | b |
| v_input_3 | false | Trade reverse |
Source (PineScript)
/*backtest
start: 2023-12-18 00:00:00
end: 2024-01-17 00:00:00
period: 1h
basePeriod: 15m
exchanges: [{"eid":"Futures_Binance","currency":"BTC_USDT"}]
*/

//@version=2
////////////////////////////////////////////////////////////
//  Copyright by HPotter v1.00 29/11/2017
// This indicator plots the moving average described in the January, 1998 issue
// of S&C, p.57, "Smoothing Techniques for More Accurate Signals", by Tim Tillson.
// This indicator plots T3 moving average presented in Figure 4 in the article.
// T3 indicator is a moving average which is calculated according to formula:
//     T3(n) = GD(GD(GD(n))),
// where GD - generalized DEMA (Double EMA) and calculating according to this:
//     GD(n,v) = EMA(n) * (1+v)-EMA(EMA(n)) * v,
// where "v" is volume factor, which determines how hot the moving average’s response
// to linear trends will be. The author advises to use v=0.7.
// When v = 0, GD = EMA, and when v = 1, GD = DEMA. In between, GD is a less aggressive
// version of DEMA. By using a value for v less than1, trader cure the multiple DEMA
// overshoot problem but at the cost of accepting some additional phase delay.
// In filter theory terminology, T3 is a six-pole nonlinear Kalman filter. Kalman
// filters are ones that use the error — in this case, (time series - EMA(n)) —
// to correct themselves. In the realm of technical analysis, these are called adaptive
// moving averages; they track the time series more aggres-sively when it is making large
// moves. Tim Tillson is a software project manager at Hewlett-Packard, with degrees in
// mathematics and computer science. He has privately traded options and equities for 15 years.
//
// You can change long to short in the Input Settings
// WARNING:
// - For purpose educate only
// - This script to change bars colors.
////////////////////////////////////////////////////////////
strategy(title="T3 Averages", shorttitle="T3", overlay = true)
Length = input(5, minval=1)
b = input(0.7, minval=0.01,step=0.01)
reverse = input(false, title="Trade reverse")
xPrice = close
xe1 = ema(xPrice, Length)
xe2 = ema(xe1, Length)
xe3 = ema(xe2, Length)
xe4 = ema(xe3, Length)
xe5 = ema(xe4, Length)
xe6 = ema(xe5, Length)
c1 = -b*b*b
c2 = 3*b*b+3*b*b*b
c3 = -6*b*b-3*b-3*b*b*b
c4 = 1+3*b+b*b*b+3*b*b
nT3Average = c1 * xe6 + c2 * xe5 + c3 * xe4 + c4 * xe3
pos = iff(nT3Average > close, -1,
       iff(nT3Average < close, 1, nz(pos[1], 0)))
possig = iff(reverse and pos == 1, -1,
          iff(reverse and pos == -1, 1, pos))
if (possig == 1)
    strategy.entry("Long", strategy.long)
if (possig == -1)
    strategy.entry("Short", strategy.short)
barcolor(possig == -1 ? red: possig == 1 ? green : blue )
plot(nT3Average, color=blue, title="T3")
Detail
https://www.fmz.com/strategy/439268
Last Modified
2024-01-18 16:21:40
