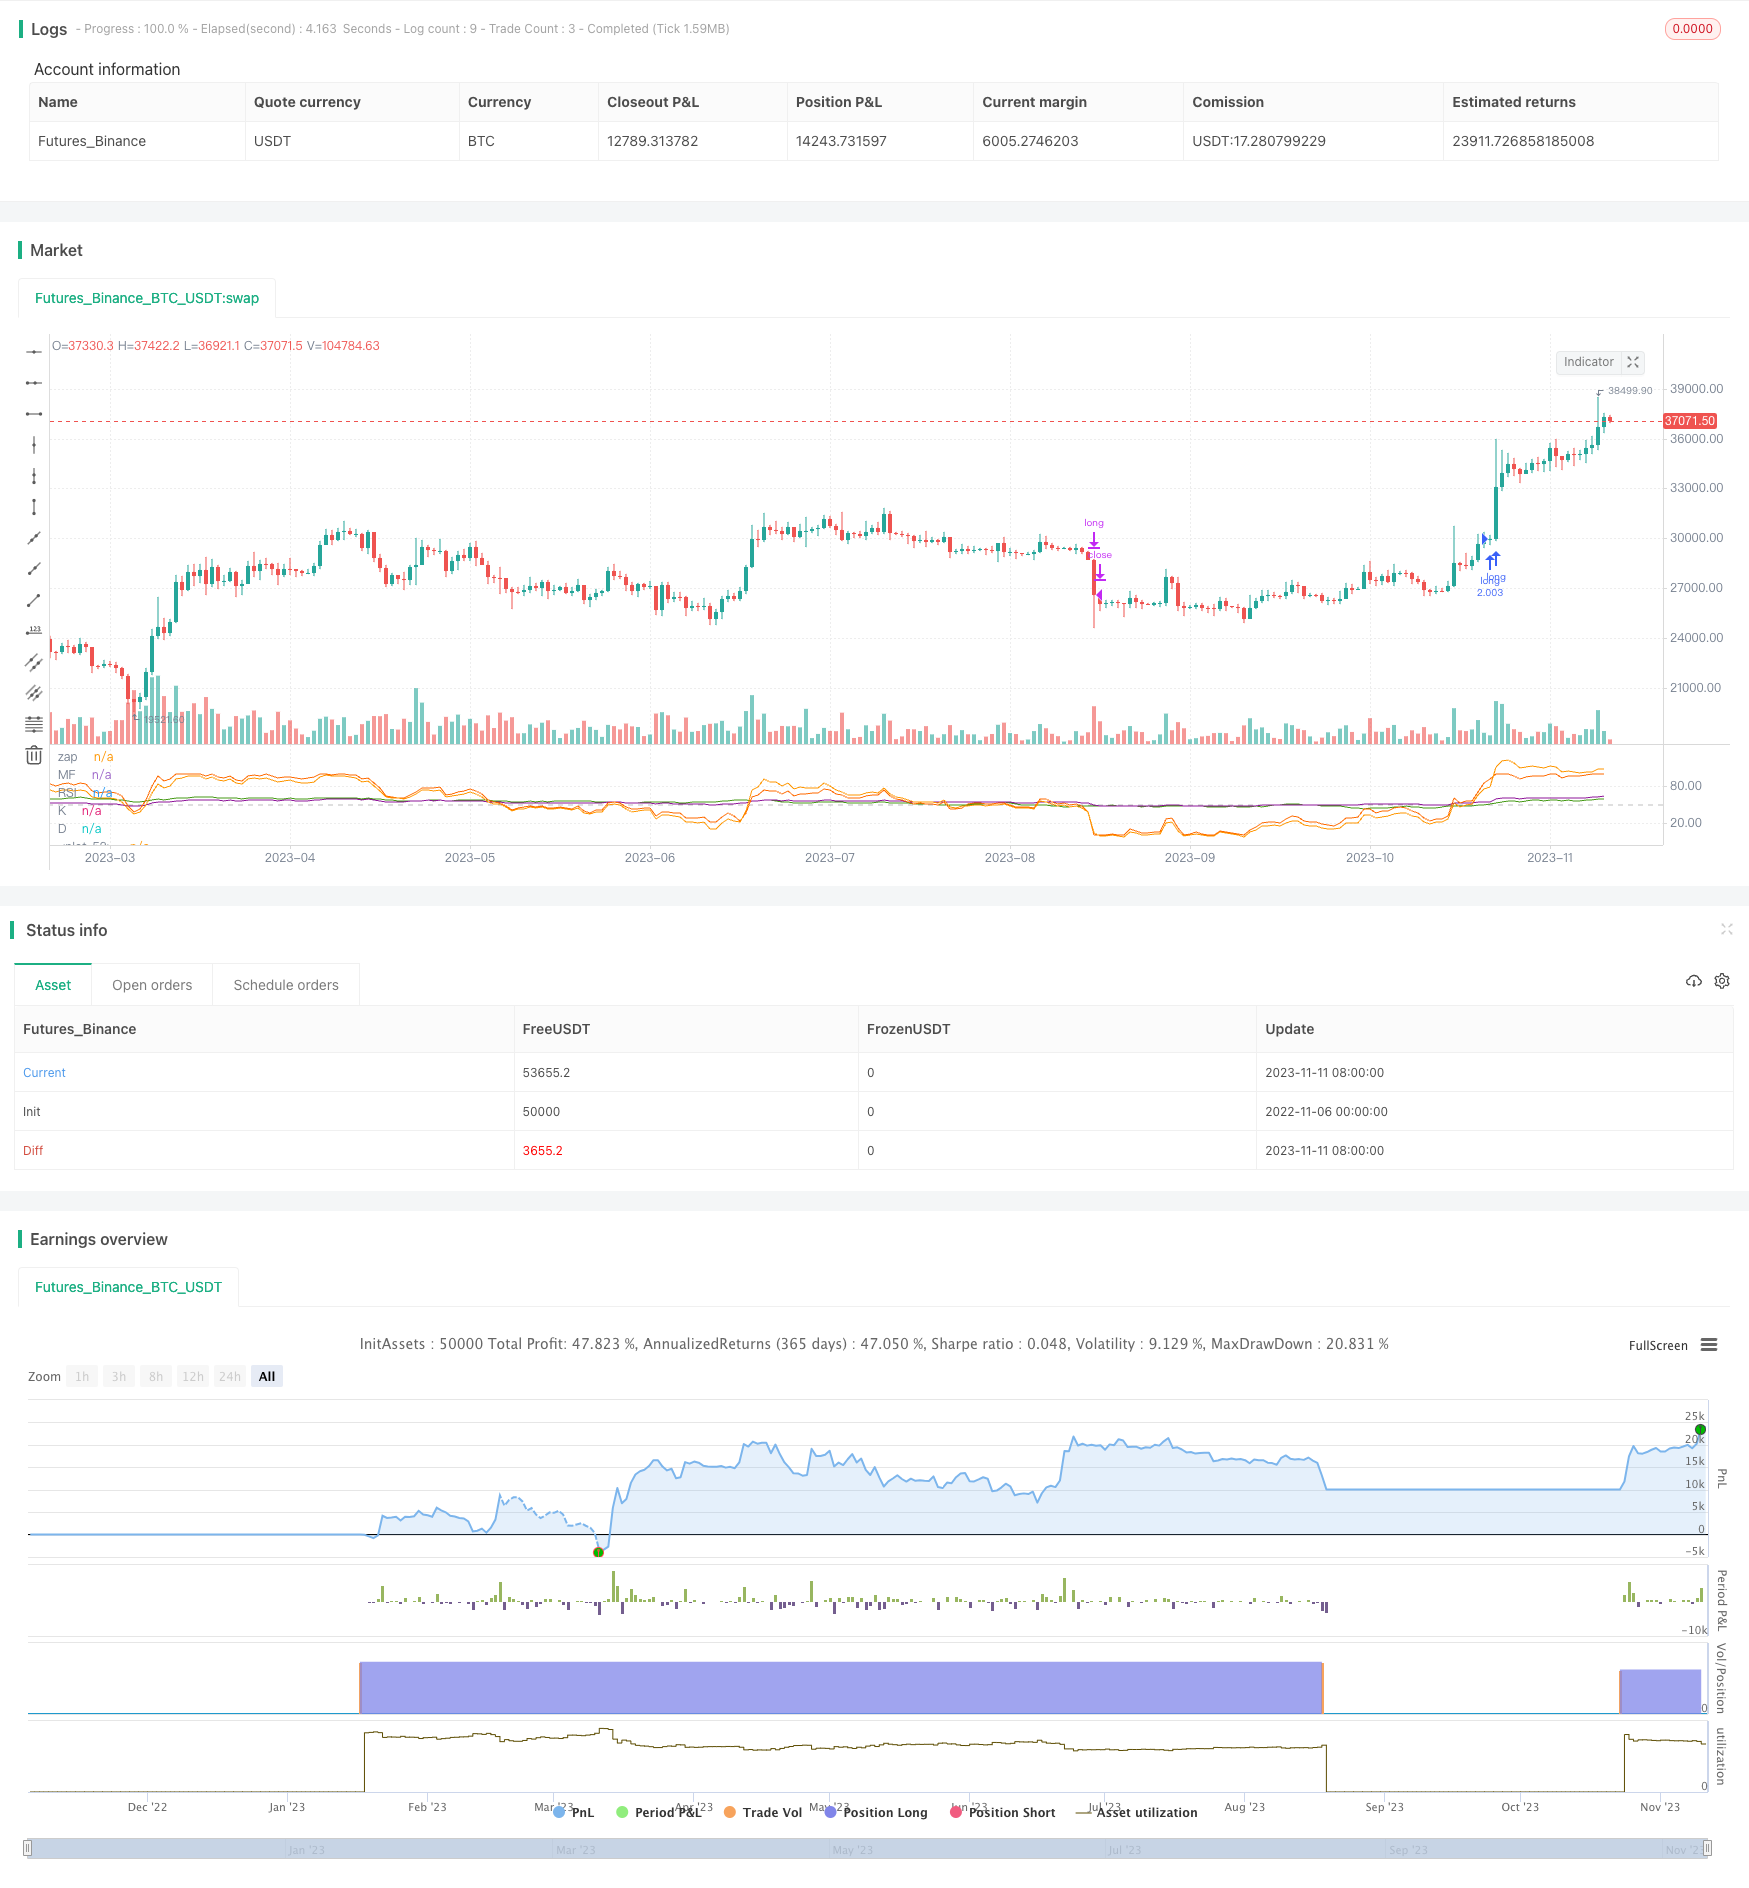
Name
多指标交叉强势追踪策略Multi-indicator-Crossover-Strong-Trend-Tracking-Strategy
Author
ChaoZhang
Strategy Description
该策略整合了RSI、MF、CCI、Stoch RSI等多种强势指标,通过指标交叉实现强势趋势的识别与追踪。策略首先计算多个周期指标,然后取指标的平均值,当多个指标都突破强势阈值时产生买入信号,当指标都跌破弱势阈值时产生卖出信号,从而捕捉股价的趋势转换点,追踪强势趋势。
该策略同时计算RSI、MF、CCI、Stoch RSI四种强势指标。其中,RSI通过计算一定周期内的涨跌变化判断强弱;MF也考虑涨跌比例;CCI通过计算价格偏离均线的程度判断是否超买超卖;Stoch RSI 在RSI的基础上加入KDJ计算方法。
策略设置50为指标的中性区域。当RSI、MF、CCI、Stoch RSI的K、D线都上穿50时产生买入信号,表明股价处于强势上涨趋势;当指标都下破50时产生卖出信号,表明股价进入盘整或下跌趋势。进场后设置较宽的止损范围,以追踪强势趋势。
该策略的优点是指标全面,包含多种计算股价强弱的方法,指标之间可以互相验证,避免出现错位。通过指标的平均值判断,可以过滤掉部分噪音。
-
指标全面,包含RSI、MF、CCI、Stoch RSI多种强势判断方法,可以互相验证,提高识别准确率。
-
计算指标的平均值,可以过滤掉部分噪音,使信号更可靠。
-
采用指标的多重交叉作为入场时机,可以有效识别股价强势转换点。
-
设置较宽的止损范围,可以持续追踪强势趋势,获得超额收益。
-
策略思路清晰易懂,参数设置合理,实盘操作容易。
-
强势反转风险。股价出现突然反转时,可能导致策略止损。
-
走势波动风险。股价在强势趋势中可能出现较大幅度的回调,需要设定合理的止损范围。
-
多头行情风险。策略以追踪强势为主,在空头行情中效果可能不佳。
-
参数优化风险。指标参数需要根据不同品种进行测试优化,否则可能出现效果不佳。
-
可以通过合理止损、参数测试、调整仓位等方法来控制风险。
-
可以测试不同的参数组合,选择对特定品种更适合的RSI、CCI等指标周期。
-
可以引入更多类型的指标,如波动率指标、成交量指标等,丰富多指标交叉逻辑。
-
可以根据市场情况,自动调整每次交易的仓位百分比。
-
可以设置动态止损,根据市场波动程度来trailing stop loss。
-
可以探索指标分级交叉的可能性,先通过一级指标交叉进入场内,再通过二级指标交叉追踪趋势。
该策略通过RSI、MF、CCI、Stoch RSI多种强势指标的交叉实现对强势趋势的识别与追踪。策略指标全面互补,计算指标平均值可以有效过滤误报。采用指标交叉判断入场时机较为可靠,设置宽止损范围可以持续追踪趋势。但股价可能出现反转需要警惕,参数测试与优化也较为重要。整体来说,该策略思路简单清晰,通过多指标验证与止损优化,可以获得较好的跟踪强势趋势的效果。
||
This strategy integrates multiple strong momentum indicators including RSI, MF, CCI and Stoch RSI to identify and track strong trends through indicator crossovers. It first calculates multiple cycle indicators, then takes the average value. When all indicators break through the strong threshold, a buy signal is generated. When indicators fall below the weak threshold, a sell signal is generated to capture trend turning points and track strong trends.
This strategy calculates four strong momentum indicators - RSI, MF, CCI and Stoch RSI. RSI judges strength by calculating price changes over a period. MF also considers the ratio of ups and downs. CCI judges overbought/oversold levels by calculating the deviation from moving average. Stoch RSI incorporates the KDJ calculation method on top of RSI.
The strategy sets 50 as the neutral level for indicators. When RSI, MF, CCI, Stoch RSI K and D lines all cross above 50, a buy signal is generated, indicating a strong uptrend. When indicators fall below 50, a sell signal is generated, suggesting sideways or downtrend. After entering, a wide stop loss is set to track the strong trend.
The advantage of this strategy is that the indicators are comprehensive, containing multiple methods to gauge price momentum and can verify each other to avoid misalignment. Taking average value can filter out some noise.
-
Comprehensive indicators including RSI, MF, CCI and Stoch RSI for strong momentum judgment and verification, improving accuracy.
-
Taking average value of indicators filters noise and makes signals more reliable.
-
Using multiple indicator crossover as entry timing effectively identifies strong trend turning points.
-
The wide stop loss range enables tracking the strong trend for excess returns.
-
The strategy logic is clear and easy to understand, parameters are reasonable for live trading.
-
Risk of strong trend reversal. Sudden reversals may cause the strategy to stop loss.
-
Risk of fluctuations within trend. Price may have large pullbacks during uptrends, requiring reasonable stop loss ranges.
-
Risk in bear markets. The strategy is mainly for tracking strong trends, may underperform in bear markets.
-
Parameter optimization risk. Indicator parameters need testing and optimization for different products, otherwise performance may suffer.
-
Risks can be managed through proper stop loss, parameter testing, position adjustment etc.
-
Test different parameter combinations to find optimal cycles for RSI, CCI etc. for specific products.
-
Introduce more indicator types like volatility indicators, volume indicators to enrich logic.
-
Automatically adjust position sizes based on market conditions.
-
Adopt dynamic stop loss, trailing stops based on market fluctuation levels.
-
Explore staged crossover possibilities, enter trades based on first-level indicators, then track trends with second-level indicators.
This strategy identifies and tracks strong trends by crossovers of RSI, MF, CCI, Stoch RSI and other strong momentum indicators. The comprehensive and complementary indicators with average value calculation effectively filter out false signals. The indicator crossover entry timing is reliable, and wide stop loss range allows persistent trend tracking. But reversal risks need caution, and parameter optimization is important. Overall, the strategy has a simple and clear concept, and can achieve good trend tracking effect through indicator verification, stop loss optimization.
[/trans]
Strategy Arguments
| Argument | Default | Description |
|---|---|---|
| v_input_1 | 100 | Length |
| v_input_2 | true | K |
| v_input_3 | true | D |
Source (PineScript)
/*backtest
start: 2022-11-06 00:00:00
end: 2023-11-12 00:00:00
period: 1d
basePeriod: 1h
exchanges: [{"eid":"Futures_Binance","currency":"BTC_USDT"}]
*/

// This source code is subject to the terms of the Mozilla Public License 2.0 at https://mozilla.org/MPL/2.0/
// © SoftKill21

//@version=4

strategy(title="something", initial_capital = 1000, default_qty_type=strategy.percent_of_equity, default_qty_value=100, commission_type=strategy.commission.percent, commission_value=0.03, pyramiding=1  )

length = input(title="Length", type=input.integer, defval=100, minval=1, maxval=2000)
src = hlc3
upper = sum(volume * (change(src) <= 0 ? 0 : src), length)
lower = sum(volume * (change(src) >= 0 ? 0 : src), length)
_rsi(upper, lower) =>
    if lower == 0
        100
    if upper == 0
        0
	100.0 - (100.0 / (1.0 + upper / lower))
mf = _rsi(upper, lower)

up = rma(max(change(src), 0), length)
down = rma(-min(change(src), 0), length)
rsi = down == 0 ? 100 : up == 0 ? 0 : 100 - (100 / (1 + up / down))
plot(rsi, "RSI", color=#8E1599)

plot(mf, "MF", color=#459915)
hline(50, title="zap", color=#c0c0c0)


ma = sma(src, length)
cci = (src - ma) / (0.015 * dev(src, length))
//plot(cci, "CCI", color=#996A15)


smoothK = input(1, "K", minval=1)
smoothD = input(1, "D", minval=1)

rsi1 = rsi(src, length)
k = sma(stoch(rsi1, rsi1, rsi1, length), smoothK)
d = sma(k, smoothD)
plot(k, "K", color=#0094FF)
plot(d, "D", color=#FF6A00)

avg = (rsi + mf + cci + k + d)/5

long = rsi > 50 and mf > 50 and cci >50 and (k > 50 or d>50)
short= rsi<49 and mf<49 and cci<0 and (k<50 or d<50)

// long= avg > 100
// short=avg<0

plot(avg)

strategy.entry('long',1,when=long)
strategy.close("long",when=short)
//strategy.entry('short',0,when=short)
//strategy.close("short",when=exitshort)
Detail
https://www.fmz.com/strategy/431959
Last Modified
2023-11-13 16:59:12
