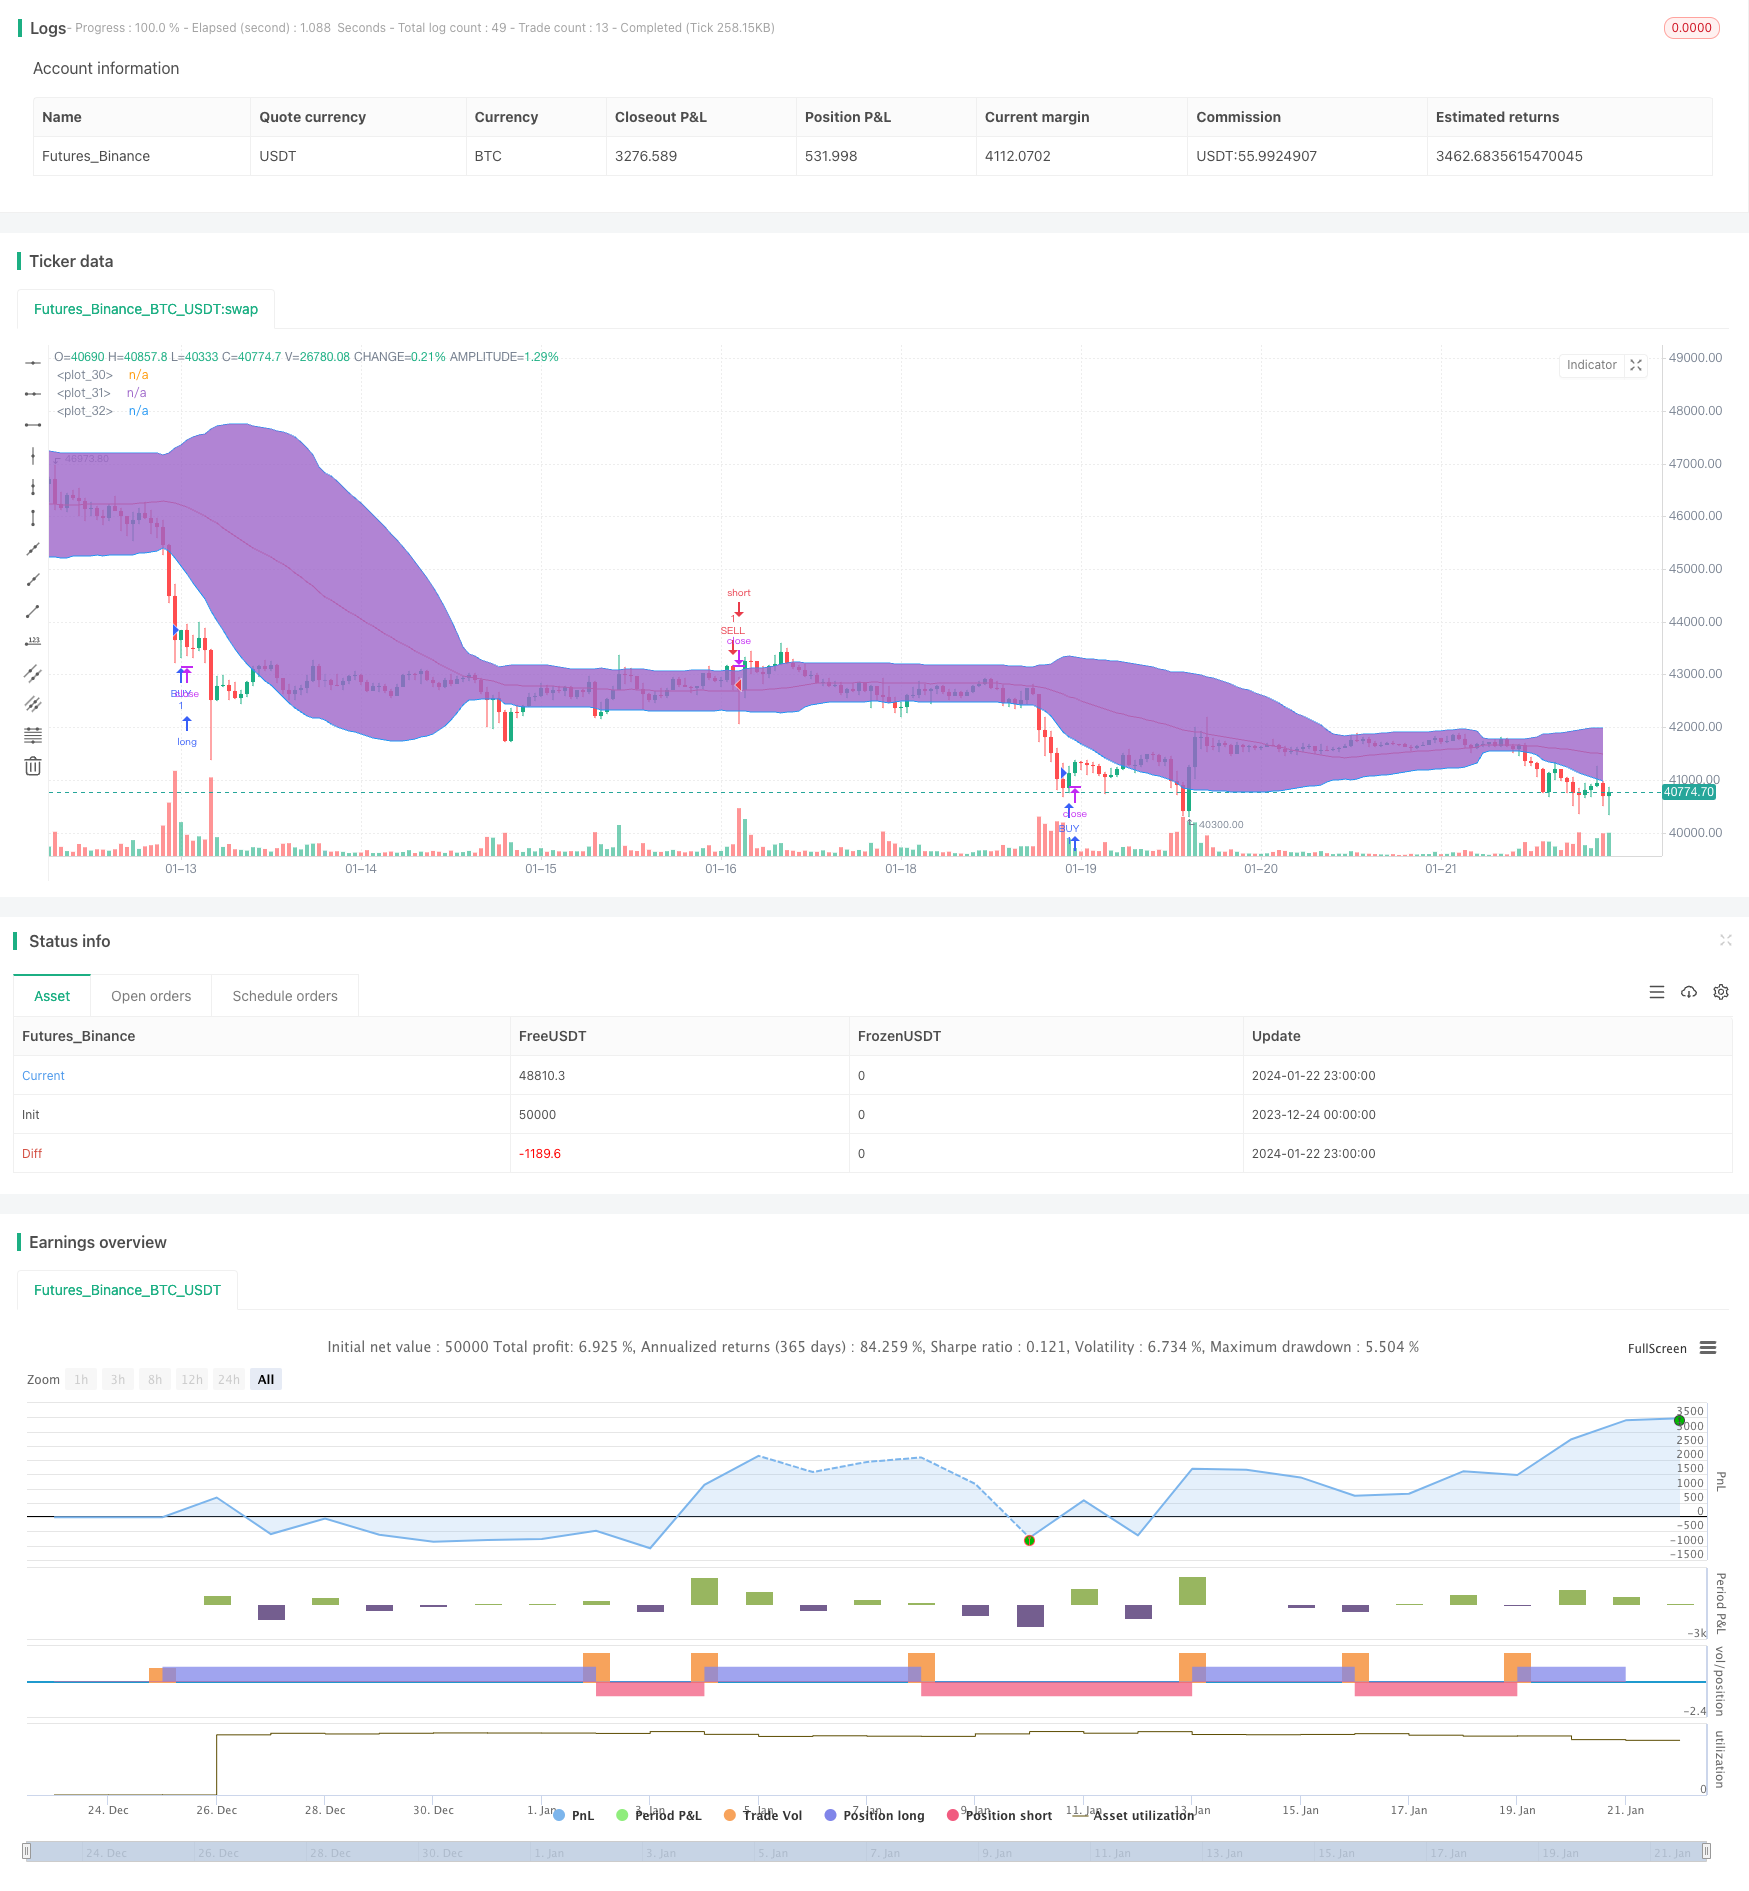
Name
多指标结合量化交易策略Multi-indicator-Combined-Quantitative-Trading-Strategy
Author
ChaoZhang
Strategy Description
[trans]
该策略运用了RSI、StochRSI和布林带三种股价技术指标,并结合交易的时间和方向条件,实现判断买入和卖出信号的量化交易策略。
当RSI指标小于低位区域并且StochRSI指标K线上穿D线时,视为买入信号。同时股价较布林带下线廉价或穿过布林带下线也作为买入依据。
当RSI指标超过高位区域并且StochRSI指标K线下穿D线时,视为卖出信号。同时股价高于布林带上线或跌穿布林带上线也作为卖出依据。
通过 RSI 指标判断股价是否超买超卖,StochRSI 判断股价动能,布林带判断股价是否高位运行和廉价,多指标组合判断买卖。
这是一个多指标组合的策略,指标覆盖面广,判断依据全面。在判断信号前都需要当前股价或指标和其阈值发生交叉,对虚假信号有一定的过滤。
在下单前增加了时间条件限制,可以避免特定的时间段带来更大的风险。
通过多种指标的综合判断,能够匹配更多类型的走势,提高策略的有效率。
该策略主要依赖三种指标,如果指标发出错误信号,策略会造成损失。指标应该互相验证,不能完全依赖某个指标。比如某个时间段RSI震荡,会增加发出虚假信号的可能。
策略加入的时间判断条件可能也会错过有利行情。
如果选股不当,例如 exaggeration效应严重的股票,指标的有效性会大打折扣,应该研究股票对这些指标的适用性。
-
增加最大回撤等风控手段,可以对损失进行限制。
-
调整指标的参数,更好的与选定的股票匹配。比如加快RSI参数以检测更快的价格变动。
-
增加过滤机制,例如股价在布林带中部时暂缓交易,避免震荡行情。并且在开盘和收盘附近阻止下单,避开跳空的风险。
-
选股时可以参考公司基本面,避选财务造假严重的股票。也可以增加行业和市值的判断,选取大盘股。
这是一个典型的多变量技术指标策略,指标组合较为均衡,覆盖面广,同时下单条件严谨,可以有效选股实现盈利,回撤也会控制在一定范围内。通过指标和参数优化,可以更好的适配市场,同时增加风控机制最大限度规避风险,进一步提高策略的稳定可靠性。
||
This strategy uses three technical indicators of stock price, RSI, StochRSI and Bollinger Bands, and combines trading time and direction conditions to determine buy and sell signals for quantitative trading strategies.
When the RSI indicator is less than the lower area and the StochRSI K line crosses above the D line, it is considered a buy signal. At the same time, the stock price is cheaper than the lower line of the Bollinger Band or crosses below the lower line of the Bollinger Band is also used as a basis for buying.
When the RSI indicator exceeds the upper area and the StochRSI K line crosses below the D line, it is considered a sell signal. At the same time, the stock price is higher than the upper line of the Bollinger Band or breaks through the upper line of the Bollinger Band is also used as the basis for selling.
The RSI indicator judges whether the stock price is overbought or oversold, StochRSI judges the momentum of the stock price, and Bollinger Bands judges whether the stock price is running at high levels and cheap. Multiple indicators combine to determine buying and selling.
This is a multi-indicator combined strategy with wide coverage of indicators and comprehensive judgment basis. Crossing is required between the current stock price or indicator and its threshold before judging the signal, which has a certain filtering effect on false signals.
Time condition restrictions are added before placing orders to avoid greater risks during specific time periods.
By combining the judgments of multiple indicators, more types of trends can be matched to improve the effectiveness of the strategy.
The strategy relies mainly on three types of indicators. If the indicator gives a wrong signal, the strategy will cause losses. Indicators should verify each other and cannot completely rely on a certain indicator. For example, RSI oscillation in a certain period of time will increase the possibility of issuing false signals.
The time judgment conditions added in the strategy may also miss favorable market conditions.
If the stock selection is inappropriate, for example, stocks with severe exaggeration effects, the validity of these indicators will be greatly reduced. The applicability of stocks to these indicators should be studied.
-
Increase risk control measures such as maximum drawdown to limit losses.
-
Adjust the parameters of the indicator to better match the selected stocks. For example, speed up the RSI parameters to detect faster price changes.
-
Increase filtering mechanisms, such as suspend trading when the stock price is in the middle of the Bollinger Band to avoid oscillating market conditions. And stop ordering near opening and closing to avoid gap risk.
-
Stock selection can refer to fundamentals to avoid stocks with serious financial fraud. Industry and market value judgments can also be added to select large-cap stocks.
This is a typical multi-variable technical indicator strategy with a balanced mix of indicators and extensive coverage. At the same time, the order conditions are rigorous, which can effectively select stocks to achieve profit, and the drawdown will be controlled within a certain range. Through the optimization of indicators and parameters, it can better adapt to the market. At the same time increase risk control mechanism to minimize risk to further improve the stability and reliability of the strategy.
[/trans]
Strategy Arguments
| Argument | Default | Description |
|---|---|---|
| v_input_1 | 6 | lengthrsi |
| v_input_2 | 20 | overSold |
| v_input_3 | 70 | overBought |
| v_input_4 | 3 | smoothK |
| v_input_5 | 3 | smoothD |
| v_input_6 | 14 | lengthRSI |
| v_input_7 | 14 | lengthStoch |
| v_input_8_close | 0 | RSI Source: close |
| v_input_9 | 50 | bblength |
| v_input_10 | 1.5 | Multiplier for BB Upper Band |
| v_input_11 | 1.5 | Multiplier for BB Lower Band |
| v_input_12 | 2018 | yearfrom |
| v_input_13 | 2019 | yearuntil |
| v_input_14 | 6 | monthfrom |
| v_input_15 | 12 | monthuntil |
| v_input_16 | true | dayfrom |
| v_input_17 | 31 | dayuntil |
Source (PineScript)
/*backtest
start: 2023-12-24 00:00:00
end: 2024-01-23 00:00:00
period: 1h
basePeriod: 15m
exchanges: [{"eid":"Futures_Binance","currency":"BTC_USDT"}]
*/

//@version= 2
strategy("RSI+STOCHRSI+BB Strategy", overlay=true)
lengthrsi = input(6)
overSold = input( 20 )
overBought = input( 70 )
price = close
vrsi = rsi(price, lengthrsi)

smoothK = input(3, minval=1)
smoothD = input(3, minval=1)
lengthRSI = input(14, minval=1)
lengthStoch = input(14, minval=1)
src = input(close, title="RSI Source")

rsi1 = rsi(src, lengthRSI)
k = sma(stoch(rsi1, rsi1, rsi1, lengthStoch), smoothK)
d = sma(k, smoothD)

bblength = input(50)
bbupmult =input(1.5,title="Multiplier for BB Upper Band")
bblowmult = input(1.5,title="Multiplier for BB Lower Band")

basis =  sma(close,bblength)

devup = bbupmult * stdev(close, bblength)
devlow = bblowmult * stdev(close, bblength)

upper = basis + devup
lower = basis - devlow
plot(basis, color=red)
p1 = plot(upper, color=blue)
p2 = plot(lower, color=blue)
fill(p1, p2)


yearfrom = input(2018)
yearuntil =input(2019)
monthfrom =input(6)
monthuntil =input(12)
dayfrom=input(1)
dayuntil=input(31)


if (  ( crossover(k,d)) and ( crossover(vrsi,overSold) or vrsi<overSold)  and (  (price<lower) or crossover(price,lower) ) )
    strategy.entry("BUY", strategy.long, stop=close, oca_name="TREND",  comment="BUY")

else
    strategy.cancel(id="BUY")


if ( ( crossunder(k,d) ) and ( (vrsi >overBought) or crossunder(vrsi,overBought) ) and  ( (price>upper) or crossunder(price,upper) ))

    strategy.entry("SELL", strategy.short,stop=close, oca_name="TREND",  comment="SELL")
else
    strategy.cancel(id="SELL")
Detail
https://www.fmz.com/strategy/439874
Last Modified
2024-01-24 15:10:41
