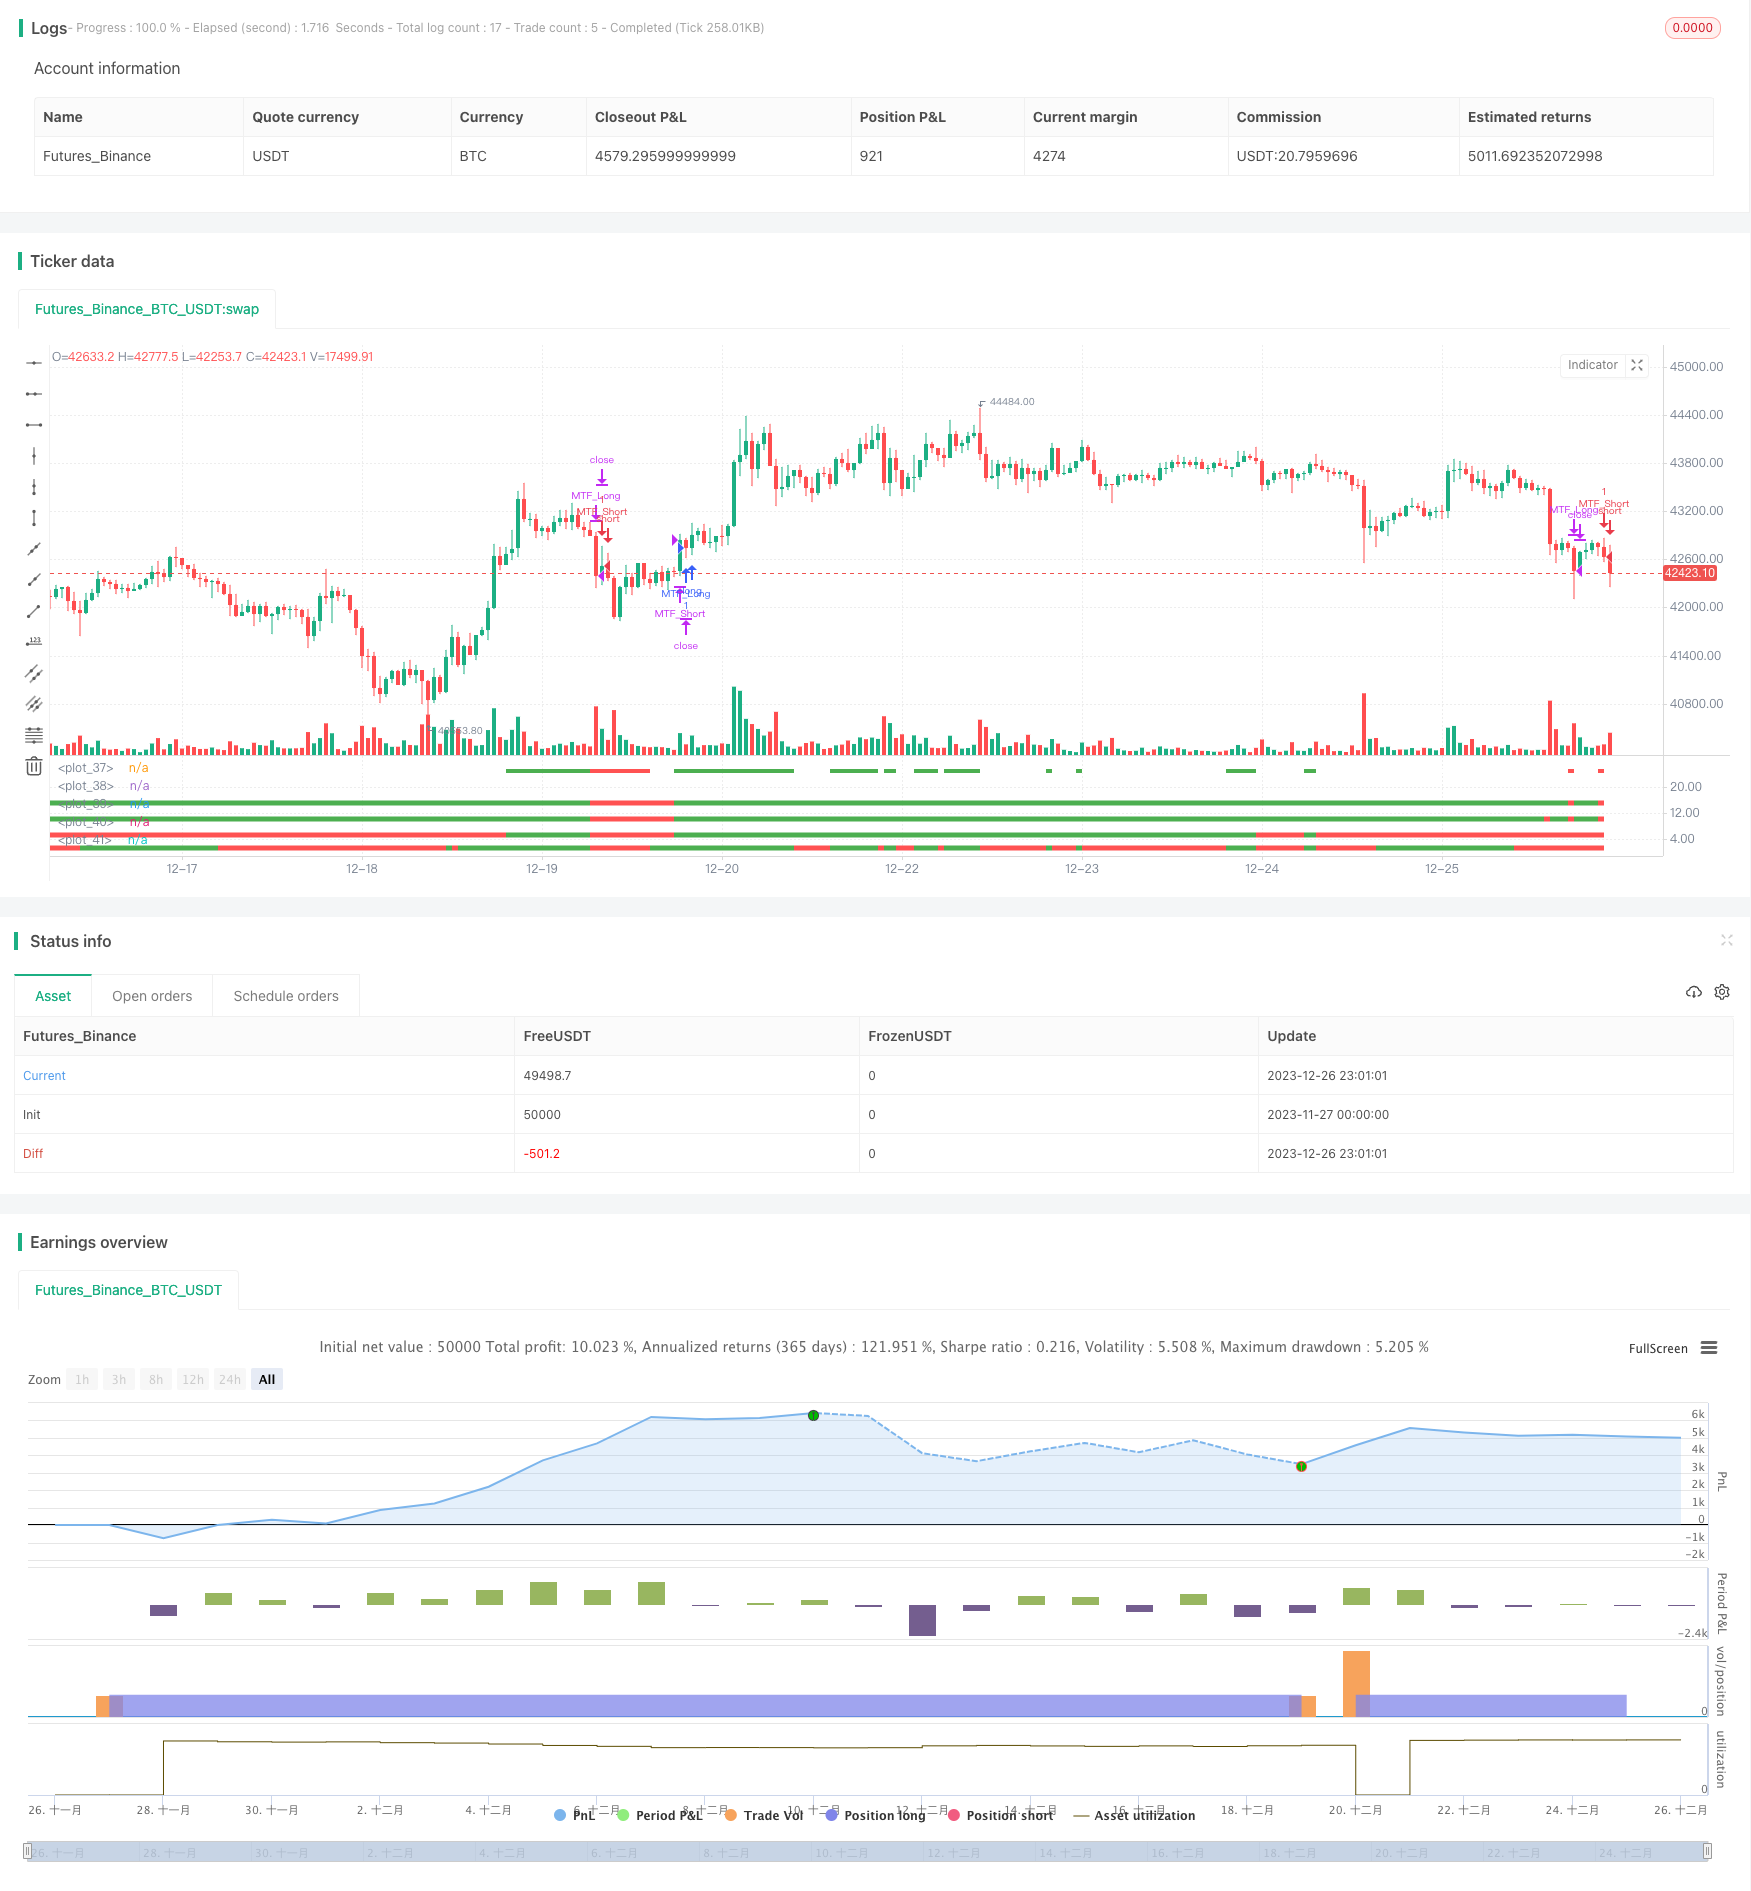
Name
多时间框架判断趋势策略Multi-Timeframe-Trend-Strategy
Author
ChaoZhang
Strategy Description
本策略运用4个不同的时间框架来判断趋势方向,以发现长线趋势的同时利用短线作为入场时机。当4个时间框架(日线、周线、15日线、月线)的开盘价全部低于收盘价时则判断为长期看涨趋势;当4个时间框架的开盘价全部高于收盘价时则判断为长期看跌趋势。策略会在确定长期趋势后利用短线产生讯号来进行开仓。
本策略使用4个时间框架:日线、周线、15日线与月线。根据这4个时间框架的开盘价与收盘价的大小关系来判断长期趋势方向。
当日线、周线、15日线与月线的开盘价全部低于收盘价时,表示在这4个时间框架上,价格都呈现上涨的趋势,此时判断为多头行情,长期看涨。
反之,当这4个时间框架的开盘价全部高于收盘价时,表示在这4个时间框架上,价格都呈现下跌的趋势,此时判断为空头行情,长期看跌。
在判断出长期趋势方向后,策略会在短线产生买入/卖出讯号时进行开仓。也就是说,本策略使用长线判断大趋势,使用短线确定具体的入场时机。
本策略具有以下优势:
-
多时间框架判断,提高判断准确性
利用4个不同级别的时间框架来综合判断长期趋势,可以提高判断的准确性,避免被短期市场噪音所迷惑。
-
长短线结合,策略灵活
使用长线框架判断大方向,同时利用短线产生操作讯号,策略灵活,可以捕捉短线机会的同时又不会偏离主要趋势。
-
参数简单,容易实施
本策略主要判断指标只有4个时间框架的开盘价与收盘价,参数设置简单,容易实施。
本策略也存在一些风险,主要有:
-
长期趋势发生转折
如果长期看涨的趋势发生转折,变为长期看跌,本策略无法及时判断,可能带来较大亏损。此时需要人工干预或设置止损。
-
短期运行效果不佳
本策略主要依靠短线产生讯号来决定具体的入场时机。如果短期运行效果不佳,无法在合适时间开仓,会影响整体策略的效果。此时可以调整短线参数或优化短线策略。
本策略还有进一步优化的空间:
-
增加止损策略
可以设置移动止损或挂单止损来控制最大亏损。
-
优化短线策略
可以测试不同的短线指标来寻找更合适的短线策略,提高入场效果。
-
动态调整仓位
可以根据市场波动程度来动态调整仓位,在趋势更明确时加大仓位。
-
结合机器学习
可以收集大量数据并运用机器学习的方法来动态优化参数和规则。
本策略通过跨多个时间框架判断趋势方向,使用长短线结合的思路,既保证了对大趋势的判断,又利用短线机会入场,整体运行逻辑清晰合理,实施简单,是一种有效的趋势跟踪策略。随着止损、动态仓位管理等技术的引入,本策略还具有很大的改进空间,值得实践与优化。
||
This strategy uses 4 different timeframes to determine the trend direction, to discover the long-term trend while using the short-term as entry opportunities. When the open prices of the 4 timeframes (daily, weekly, 15-day, monthly) are all lower than the closing prices, it is determined as a long-term bullish trend; when the open prices of the 4 timeframes are all higher than the closing prices, it is determined as a long-term bearish trend. The strategy will open positions when confirming the long-term trend and a short-term signal is generated.
This strategy uses 4 timeframes: daily, weekly, 15-day and monthly. It determines the long-term trend direction based on the relationship between the open and closing prices of these 4 timeframes.
When the open prices of the daily, weekly, 15-day and monthly timeframes are all lower than the closing prices, it indicates that prices are showing an upward trend across these 4 timeframes, so it is determined as a bull market and long-term bullish.
On the contrary, when the open prices of these 4 timeframes are all higher than the closing prices, it indicates that prices are showing a downward trend across these 4 timeframes, so it is determined as a bear market and long-term bearish.
After determining the long-term trend direction, the strategy will open positions when a buy/sell signal is generated on the short-term. That is, this strategy uses the long-term to determine the major trend and the short-term to decide specific entry opportunities.
This strategy has the following advantages:
-
Multi-timeframe judgment improves accuracy
Using 4 different timeframes to comprehensively judge the long-term trend can improve the accuracy of judgment and avoid being misled by short-term market noise.
-
Combination of long-term and short-term, flexible strategy
Using long-term frames to determine the major direction and short-term to generate trading signals, this strategy is flexible, which can capture short-term opportunities while not deviating from the major trend.
-
Simple parameters, easy to implement
The main judgment indicators of this strategy are just the open and closing prices of the 4 timeframes. The parameter setting is simple and easy to implement.
There are also some risks in this strategy:
-
Long-term trend reversal
If the long-term bullish trend reverses into long-term bearish, this strategy cannot promptly judge, which may lead to greater losses. Manual intervention or stop loss should be used in this case.
-
Poor short-term performance
This strategy mainly relies on short-term signals to determine specific entry opportunities. If the short-term performance is poor and unable to open positions at the right time, it will affect the overall performance. The short-term parameters can be adjusted or the short-term strategy can be optimized in this case.
There are further optimization spaces for this strategy:
-
Add stop loss strategy
Moving or order stop loss can be set to control maximum loss.
-
Optimize short-term strategy
Different short-term indicators can be tested to find more suitable short-term strategies and improve entry performance.
-
Dynamically adjust positions
Positions can be adjusted dynamically based on market volatility, increase positions when the trend becomes more obvious.
-
Combine machine learning
A large amount of data can be collected and machine learning methods can be used to dynamically optimize parameters and rules.
This strategy determines the trend direction across multiple timeframes, adopts the idea of combining long-term and short-term, which ensures the judgment of major trends and utilizes short-term opportunities. The overall logic is clear and reasonable, simple to implement, and it is an effective trend following strategy. With the introduction of techniques like stop loss and dynamic position management, this strategy has great room for improvement and is worth practicing and optimizing.
[/trans]
Strategy Arguments
| Argument | Default | Description |
|---|---|---|
| v_input_1 | D | Timeframe 1 |
| v_input_2 | 5D | Timeframe 2 |
| v_input_3 | 15D | Timeframe 3 |
| v_input_4 | 45D | Timeframe 4 |
| v_input_5 | true | Contract/Share Amount |
Source (PineScript)
/*backtest
start: 2023-11-27 00:00:00
end: 2023-12-27 00:00:00
period: 1h
basePeriod: 15m
exchanges: [{"eid":"Futures_Binance","currency":"BTC_USDT"}]
*/

//@version=2
strategy("[RichG] Easy MTF Strategy", overlay=false)

TF_1_time = input("D", "Timeframe 1")
TF_2_time = input("5D", "Timeframe 2")
TF_3_time = input("15D", "Timeframe 3")
TF_4_time = input("45D", "Timeframe 4")

transaction_size = input(1, "Contract/Share Amount")

src = close, len = 20
out = sma(src, len)
width = 5
upcolor = green
downcolor = red
neutralcolor = blue
linestyle = line

TF_1 = request.security(syminfo.tickerid, TF_1_time, open) < request.security(syminfo.tickerid, TF_1_time, close) ? true:false
TF_1_color = TF_1 ? upcolor:downcolor

TF_2 = request.security(syminfo.tickerid, TF_2_time, open) < request.security(syminfo.tickerid, TF_2_time, close) ? true:false
TF_2_color = TF_2 ? upcolor:downcolor

TF_3 = request.security(syminfo.tickerid, TF_3_time, open) < request.security(syminfo.tickerid, TF_3_time, close) ? true:false
TF_3_color = TF_3 ? upcolor:downcolor


TF_4 = request.security(syminfo.tickerid, TF_4_time, open) < request.security(syminfo.tickerid, TF_4_time, close) ? true:false
TF_4_color = TF_4 ? upcolor:downcolor

TF_global = TF_1 and TF_2 and TF_3 and TF_4
TF_global_bear = TF_1 == false and TF_2 == false and TF_3 == false and TF_4 == false
TF_global_color = TF_global ? green : TF_global_bear ? red : white
TF_trigger_width = TF_global ? 6 : width

plot(1, style=linestyle, linewidth=width, color=TF_1_color)
plot(5, style=linestyle, linewidth=width, color=TF_2_color)
plot(10, style=linestyle, linewidth=width, color=TF_3_color)
plot(15, style=linestyle, linewidth=width, color=TF_4_color)
plot(25, style=linestyle, linewidth=4, color=TF_global_color)

exitCondition_Long = TF_global_bear
exitCondition_Short = TF_global

longCondition = TF_global
if (longCondition)
    strategy.entry("MTF_Long", strategy.long, qty=transaction_size, when=strategy.position_size == 0)

shortCondition = TF_global_bear
if (shortCondition)
    strategy.entry("MTF_Short", strategy.short, qty=transaction_size, when=strategy.position_size == 0)

strategy.close("MTF_Long", when=exitCondition_Long)
strategy.close("MTF_Short", when=exitCondition_Short)
Detail
https://www.fmz.com/strategy/436859
Last Modified
2023-12-28 11:57:00
