Name
多时间轴协同交易策略MT-Coordination-Trading-Strategy
Author
ChaoZhang
Strategy Description
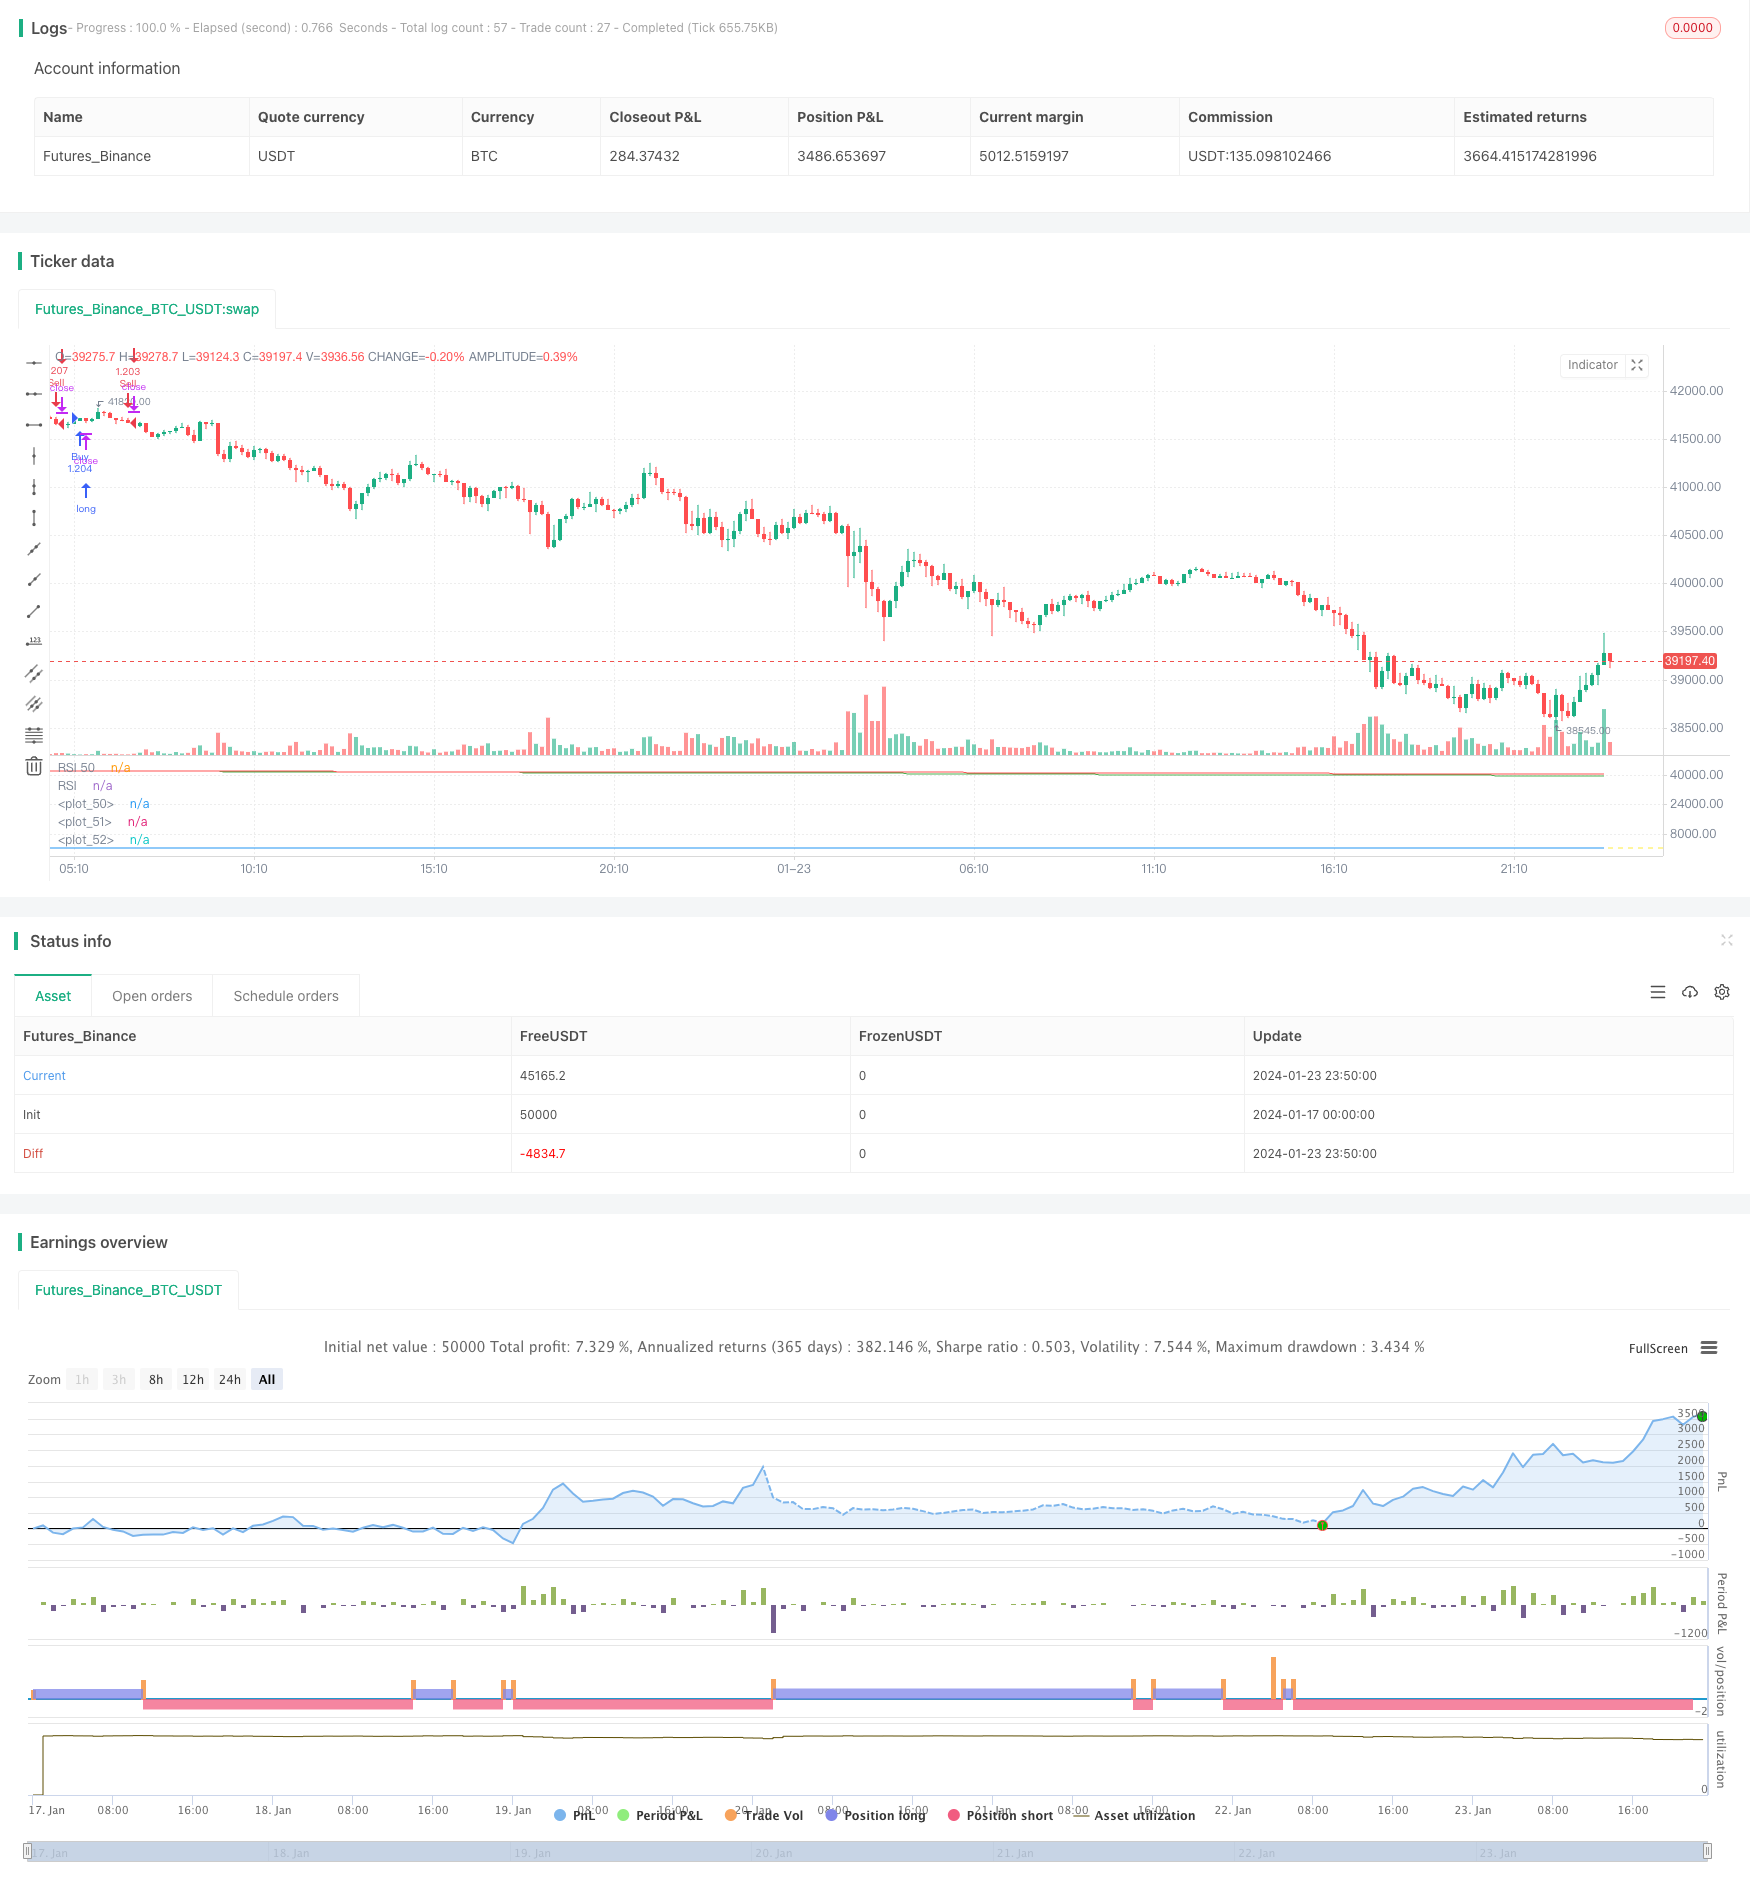
多时间轴协同交易策略(MT-Coordination Trading Strategy)是一个高级的量化交易策略。它整合了多种技术指标,能够识别市场的短期交易机会。该策略由知名交易员I3ig_Trades设计,专门用于金融市场的高频交易。
该策略融合了三个不同周期的平滑移动平均线(21日线、50日线和200日线)、相对强弱指数(14日RSI)和威廉指标(2日)。具体交易逻辑如下:
多头入场信号:当收盘价高于所有三条均线,RSI高于50,且当前K线的最高价高于上一根K线的向上三角形。此时开多仓。
空头入场信号:当收盘价低于所有三条均线,RSI低于50,且当前K线的最低价低于上一根K线的向下三角形。此时开空仓。
头寸大小根据选定的百分比和杠杆水平动态计算。
这套策略结合多种指标过滤假信号,找到高概率的Breakout点位入场,极大降低了交易风险。同时,头寸按照账户权益的一定比例设定,又控制了单笔损失。
具体优势有:
-
使用多时间轴指标进行确认,避免被套。短线、中线和长线均线能识别不同级别的趋势。
-
RSI避免过热过冷区域交易。RSI高于50为看多信号,低于50为空头信号。
-
威廉指标进一步验证突破。仅在价格突破该指标的极值点时才入场。
-
动态头寸按账户金额百分比计算,严格控制单笔亏损。
-
可自定义参数,适应不同交易风格。
该策略主要面临以下风险:
-
无法完全避免套牢的风险。当三条均线发生背离时,存在交易被套的可能。
-
无法在趋势反转前及时出场。指标存在滞后,无法预知反转。
-
亏损oom的风险。极端行情下,单笔亏损超过了预设。
对策:
- 优化均线组合,找到最佳参数。
- 增加阳线阴线过滤,进一步避免假突破。
- 适当调小百分比和杠杆水平。
该策略仍可从以下维度进行优化:
-
测试不同均线和RSI参数的組合,找到最优参数。
-
增加其他过滤指标,如币安宽度,进一步识别趋势 traderjack的信号等。
-
增加止损策略,在亏损达到一定比例时止损。
-
结合深度学习模型判断关键支撑阻力。
-
使用自适应百分比头寸管理系统,让头寸大小更合理。
多时间轴协同交易策略是一套成熟的高频突破策略。它融合多种指标减少假信号,动态头寸严格控制单笔亏损。该策略适合有一定资金规模的私募基金和专业交易员使用。通过持续优化参数和模型,能够获得长期稳定收益。
||
The MT-Coordination Trading Strategy is an advanced quantitative trading strategy integrating multiple technical indicators to identify short-term trading opportunities in financial markets. Designed by renowned trader I3ig_Trades, it is specialized for high-frequency trading.
The strategy incorporates three Smoothed Moving Averages (SMA) of different timeframes (21, 50, 200), the 14-day Relative Strength Index (RSI) and the Williams Fractals (2 days). The specific entry logic is defined as follows:
Long signal: Triggered when close is above all three SMAs, RSI is above 50 and current high is greater than the previous fractal up.
Short signal: Activated when close is below all three SMAs, RSI is below 50 and current low is less than the previous fractal down.
Position sizing is dynamically calculated based on selected percentage of equity and leverage level.
This strategy combines multiple indicators to filter out false signals and identify high probability breakout levels, greatly reducing trading risk. Meanwhile, the position sizing is set according to a percentage of account equity, controlling single loss.
Specific strengths are:
-
Using multi timeframe indicators for confirmation to avoid traps. SMAs recognize trends across short, medium and long terms.
-
RSI avoids overbought and oversold zones. Values above 50 signal bullishness and below 50 signal bearishness.
-
Williams Fractals further verify the breakout, only entering on penetration of extremes.
-
Dynamic position sizing based on percentage of account balance strictly manages downside.
-
Customizable parameters suit different trading styles.
The main risks of this strategy include:
-
Failure to fully avoid whipsaws when SMAs diverge.
-
Inability to exit timely before trend reversal due to lagging indicators.
-
Risk of losing the full position in extreme moves when loss exceeds preset.
Solutions:
-
Optimize SMAs combinations to find best parameters.
-
Add candlestick filters to further avoid false breakouts.
-
Reduce percentage and leverage levels appropriately.
The strategy can be further enhanced by:
-
Testing different combinations of SMAs and RSI for optimal parameters.
-
Incorporating additional filters like Bollinger Bands width, traderjack signals etc.
-
Adding stop loss mechanisms to cut losses at a predefined level.
-
Integrating deep learning models for support and resistance detection.
-
Implementing adaptive position sizing scheme for sensible scaling of positions.
The MT-Coordination Trading Strategy is a mature breakout system leveraging multiple timeframes. By combining indicators to filter signals and dynamically managing position sizing, it is capable of consistent profits for capitalized funds and professional traders through continuous parameter tuning and model optimization.
[/trans]
Strategy Arguments
| Argument | Default | Description |
|---|---|---|
| v_input_float_1 | true | Leverage |
| v_input_float_2 | 100 | Percent of Portfolio |
| v_input_int_1 | 14 | RSI Length |
| v_input_int_2 | 2 | Williams Fractals Length |
| v_input_int_3 | 21 | SMA 21 Length |
| v_input_int_4 | 50 | SMA 50 Length |
| v_input_int_5 | 200 | SMA 200 Length |
| v_input_1 | Buy Entry Parameters | |
| v_input_2 | Buy Exit Parameters | |
| v_input_3 | Sell Entry Parameters | |
| v_input_4 | Sell Exit Parameters |
Source (PineScript)
/*backtest
start: 2024-01-17 00:00:00
end: 2024-01-24 00:00:00
period: 10m
basePeriod: 1m
exchanges: [{"eid":"Futures_Binance","currency":"BTC_USDT"}]
*/

//@version=5
// Written by I3ig_Trades. Follow And Let Me Know Any Strategies You'd Like To See!
strategy("Best Scalping Strategy Period (TMA)", shorttitle="Best Scalping Strategy Period (TMA)", overlay=false,
         initial_capital=100000,
         default_qty_type=strategy.percent_of_equity,
         default_qty_value=100)

// Leverage Input
leverage = input.float(1, title="Leverage", minval=1, step=0.1)

// Calculate position size based on the percentage of the portfolio and leverage
percentOfPortfolio = input.float(100, title="Percent of Portfolio")

// Define input options
rsiLength = input.int(14, title="RSI Length", minval=1)
williamsLength = input.int(2, title="Williams Fractals Length", minval=1)
sma21Length = input.int(21, title="SMA 21 Length", minval=1)
sma50Length = input.int(50, title="SMA 50 Length", minval=1)
sma200Length = input.int(200, title="SMA 200 Length", minval=1)

// Smoothed Moving Averages
sma21 = ta.sma(close, sma21Length)
sma50 = ta.sma(close, sma50Length)
sma200 = ta.sma(close, sma200Length)

// RSI
rsiValue = ta.rsi(close, rsiLength)

// Williams Fractals
fractalUp = ta.highest(close, williamsLength)
fractalDown = ta.lowest(close, williamsLength)

// Conditions for Buy Entry
buyCondition = close > sma21 and close > sma50 and close > sma200 and rsiValue > 50 and high > fractalUp[1]

// Conditions for Sell Entry
sellCondition = close < sma21 and close < sma50 and close < sma200 and rsiValue < 50 and low < fractalDown[1]

positionSizePercent = percentOfPortfolio / 100 * leverage
positionSize = strategy.equity * positionSizePercent / close

// Executing strategy with dynamic position size
if buyCondition
    strategy.entry("Buy", strategy.long, qty=positionSize)

if sellCondition
    strategy.entry("Sell", strategy.short, qty=positionSize)

// Plotting the Smoothed Moving Averages
plot(sma21, color=color.white)
plot(sma50, color=color.green)
plot(sma200, color=color.red)

// Plotting RSI and Fractals for visual confirmation
hline(50, "RSI 50", color=color.yellow)
plot(rsiValue, color=color.blue, title="RSI")

// Input text boxes for trading actions
var buy_entry_params = input("", title="Buy Entry Parameters")
var buy_exit_params = input("", title="Buy Exit Parameters")
var sell_entry_params = input("", title="Sell Entry Parameters")
var sell_exit_params = input("", title="Sell Exit Parameters")
Detail
https://www.fmz.com/strategy/439981
Last Modified
2024-01-25 15:06:04
