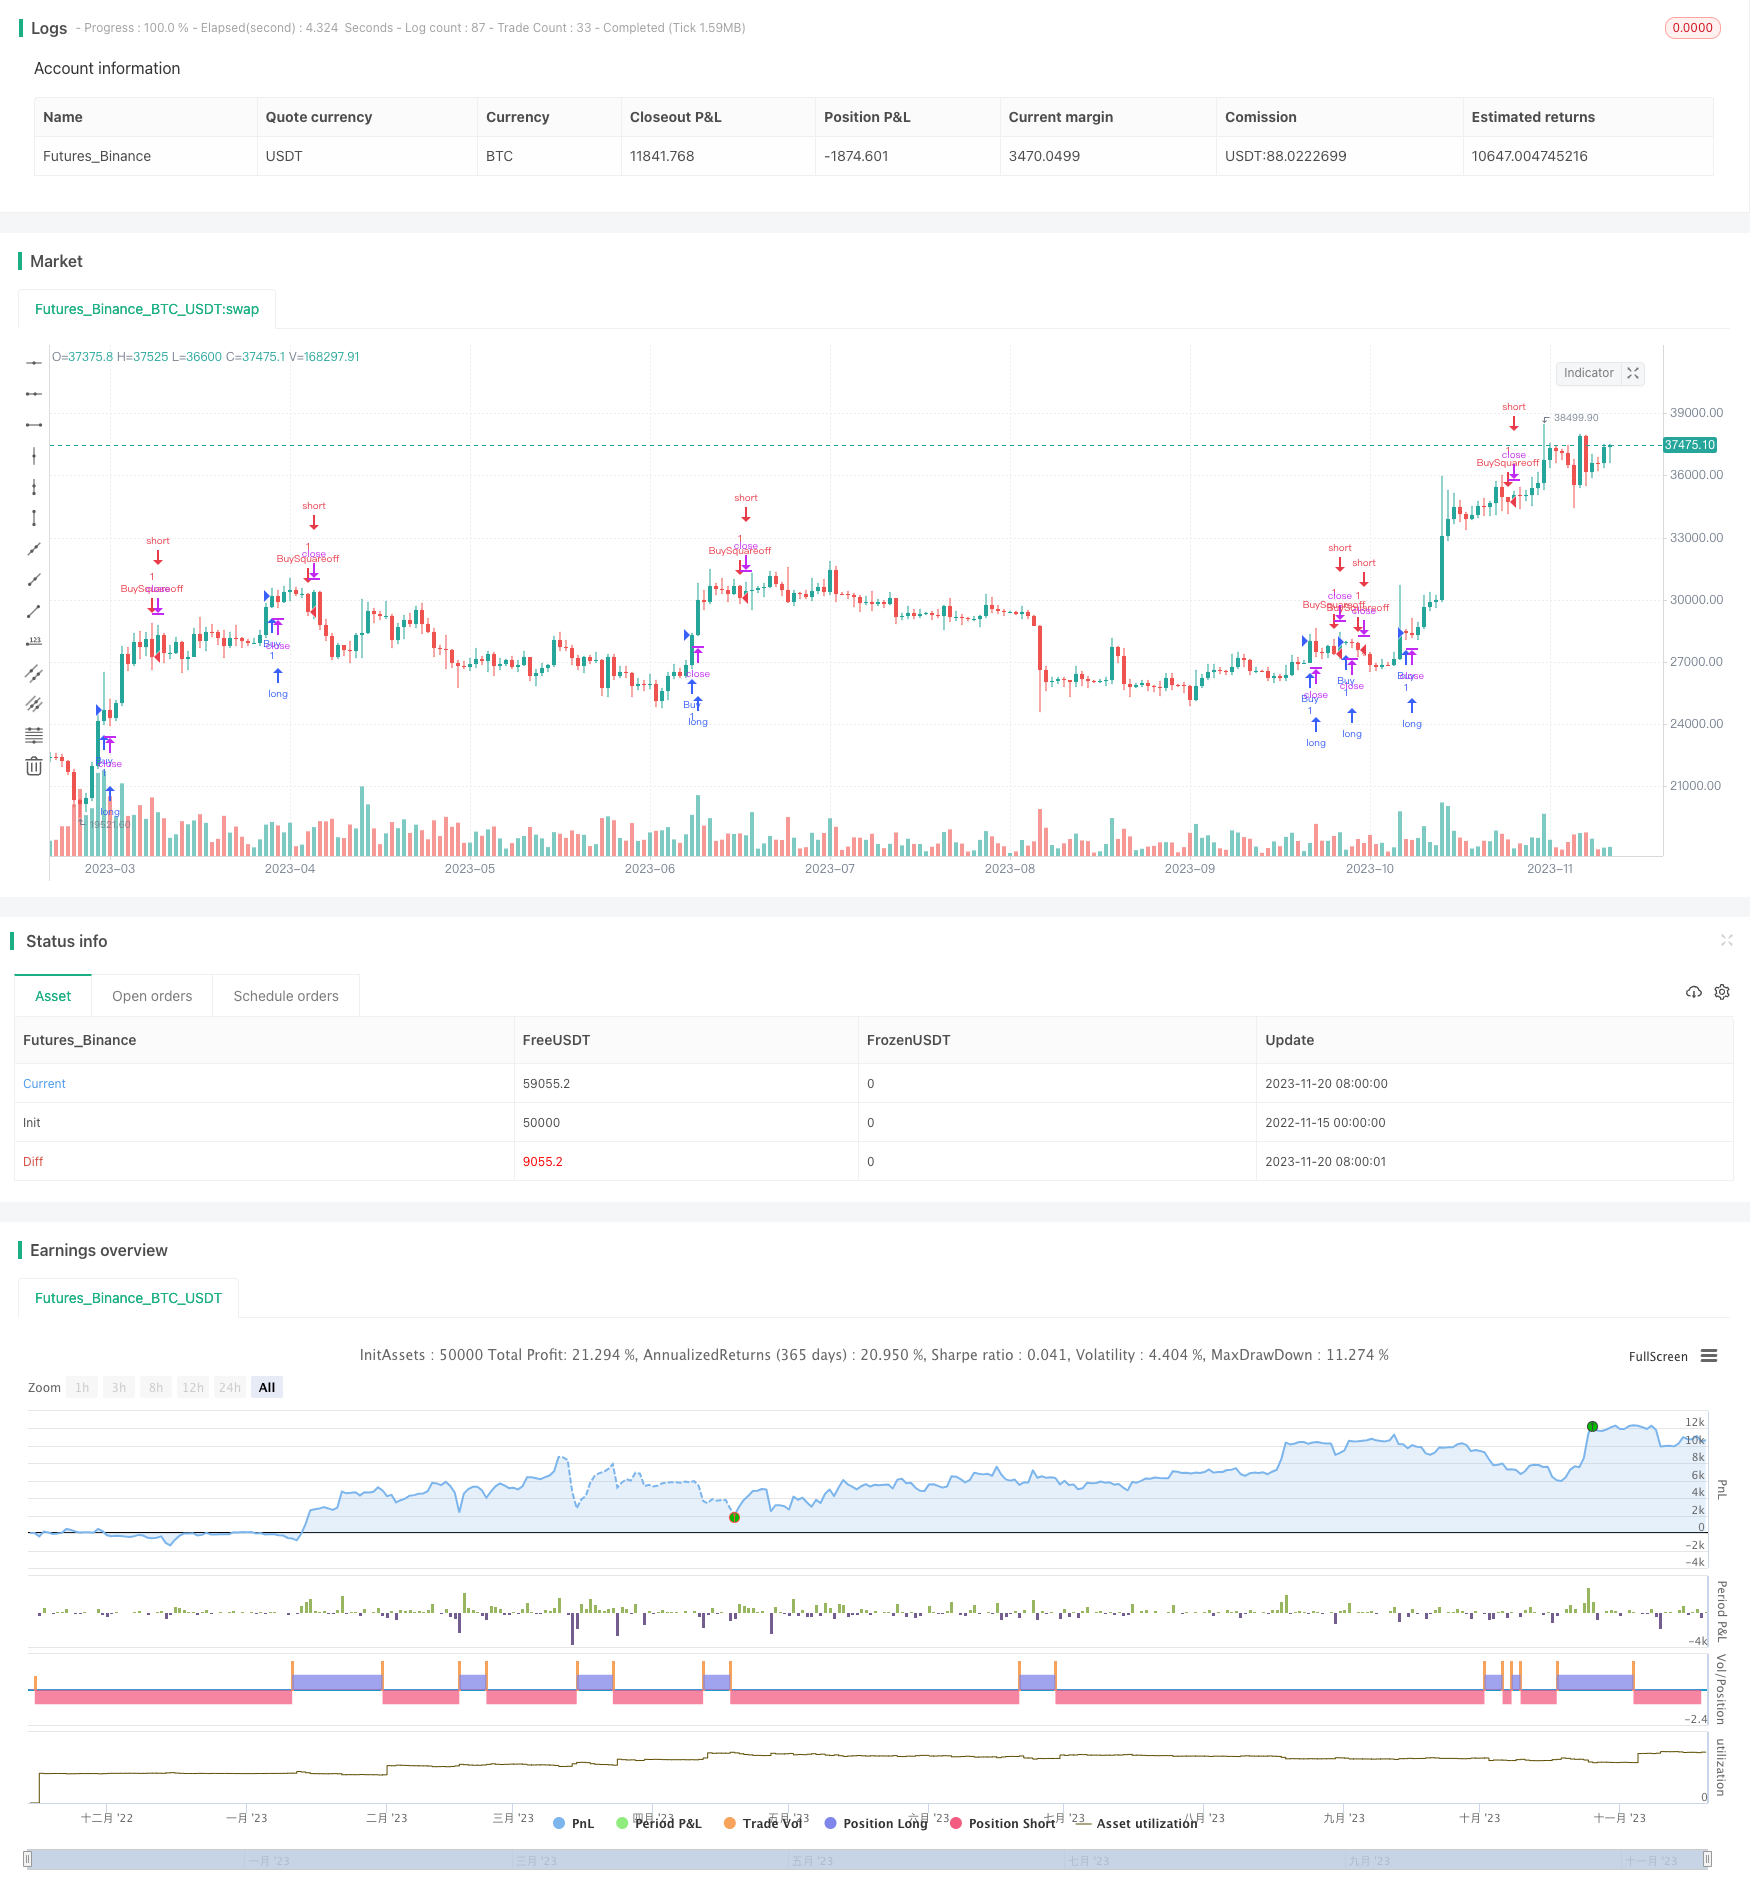
Name
多种技术指标动量突破策略multiple-technical-indicators-Momentum-Breakout-Strategy
Author
ChaoZhang
Strategy Description
[trans]
这个策略综合考虑多种技术指标,在判断市场有较强的多头动量时,进行买入操作。具体来说,策略会同时考虑MACD、RSI、ADX、Stochastic和布林带这5个指标,当这些指标同时符合多头条件时生成买入信号。
这个策略的核心逻辑是在判断市场有较强的多头动能后买入。具体判断规则如下:
- 5分钟、15分钟和60分钟MACD的当前柱体都上涨
- RSI大于60
- ADX大于12
- Stochastic %K线上穿%D线
- 布林带上轨上涨
当上述5个条件同时成立时,认为市场多头动能较强,この时进行买入操作。
交易退出规则为5分钟收盘价下破5分钟EMA时退出当前仓位。
这个策略有以下几个优势:
- 综合多个指标,判断市场总体多头趋势,避免被单一指标误导
- 利用高低时间轴指标组合,判断市场多头动量的持续性
- 退出机制严格,避免亏损扩大
- 交易频率适中,不会过于密集交易
总的来说,这个策略判断准确,风险控制得当,适合捕捉短线多头行情。
该策略也存在一些风险:
- 多个指标组合判断,增加了汇入场错误的概率
- 退出机制可能过于严格,可能会过早退出正确的交易
- 交易频率较高,过于频繁交易会增加手续费负担
总体来说,这个策略的风险主要在汇入场错误和过早退出上,这需要通过参数优化和规则调整来减轻。
对这个策略可以从以下几个方向进行优化:
- 优化MACD参数,找到更加符合市场规律的参数组合
- 调整RSI参数,寻找更好的超买超卖区间
- 优化Stochastic的参数,找到更好的交叉组合
- 调整布林带参数,使布林带更好反映市场波动性
- 优化或替换退出机制规则,降低错误退出概率
通过参数和规则优化,能够进一步提升这个策略的盈利水平和风险控制能力。
这个策略综合考虑多种指标判断市场多头趋势, exit机制较为严格。策略判断准确,能捕捉短线行情,风险控制也较好。通过持续优化参数和交易规则,能进一步增强策略的效果。总体而言,该策略具有较强的实用性。
||
This strategy considers multiple technical indicators comprehensively and takes long position when the market is judged to have strong bullish momentum. Specifically, this strategy takes into account MACD, RSI, ADX, Stochastic and Bollinger Band these 5 indicators. It generates buy signals when all these indicators meet bullish criteria simultaneously.
The core logic of this strategy is to buy when the market is determined to have strong bullish momentum. The specific judging rules are as follows:
- The current MACD bars of 5-minute, 15-minute and 60-minute charts are rising.
- RSI is greater than 60
- ADX is greater than 12
- Stochastic %K crosses over %D
- Bollinger Band upper band rises
When all the 5 conditions above are met, the market is considered to have strong bullish momentum. At this time, a long position will be taken.
The exit rule is to close current position when 5-minute closing price breaks below 5-minute EMA.
The advantages of this strategy include:
- Combining multiple indicators prevents being misguided by a single one
- Using indicators across timeframes judges sustainability of bullish momentum
- Strict exit mechanism prevents enlarged losses
- Appropriate trading frequency without over-trading
In general, this strategy has accurate judgement, proper risk control and is suitable to capture short-term bullish trends.
This strategy also has some risks:
- Combining multiple indicators increases probability of wrong entry
- Exit mechanism may be too strict, causing premature exit from right trades
- High trading frequency increases burden of commission fees
In summary, the main risks of this strategy lies in wrong entry and premature exit. These need to be alleviated through parameter tuning and rule adjustment.
This strategy can be optimized in the following aspects:
- Optimize MACD parameters to find combinations better fitting the market
- Adjust RSI parameters to locate better overbought/oversold zones
- Optimize Stochastic parameters for better crossovers
- Tune Bollinger Band parameters for better reflection of market volatility
- Optimize or replace exit rules to reduce premature exits
Through parameter and rule optimization, this strategy's profitability and risk control ability can be further improved.
This strategy judges bullish trend by combining multiple indicators with relatively strict exits. It has accurate judgement, able to capture short-term trends and proper risk control. Continuous optimization over parameters and trading rules can further enhance the strategy. In summary, this is a practical strategy with strong usability.
[/trans]
Strategy Arguments
| Argument | Default | Description |
|---|---|---|
| v_input_1 | 14 | Stochastic Length |
| v_input_2 | 3 | %K Smoothing |
| v_input_3 | 3 | %D Smoothing |
Source (PineScript)
/*backtest
start: 2022-11-15 00:00:00
end: 2023-11-21 00:00:00
period: 1d
basePeriod: 1h
exchanges: [{"eid":"Futures_Binance","currency":"BTC_USDT"}]
*/

// This source code is subject to the terms of the Mozilla Public License 2.0 at https://mozilla.org/MPL/2.0/
// © makarandpatil

// This strategy is for Bank Nifty instrument and for intraday purpose only
// It checks for various indicators and gives a buy signal when all conditions are met
// Bank Nifty when in momentum gives 100-200 points in spot in 5-15 min which is how long the trade duration should be
// Issues - The custom script as per TradingView Pinescripting has an issue of repaint
// More information on repainting issue in this link - https://www.tradingview.com/pine-script-docs/en/v5/concepts/Repainting.html
// Use the script alert only to get notified, however check all the parameters individually before taking the trade
// Also, please perform a backtesting and deep backtesting of this strategy to see if the strategy gave correct buy signals in the past
// The script is made for testing purposes only and is in beta mode. Please use at own risk.

//@version=5
strategy("BankNifty_Bullish_Intraday", overlay=true, margin_long = 100, margin_short = 100)

// Variables
StochLength = input(14, title="Stochastic Length")
smoothK = input(3, title="%K Smoothing")
smoothD = input(3, title="%D Smoothing")


//INDICATOR CALCULATIONS

// 1. MACD
[macdLine, signalLine, histLine] = ta.macd(close[0],12,26,9)

macd5 = request.security(syminfo.tickerid, "5", macdLine)
macd15 = request.security(syminfo.tickerid,"15",macdLine)
macd60 = request.security(syminfo.tickerid,"60",macdLine)

// 2. RSI Calculation
xRSI = ta.rsi(close, 14)

// 3. ADX calculation
[diplus, diminus, adx] = ta.dmi(14,14)
// plot(adx,color = color.black)

// 4. Stochastic Calculation
k = ta.sma(ta.stoch(close, high, low, StochLength), smoothK)
d = ta.sma(k, smoothD)

// 5. Bollinger Band calculation
[middle, upper, lower] = ta.bb(close, 20, 2)


//CONDITIONS

// 1. Conditions for MACD
macd5Uptick = macd5[0] > macd5[1]
macd15Uptick = macd15[0] > macd15[1]
macd60Uptick = macd60[0] >= macd60[1]

// 2. Condition for xRSI
RSIStrong = xRSI > 60

// 3. Condition for ADX
ADXUngali = adx >= 12

// 4. Condition for Stochastic
StochPCO = k > d

// 5. Condition for Bollinger Band
BBCU = upper > upper [1]

//Evaluate the long condition
// longCondition = macd5Uptick and macd15Uptick and RSIStrong and ADXUngali and StochPCO and BBCU
longCondition = macd5Uptick and macd15Uptick and macd60Uptick and RSIStrong and ADXUngali and StochPCO and BBCU
// longCondition = macd5Uptick and macd15Uptick and RSIStrong and ADXUngali and StochPCO and BBCU

if (longCondition)
    strategy.entry("Buy", strategy.long,alert_message = "BankNifty_Buy_Momentum")

shortCondition = close < ta.ema(close,5)
if (shortCondition)
    strategy.entry("BuySquareoff", strategy.short, alert_message = "BankNifty_Closed_Below_5EMA")
Detail
https://www.fmz.com/strategy/432900
Last Modified
2023-11-22 15:56:43
