Name
多重移动平均线综合策略Multiple-Moving-Average-Comprehensive-Strategy
Author
ChaoZhang
Strategy Description
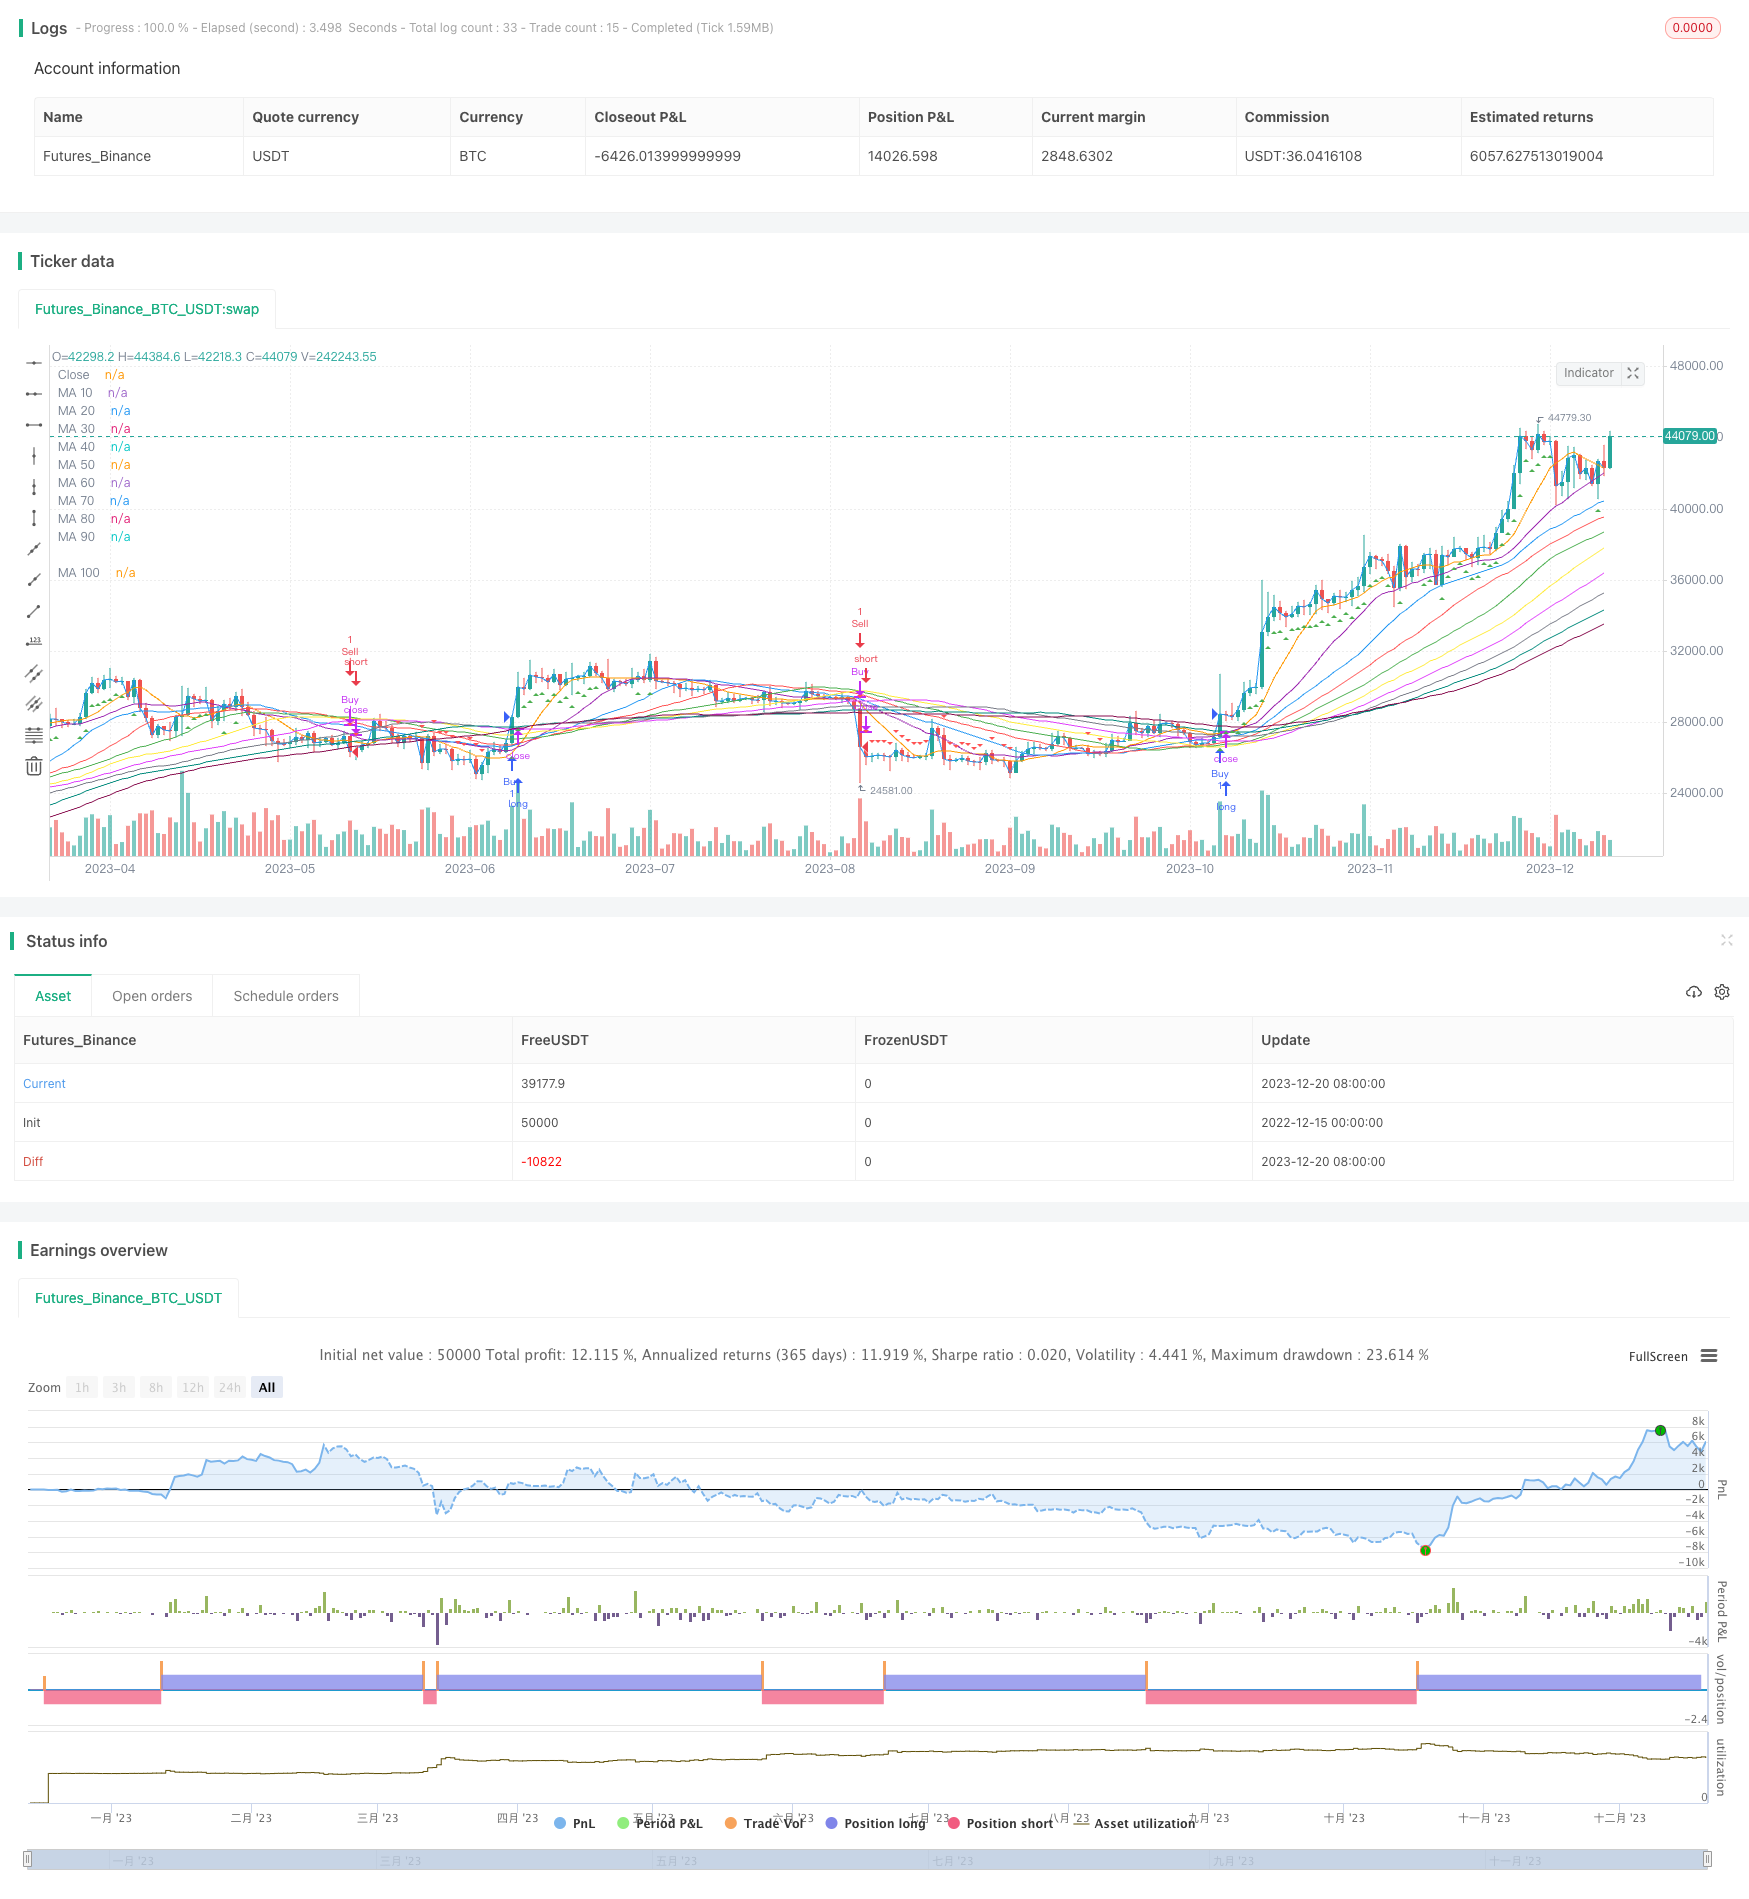
多重移动平均线综合策略是一种非常全面和通用的技术分析策略。它结合了多重时间周期的移动平均线,以提供对市场趋势的全面洞察。该策略通过生成清晰的买入和卖出信号,有助于识别潜在的入场和退出点。它还提供了强大的可定制性,允许用户根据自己的交易偏好和目标调整移动平均线长度。
该策略的核心是计算和跟踪多条不同长度期间的移动平均线,具体包括10日、20日、30日直至100日的移动平均线。这些移动平均线被设定为当天的收盘价与过去一定周期(如10日、20日等)的收盘价的平均值。例如20日移动平均线是过去20日收盘价的平均值。
当今天的收盘价高于所有这些移动平均线时,产生买入信号。当今天的收盘价低于所有这些移动平均线时,产生卖出信号。这样,只有当所有周期的移动平均线都指向同一个方向时,才会产生信号,从而过滤了很多噪音交易机会,使得信号更加可靠。
-
提供多时间尺度的洞察,能够适应不同的市场环境
-
通过多个确认,过滤 Noise,信号较为可靠
-
交易规则清晰,易于理解和实施
-
具备高度的自定义性,用户可以调整参数满足个性化需求
-
为入场、止损、止盈提供明确的指引,有助于风险管理
-
当市场处于震荡期时,多个移动平均线可能互相交叉,导致无明确信号产生。可通过调整移动平均线周期数量和长度来降低交叉概率。
-
未来期价格突破多个移动平均线的可能性较低,可能错过部分交易机会。可适当减少移动平均线数量,降低突破难度。
-
信号产生滞后,无法在价格转折点前捕捉趋势。结合其他先行指标如MACD可提高对趋势转折的判断。
-
交易次数可能不多,难以获得稳定收益。可以适当缩短移动平均线长度或与其他策略/指标组合使用。
-
参数调整:调整移动平均线周期数及长度,寻找最佳参数组合。例如可测试5日、10日和20日移动平均线的组合。
-
结合其他指标:与MACD、RSI等其他指标组合使用,提高策略的韧性。不同指标可实现互补。
-
策略组合:与其他策略如突破系统、趋势跟踪系统组合,提高稳定性。不同策略可分散风险。
-
自动寻优:采用算法自动测试不同参数,寻找期望最大化的参数组合。降低人工干预,提高效率。
多重移动平均线综合策略是一种非常全面和强大的策略工具。它提供多时间尺度洞察,信号较为可靠,易于理解使用,并具备高度自定义性。同时也存在一定局限性,但可通过调整参数、与其他模型组合等方式获得优化,从而适应更加复杂的市场情况。该策略既可作为学习工具辅助技术分析思维建立,也可供实盘交易使用。用户可根据自身需要进行调整,将其专属化。
||
The Multiple Moving Average Comprehensive Strategy is a very versatile and powerful technical analysis strategy. It combines multiple moving averages across different timeframes to provide comprehensive insights into market trends. The strategy generates clear buy and sell signals to identify potential entry and exit points. It also offers great customizability to allow users to adjust moving average lengths based on their trading preferences and objectives.
The core of this strategy is to compute and track multiple moving averages across different periods, specifically the 10-day, 20-day, 30-day up till 100-day moving averages. These moving averages are set to be the average closing price over the past 10, 20, 30 days etc. For example, the 20-day moving average is the average closing price over the past 20 days.
When today’s closing price is above all these moving averages, a buy signal is generated. When today’s closing price is below all these moving averages, a sell signal is generated. Thus, signals are only triggered when all the moving averages across different timeframes point in the same direction. This filters out a lot of noise and makes the signals more reliable.
-
Provides insights across multiple timescales, adaptable to different market environments
-
Filters out noise via multiple confirmations, making signals more reliable
-
Clear trading rules easy to understand and implement
-
Highly customizable to meet personalized requirements
-
Provides guidance for entries, stop losses and take profits, facilitating risk management
-
Multiple moving averages may cross during ranging markets, leading to unclear signals. This can be reduced by adjusting number and lengths of moving averages.
-
Probability of future price breaking multiple moving averages is low, potentially missing some trades. Number of moving averages can be reduced to lower breakout difficulty.
-
Signals are lagging, unable to capture trend reversals early. Incorporating leading indicators like MACD can improve turn point judgement.
-
Number of trades generated may be low for consistent income. Shortening moving average lengths or combining with other strategies/indicators can help.
-
Parameter Tuning: Adjust number and lengths of moving averages to find optimal parameter mix. 5-, 10- and 20-day combinations could be tested for example.
-
Combining Other Indicators: Adding indicators like MACD and RSI can improve strategy resilience. Different indicators provide complementarity.
-
Strategy Ensemble: Ensemble with other strategies like breakout systems and trend tracking can enhance robustness. Different strategies diversify risks.
-
Automated Optimization: Algorithmically test different parameter sets to maximize objective functions and find optimal parameters. Reduces manual interference and improves efficiency.
The Multiple Moving Average Comprehensive Strategy is a very versatile and powerful analytical tool. It provides multi-timescale insights, reliable signals, ease of use and understandability, and high customizability. At the same time, it has some limitations which can be addressed via parameter tuning, model combinations etc for adaptation to more complex market regimes. The strategy can serve as both a learning tool to aid technical analysis skill development as well as practical trading implementation after adjustments tailored to individual needs.
[/trans]
Source (PineScript)
/*backtest
start: 2022-12-15 00:00:00
end: 2023-12-21 00:00:00
period: 1d
basePeriod: 1h
exchanges: [{"eid":"Futures_Binance","currency":"BTC_USDT"}]
*/

//@version=5
strategy("Multiple Moving Average Strategy", overlay=true)

// Function to calculate moving average
get_ma(src, length) =>
    ta.sma(src, length)

// Initialize moving average lengths
ma_length_10 = 10
ma_length_20 = 20
ma_length_30 = 30
ma_length_40 = 40
ma_length_50 = 50
ma_length_60 = 60
ma_length_70 = 70
ma_length_80 = 80
ma_length_90 = 90
ma_length_100 = 100

// Calculate 10-day, 20-day, 30-day, 40-day, 50-day, 60-day, 70-day, 80-day, 90-day, and 100-day moving averages
ma_10 = get_ma(close, ma_length_10)
ma_20 = get_ma(close, ma_length_20)
ma_30 = get_ma(close, ma_length_30)
ma_40 = get_ma(close, ma_length_40)
ma_50 = get_ma(close, ma_length_50)
ma_60 = get_ma(close, ma_length_60)
ma_70 = get_ma(close, ma_length_70)
ma_80 = get_ma(close, ma_length_80)
ma_90 = get_ma(close, ma_length_90)
ma_100 = get_ma(close, ma_length_100)

// Generate Buy/Sell signals for the 10 moving averages
buy_signal = close > ma_10
sell_signal = close < ma_10

// Add conditions for each additional moving average length
buy_signal := buy_signal and (close > get_ma(close, ma_length_20))
sell_signal := sell_signal and (close < get_ma(close, ma_length_20))

buy_signal := buy_signal and (close > get_ma(close, ma_length_30))
sell_signal := sell_signal and (close < get_ma(close, ma_length_30))

buy_signal := buy_signal and (close > get_ma(close, ma_length_40))
sell_signal := sell_signal and (close < get_ma(close, ma_length_40))

buy_signal := buy_signal and (close > get_ma(close, ma_length_50))
sell_signal := sell_signal and (close < get_ma(close, ma_length_50))

buy_signal := buy_signal and (close > get_ma(close, ma_length_60))
sell_signal := sell_signal and (close < get_ma(close, ma_length_60))

buy_signal := buy_signal and (close > get_ma(close, ma_length_70))
sell_signal := sell_signal and (close < get_ma(close, ma_length_70))

buy_signal := buy_signal and (close > get_ma(close, ma_length_80))
sell_signal := sell_signal and (close < get_ma(close, ma_length_80))

buy_signal := buy_signal and (close > get_ma(close, ma_length_90))
sell_signal := sell_signal and (close < get_ma(close, ma_length_90))

buy_signal := buy_signal and (close > get_ma(close, ma_length_100))
sell_signal := sell_signal and (close < get_ma(close, ma_length_100))

// Plot Buy/Sell signals on the chart
plotshape(buy_signal, title="Buy Signal", color=color.green, style=shape.triangleup, location=location.belowbar)
plotshape(sell_signal, title="Sell Signal", color=color.red, style=shape.triangledown, location=location.abovebar)

// Execute long buy order when all ten moving averages give a Buy signal
if (buy_signal)
    strategy.entry("Buy", strategy.long)

// Execute sell order when all ten moving averages give a Sell signal
if (sell_signal)
    strategy.close("Buy")

// Execute short sell order when all ten moving averages give a Sell signal
if (sell_signal)
    strategy.entry("Sell", strategy.short)

// Execute buy order when all ten moving averages give a Buy signal
if (buy_signal)
    strategy.close("Sell")

// Plot closing price and moving averages on the chart
plot(close, title="Close", color=color.blue)
plot(ma_10, title="MA 10", color=color.orange)
plot(ma_20, title="MA 20", color=color.purple)
plot(ma_30, title="MA 30", color=color.blue)
plot(ma_40, title="MA 40", color=color.red)
plot(ma_50, title="MA 50", color=color.green)
plot(ma_60, title="MA 60", color=color.yellow)
plot(ma_70, title="MA 70", color=color.fuchsia)
plot(ma_80, title="MA 80", color=color.gray)
plot(ma_90, title="MA 90", color=color.teal)
plot(ma_100, title="MA 100", color=color.maroon)
Detail
https://www.fmz.com/strategy/436216
Last Modified
2023-12-22 11:56:42
