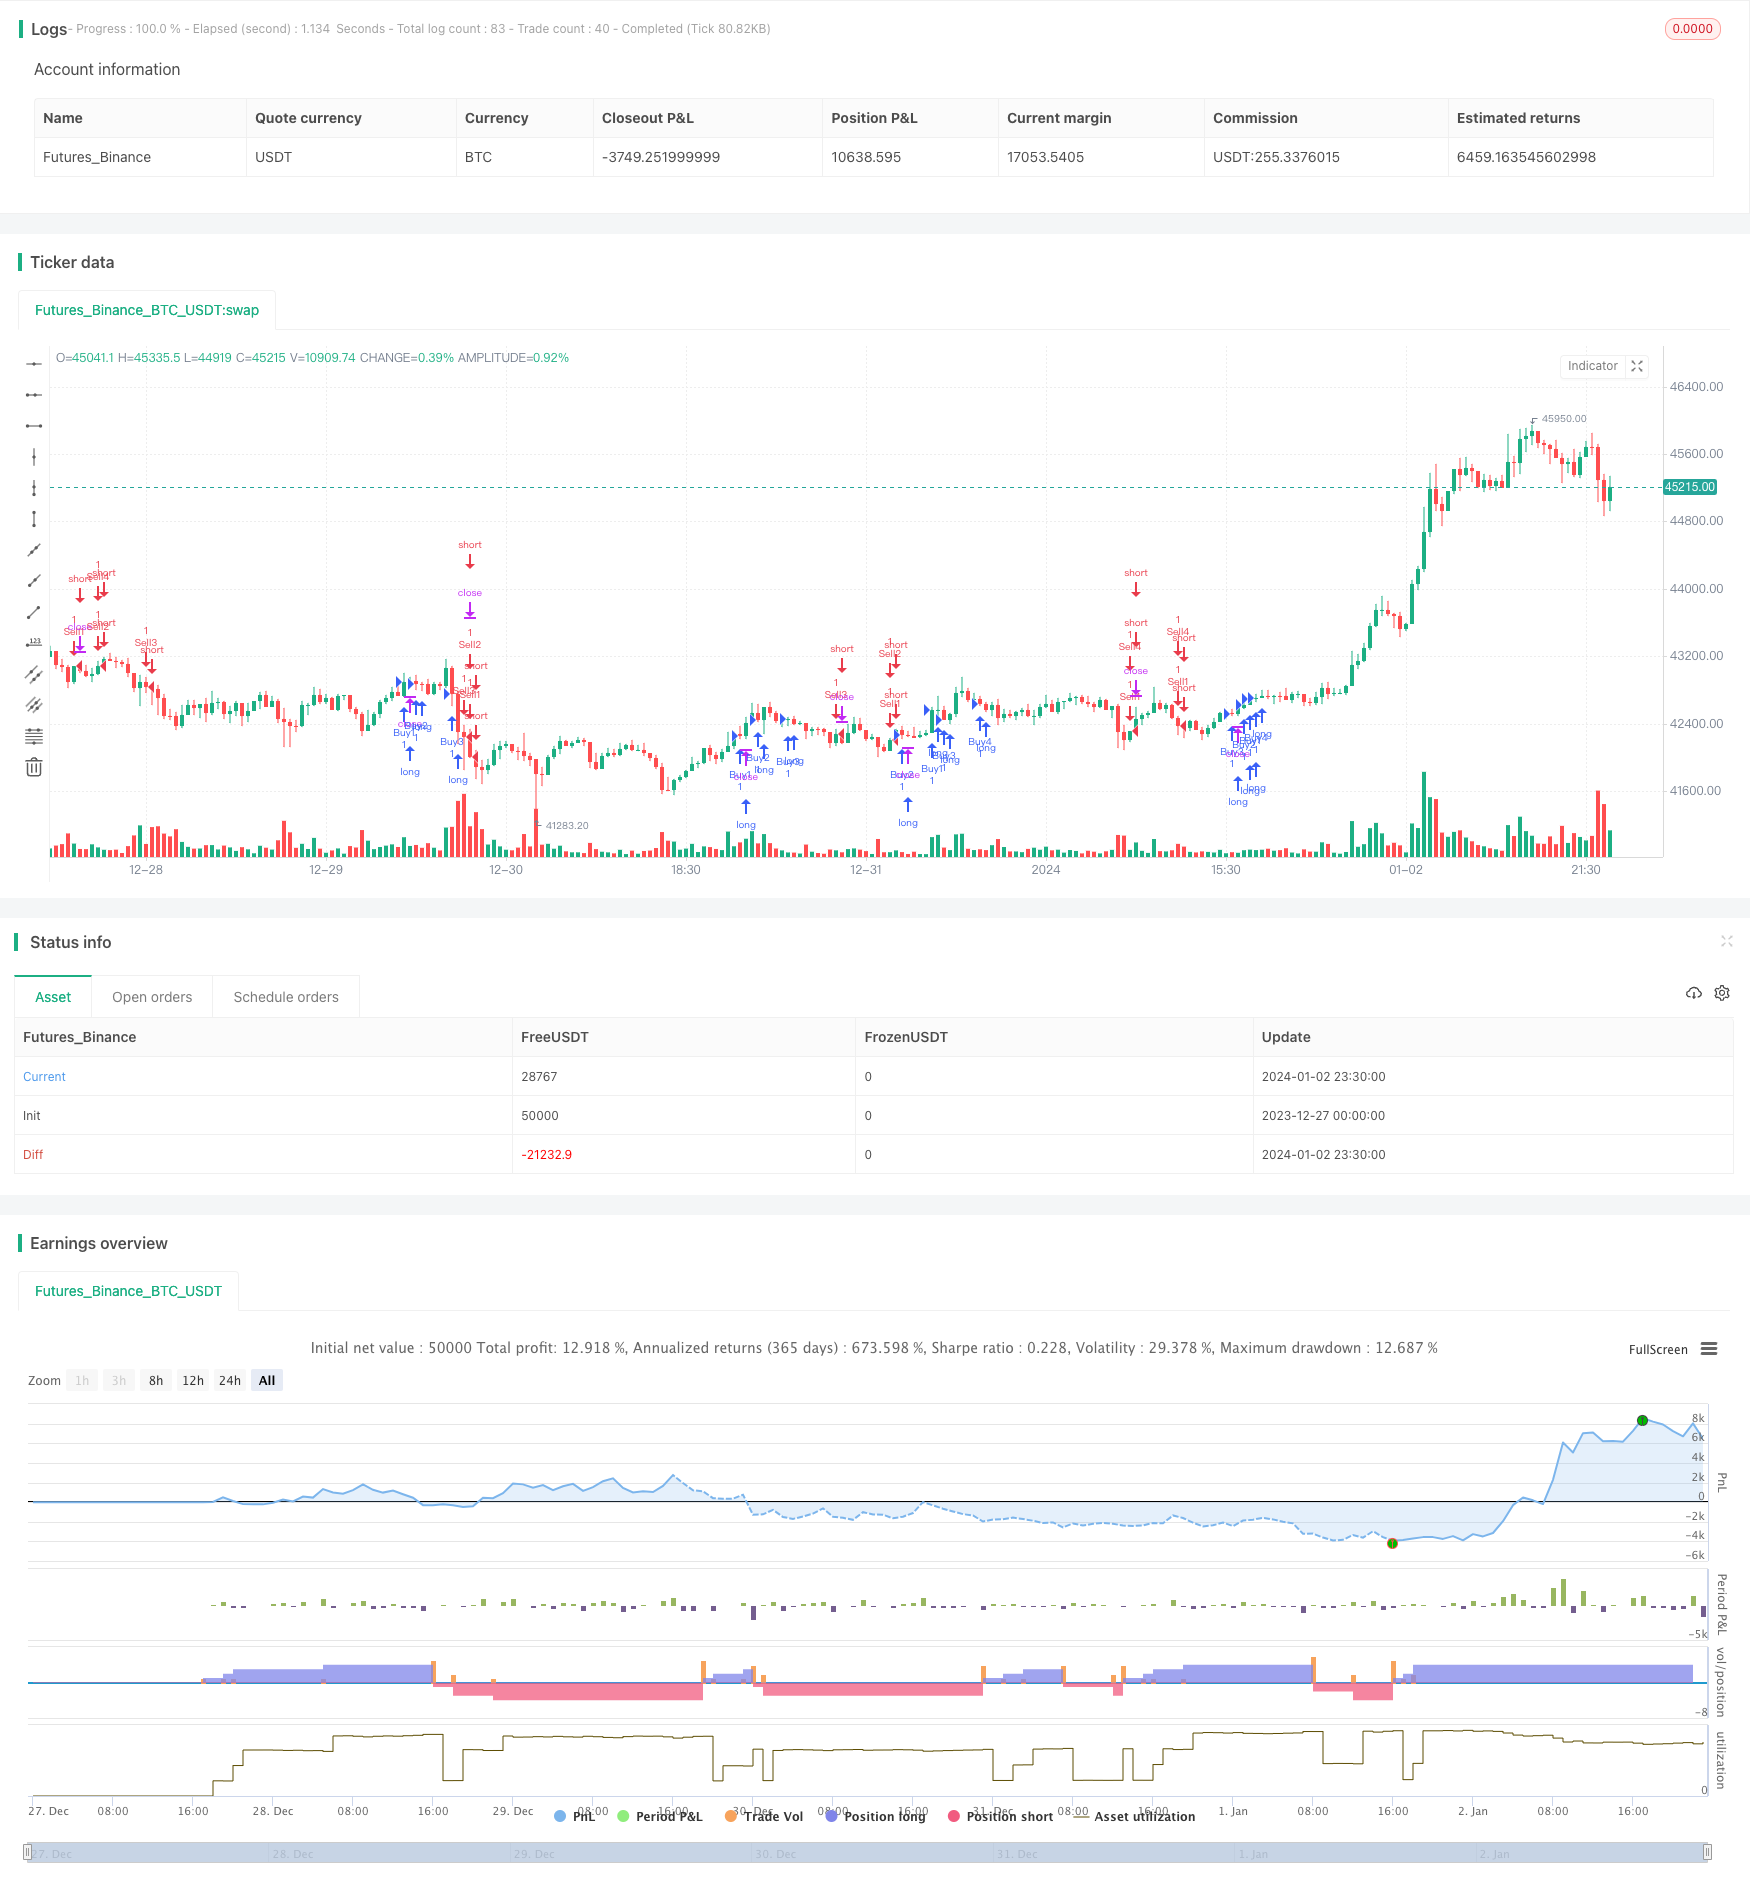
Name
多重EMA均线交叉趋势跟踪策略Multi-EMA-Crossover-Trend-Following-Strategy
Author
ChaoZhang
Strategy Description
[trans]
多重EMA均线交叉趋势跟踪策略通过组合使用多组不同参数的EMA均线,在较短周期EMA上形成金叉时做多,形成死叉时做空,实现趋势跟踪交易。该策略同时使用7组EMA均线,包括12、26、50、100、200、89和144周期,通过比较这些EMA的交叉情况来判断趋势方向。
该策略的核心逻辑是基于EMA均线的交叉原理。EMA均线中,周期较短的EMA对价格变化更为敏感,可以反映最近期的价格趋势;而周期较长的EMA对价格变化不那么敏感,可以反映长期趋势。当短周期EMA从下方上穿一个长周期EMA时,形成所谓的“金叉”,表示短期趋势转 bullish,可以设置做多订单。相反,当短周期EMA从上方下穿一个长周期EMA时,形成“死叉”,表示短期趋势转 bearish,可以设置做空订单。
该策略使用了7组EMA均线,包括12&26、12&50、12&100、12&200、12&89以及12&144。策略会同时比较这7组EMA的交叉情况。例如,当12日EMA上穿26日EMA形成金叉时,就会打开做多头寸;当发生死叉时就会平掉该做多头寸。策略对其他6组EMA均线也采用同样的逻辑。
该策略最大的优势在于可以同时捕捉多个时间尺度上的趋势。通过组合使用多个EMA均线,策略既可以捕捉短期趋势,又可以跟踪长期趋势,实现多时间轴的趋势跟踪。此外,该策略可以通过调整不同EMA的参数来优化表现。
该策略的主要风险在于多重EMA均线组合使用时可能出现交叉信号过于频繁的情况。例如,12日EMA和26日EMA之间交叉次数要比12日EMA和200日EMA之间交叉次数更频繁,如果不能控制开仓和平仓的频率,则会增加交易成本和滑点损失。此外,EMA均线本身对价格变化有滞后性,可能导致信号产生不及时。
为降低上述风险,可以适当优化EMA的周期参数,使其交叉频率处于合适区间;另外可以适当限制单日开仓次数或设置止损来控制风险。
该策略的优化空间主要集中在EMA均线的参数调整。可以尝试更多不同周期的参数组合;此外也可以试验其他类型的移动平均线如SMA。另外,策略可以加入附加条件来过滤信号,例如成交量指标、波动率指标等,从而提高信号质量。加入止损策略也可以进一步优化,降低市场剧烈波动的影响。
多重EMA均线交叉趋势跟踪策略通过比较多个EMA的交叉情况判断趋势方向,实现多时间尺度的趋势跟踪,是一种常见的趋势跟踪策略。该策略优势在于可以灵活调整参数,捕捉不同级别的趋势;劣势在于信号可能过于频繁,增加交易成本。通过参数优化以及加入辅助条件可以进一步提升策略表现。
||
The Multi-EMA Crossover Trend Following Strategy combines multiple EMA lines with different parameters to identify trend directions based on crossover signals, aiming to follow trends in the market. It utilizes 7 EMA lines, including periods of 12, 26, 50, 100, 200, 89 and 144, by comparing their crossover situations.
The core logic of this strategy is based on the crossover principles of EMA lines. Among EMAs, shorter period EMAs are more sensitive to recent price changes and can reflect near-term trends, while longer period EMAs are less sensitive and represent long-term trends. When a shorter EMA crosses above a longer EMA from below, a “golden cross” is formed, indicating the short-term trend is turning bullish. A “death cross” appears when a shorter EMA crosses below a longer EMA from above, signaling a bearish trend reversal.
This strategy monitors 7 groups of EMA crossovers simultaneously, including 12&26, 12&50, 12&100, 12&200, 12&89 and 12&144 periods. For example, when the 12-day EMA crosses above the 26-day EMA, the strategy will open a long position. It will close the long position when a death cross happens. The same logic applies to other EMA pairs.
The biggest advantage of this strategy is the ability to capture trends across multiple timeframes. By combining multiple EMAs, it can identify both short-term and long-term trends, realizing multi-timeframe trend following. In addition, the strategy performance can be optimized by adjusting EMA parameters.
The main risk of this strategy is overfrequent crossover signals when using multiple EMAs together. For example, crossovers between 12-day and 26-day EMAs happen more often than those between 12-day and 200-day lines. Frequent entries and exits may increase trading costs and slippage. Also, EMAs have lagging nature, which may cause untimely trade signals.
To mitigate the risks, EMA periods can be optimized to control crossover frequency at proper levels. Limiting max daily entry numbers or setting stop loss may also restrict risks.
The main optimization space lies in adjusting EMA parameters, such as experimenting with more period combinations or trying other moving averages like SMA. Additional filters can also be added to improve signal quality, for example, volume or volatility indicators. Furthermore, stop loss strategies may be used to reduce the impact of market turbulence.
The Multi-EMA Crossover Trend Following Strategy identifies trend directions by comparing crossover situations among multiple EMAs, capturing trends across timeframes. Its advantage is the flexibility to tweak parameters and catch trends on different levels. The drawback is potentially overfrequent signals and increased trading costs. Further improvements can be achieved through parameter optimization and adding supplementary conditions.
[/trans]
Strategy Arguments
| Argument | Default | Description |
|---|---|---|
| v_input_1_close | 0 | Source: close |
| v_input_2 | 12 | Shortest Line |
| v_input_3 | 26 | Shorter Line |
| v_input_4 | 50 | Short Line |
| v_input_5 | 100 | Middle Line |
| v_input_6 | 200 | Long Line |
| v_input_7 | 89 | Longer Line |
| v_input_8 | 144 | Longest Line |
Source (PineScript)
/*backtest
start: 2023-12-27 00:00:00
end: 2024-01-03 00:00:00
period: 30m
basePeriod: 15m
exchanges: [{"eid":"Futures_Binance","currency":"BTC_USDT"}]
*/

//@version=2
strategy("EMA Trades", overlay=true, pyramiding=4)

src = input(close, title="Source")

shortestLine = input(12, minval=1, title="Shortest Line")
shorterLine = input(26, minval=1, title="Shorter Line")
shortLine = input(50, minval=1, title="Short Line")
middleLine = input(100, minval=1, title="Middle Line")
longLine = input(200, minval=1, title="Long Line")
longerLine = input(89, minval=1, title="Longer Line")
longestLine = input(144, minval=1, title="Longest Line")

shortestLineOutput = ema(src, shortestLine)
shorterLineOutput = ema(src, shorterLine)
shortLineOutput = ema(src, shortLine)
middleLineOutput = ema(src, middleLine)
longLineOutput = ema(src, longLine)
longerLineOutput = ema(src, longerLine)
longestLineOutput = ema(src, longestLine)

//plot(shortestLineOutput, title="Shortest EMA", color=#ffffff)
//plot(shorterLineOutput, title="Shorter EMA", color=#e54fe6)
//plot(shortLineOutput, title="Short EMA", color=#4e6bc3)
//plot(middleLineOutput, title="Middle EMA", color=#1dd6d8)
//plot(longLineOutput, title="Long EMA", color=#d0de10)
//plot(longerLineOutput, title="Longer EMA", color=#ef6a1a)
//plot(longestLineOutput, title="Longest EMA", color=#ff0e0e)

longEnrtyCondition_1 = crossover(shortestLineOutput[1], shorterLineOutput[1]) and shortestLineOutput > shorterLineOutput
longEntryCondition_2 = crossover(shortestLineOutput[1], shortLineOutput[1]) and shortestLineOutput > shortLineOutput
longEnrtyCondition_3 = crossover(shortestLineOutput[1], middleLineOutput[1]) and shortestLineOutput > middleLineOutput
longEntryCondition_4 = crossover(shortestLineOutput[1], longLineOutput[1]) and shortestLineOutput > longLineOutput

shortEnrtyCondition_1 = crossunder(shortestLineOutput[1], shorterLineOutput[1]) and shortestLineOutput < shorterLineOutput
shortEntryCondition_2 = crossunder(shortestLineOutput[1], shortLineOutput[1]) and shortestLineOutput < shortLineOutput
shortEnrtyCondition_3 = crossunder(shortestLineOutput[1], middleLineOutput[1]) and shortestLineOutput < middleLineOutput
shortEntryCondition_4 = crossunder(shortestLineOutput[1], longLineOutput[1]) and shortestLineOutput < longLineOutput

if (longEnrtyCondition_1)
    strategy.entry("Buy1", strategy.long)
    strategy.exit("Sell1")

if (longEntryCondition_2)
    strategy.entry("Buy2", strategy.long)
    strategy.exit("Sell2")

if (longEnrtyCondition_3)
    strategy.entry("Buy3", strategy.long)
    strategy.exit("Sell3")

if (longEntryCondition_4)
    strategy.entry("Buy4", strategy.long)
    strategy.exit("Sell4")

if (shortEnrtyCondition_1)
    strategy.entry("Sell1", strategy.short)
    strategy.exit("Buy1")

if (shortEntryCondition_2)
    strategy.entry("Sell2", strategy.short)
    strategy.exit("Buy2")

if (shortEnrtyCondition_3)
    strategy.entry("Sell3", strategy.short)
    strategy.exit("Buy3")

if (shortEntryCondition_4)
    strategy.entry("Sell4", strategy.short)
    strategy.exit("Buy4")
Detail
https://www.fmz.com/strategy/437665
Last Modified
2024-01-04 16:22:07
