Name
大趋势指标多头策略Major-Trend-Indicator-Long
Author
ChaoZhang
Strategy Description
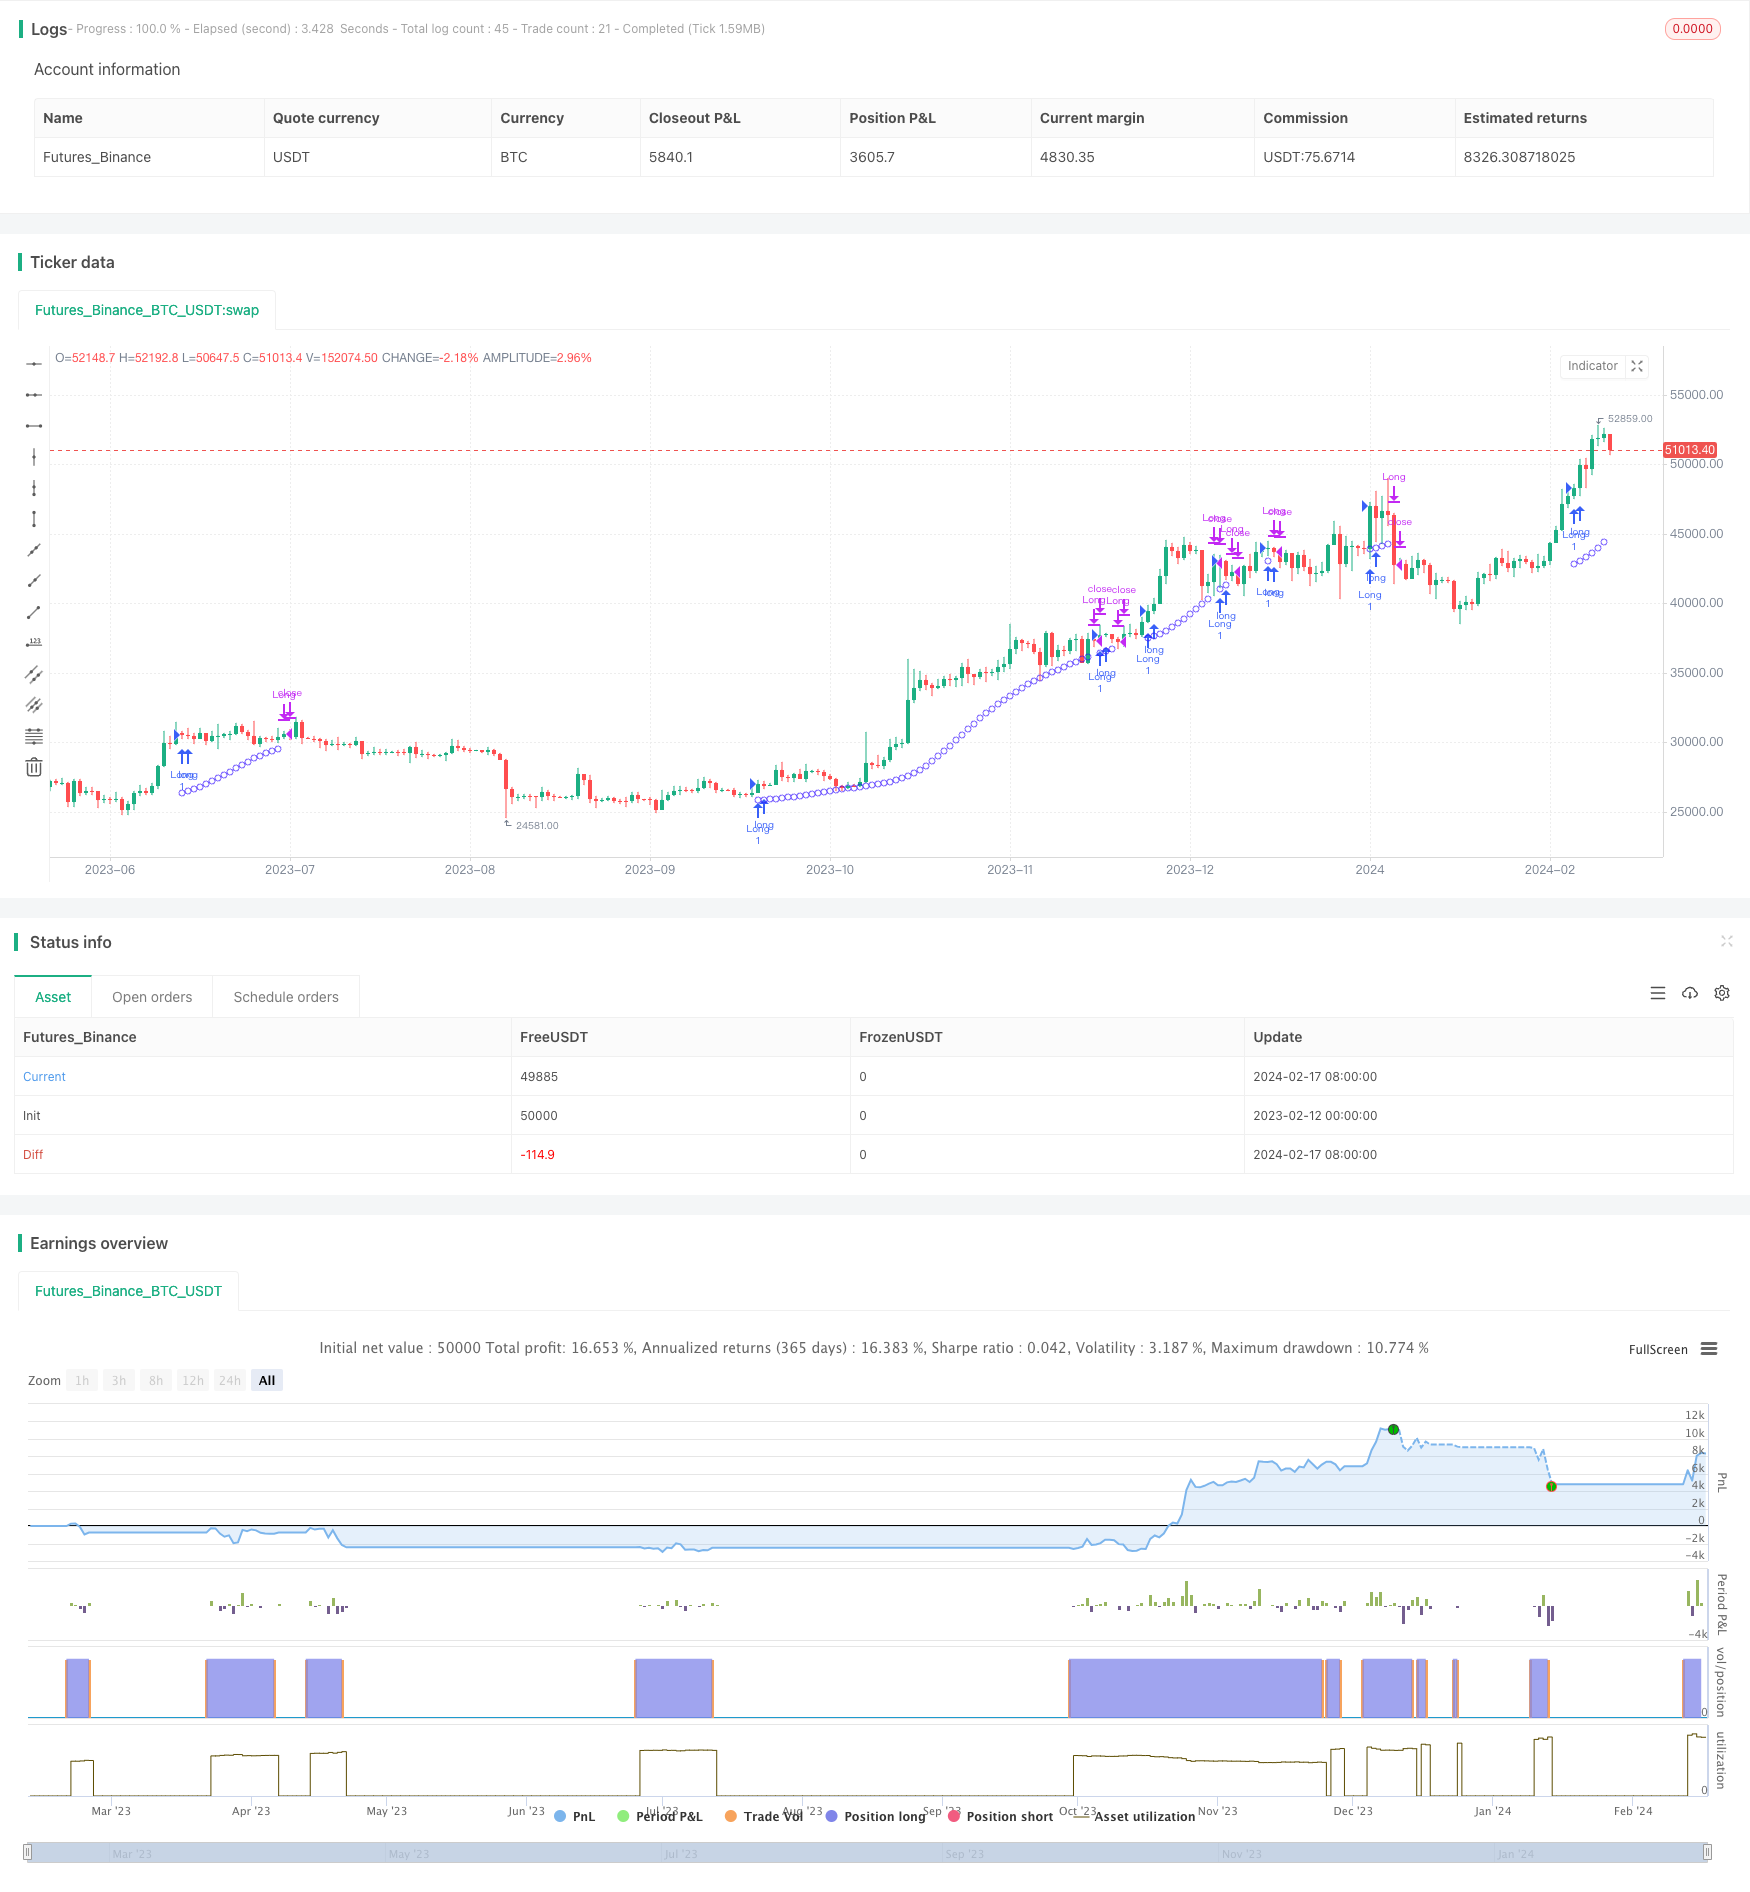
大趋势指标多头策略(Major Trend Indicator Long,简称MTIL)是一种用于各类金融工具(包括加密货币比特币、以太坊和传统股票如苹果公司)的交易策略。它设计用于识别潜在的多头趋势,以便进行长线建仓。
MTIL策略使用优化的参数,在特定的回看周期内计算最高价和最低价。然后应用线性回归方法对价格数据进行平滑处理,识别出潜在的牛市趋势,发出做多信号。
具体来说,该策略首先计算特定周期内的最高价和最低价。然后使用不同参数的线性回归对最高价和最低价进行平滑。这将产生上轨和下轨。当平滑后的最高价线突破上轨,而最低价线也突破下轨时,且收盘价的短期线性回归高于长期线性回归,则产生多头信号。
MTIL策略具有以下优势:
- 使用双重平滑技术识别趋势,准确率较高
- 回测起始时间可调,方便测试策略的历史表现
- 可自定义参数,调整至自己的交易偏好
- 可与空头策略组合,实现多时间轴分析
MTIL策略也存在以下风险:
- 趋势交易风险大,存在亏损放大的可能
- 参数设置不当可能导致错失机会或错误信号
- 需适当考量交易成本,避免过于频繁交易
可通过调整参数、设置止损、交易成本控制等方法规避部分风险。
MTIL策略可从以下几个方面进行优化:
- 测试不同周期参数的组合,寻找最优参数
- 增加量价确认机制,避免错误信号
- 结合其他指标判断力度和分时走势,进一步确认信号
- 设立止损和止盈策略,控制单次亏损和全局利润
MTIL是一个利用线性回归技术识别大趋势的多头策略。它可以通过参数调整适用于不同市场环境。与空头策略组合使用时,能够提供更全面的分析。经过优化调整后,其准确率和盈利能力都可得到提高。
||
The Major Trend Indicator Long (MTIL) strategy is designed for use across various financial instruments including cryptocurrencies like BTCUSD and ETHUSD as well as traditional stocks such as AAPL. It aims to identify potential bullish trends for entering long positions.
The MTIL strategy utilizes optimized parameters to calculate the highest and lowest prices within defined lookback periods. It then applies linear regression to smooth the price data, spotting potential uptrends to signal long entries.
Specifically, it first derives the highest and lowest prices over given periods. These are then smoothed using linear regression with differing coefficients. This results in the creation of upper and lower bounds. When the smoothed highest prices breach the upper band, the smoothed lowest prices breach the lower band, and the short term linear regression of closing prices is above that of the long term - a bullish signal is generated.
The MTIL strategy has the following advantages:
- Utilizes dual-smoothing techniques for trend identification with higher accuracy
- Customizable backtest start date for testing historical performance
- Customizable parameters catering to individual trading preferences
- Can be combined with short strategy for multi-timeframe analysis
The MTIL strategy also carries the following risks:
- Trend trading risks with possibility of magnified losses
- Inappropriate parameter tuning leading to missed opportunities or wrong signals
- Need to account for trading costs to avoid overly frequent trades
Some risks can be mitigated via parameter adjustment, stop losses, trade cost control etc.
The MTIL strategy can be optimized across the following dimensions:
- Testing combinations of different period parameters to find optimum
- Incorporating price-volume confirmation to avoid false signals
- Adding other indicators to further validate momentum and intraday moves to reinforce signal confirmation
- Establishing stop loss and take profit rules to limit downside vs lock in profits
The MTIL is a long side strategy harnessing linear regression techniques to spot major trends. Through parameter tuning it can be adapted across various market environments. When combined with a short side strategy it offers more comprehensive analysis. Further optimizations can enhance its accuracy and profitability.
[/trans]
Source (PineScript)
/*backtest
start: 2023-02-12 00:00:00
end: 2024-02-18 00:00:00
period: 1d
basePeriod: 1h
exchanges: [{"eid":"Futures_Binance","currency":"BTC_USDT"}]
*/

// This source code is subject to the terms of the Mozilla Public License 2.0 at https://mozilla.org/MPL/2.0/
// © jensenvilhelm


//@version=5
strategy("Major Trend Indicator Long", shorttitle='MTIL', overlay = true)

startDate = timestamp("2001 06 18")
// Sets the start date for the strategy.

// Optimized parameters
length_high = 5
length_low = 5
linReg_st = 3
linReg_st1 = 23
linReg_lt = 75
// Defines key parameters for the strategy.

X_i = ta.highest(high, length_high)
Y_i = ta.lowest(low, length_low)
// Calculates the highest and lowest price values within the defined lookback periods.

x_y = ta.linreg(X_i + high, linReg_st1, 1)
y_x = ta.linreg(Y_i + low, linReg_lt, 1)
// Applies linear regression to smoothed high and low prices.

upper = ta.linreg(x_y, linReg_st1, 6)
lower = ta.linreg(y_x, linReg_st1, 6)
// Determines upper and lower bounds using linear regression.

upperInside = upper < y_x and upper > x_y
lowerInside = lower > y_x and lower < x_y
y_pos = (upper + lower) / 4

X_i1 = ta.highest(high, length_high)
Y_i1 = ta.lowest(low, length_low)

bull = x_y > upper and y_x > lower and ta.linreg(close, linReg_st, 1) > ta.linreg(close, linReg_lt, 5)
// Defines a bullish condition based on linear regression values and price bounds.

plotshape(series=(bull) ? y_pos : na, style=shape.circle, location=location.absolute, color=color.rgb(41, 3, 255, 40), size=size.tiny)

if (time >= startDate)
    if (bull)
        strategy.entry("Long", strategy.long)
    if not (bull)
        strategy.close("Long")
// Controls the strategy's execution based on the bullish condition and the start date.
Detail
https://www.fmz.com/strategy/442090
Last Modified
2024-02-19 11:15:57
