Name
季节范围均线RSI策略Seasonal-Range-Moving-Average-RSI-Strategy
Author
ChaoZhang
Strategy Description
[trans]
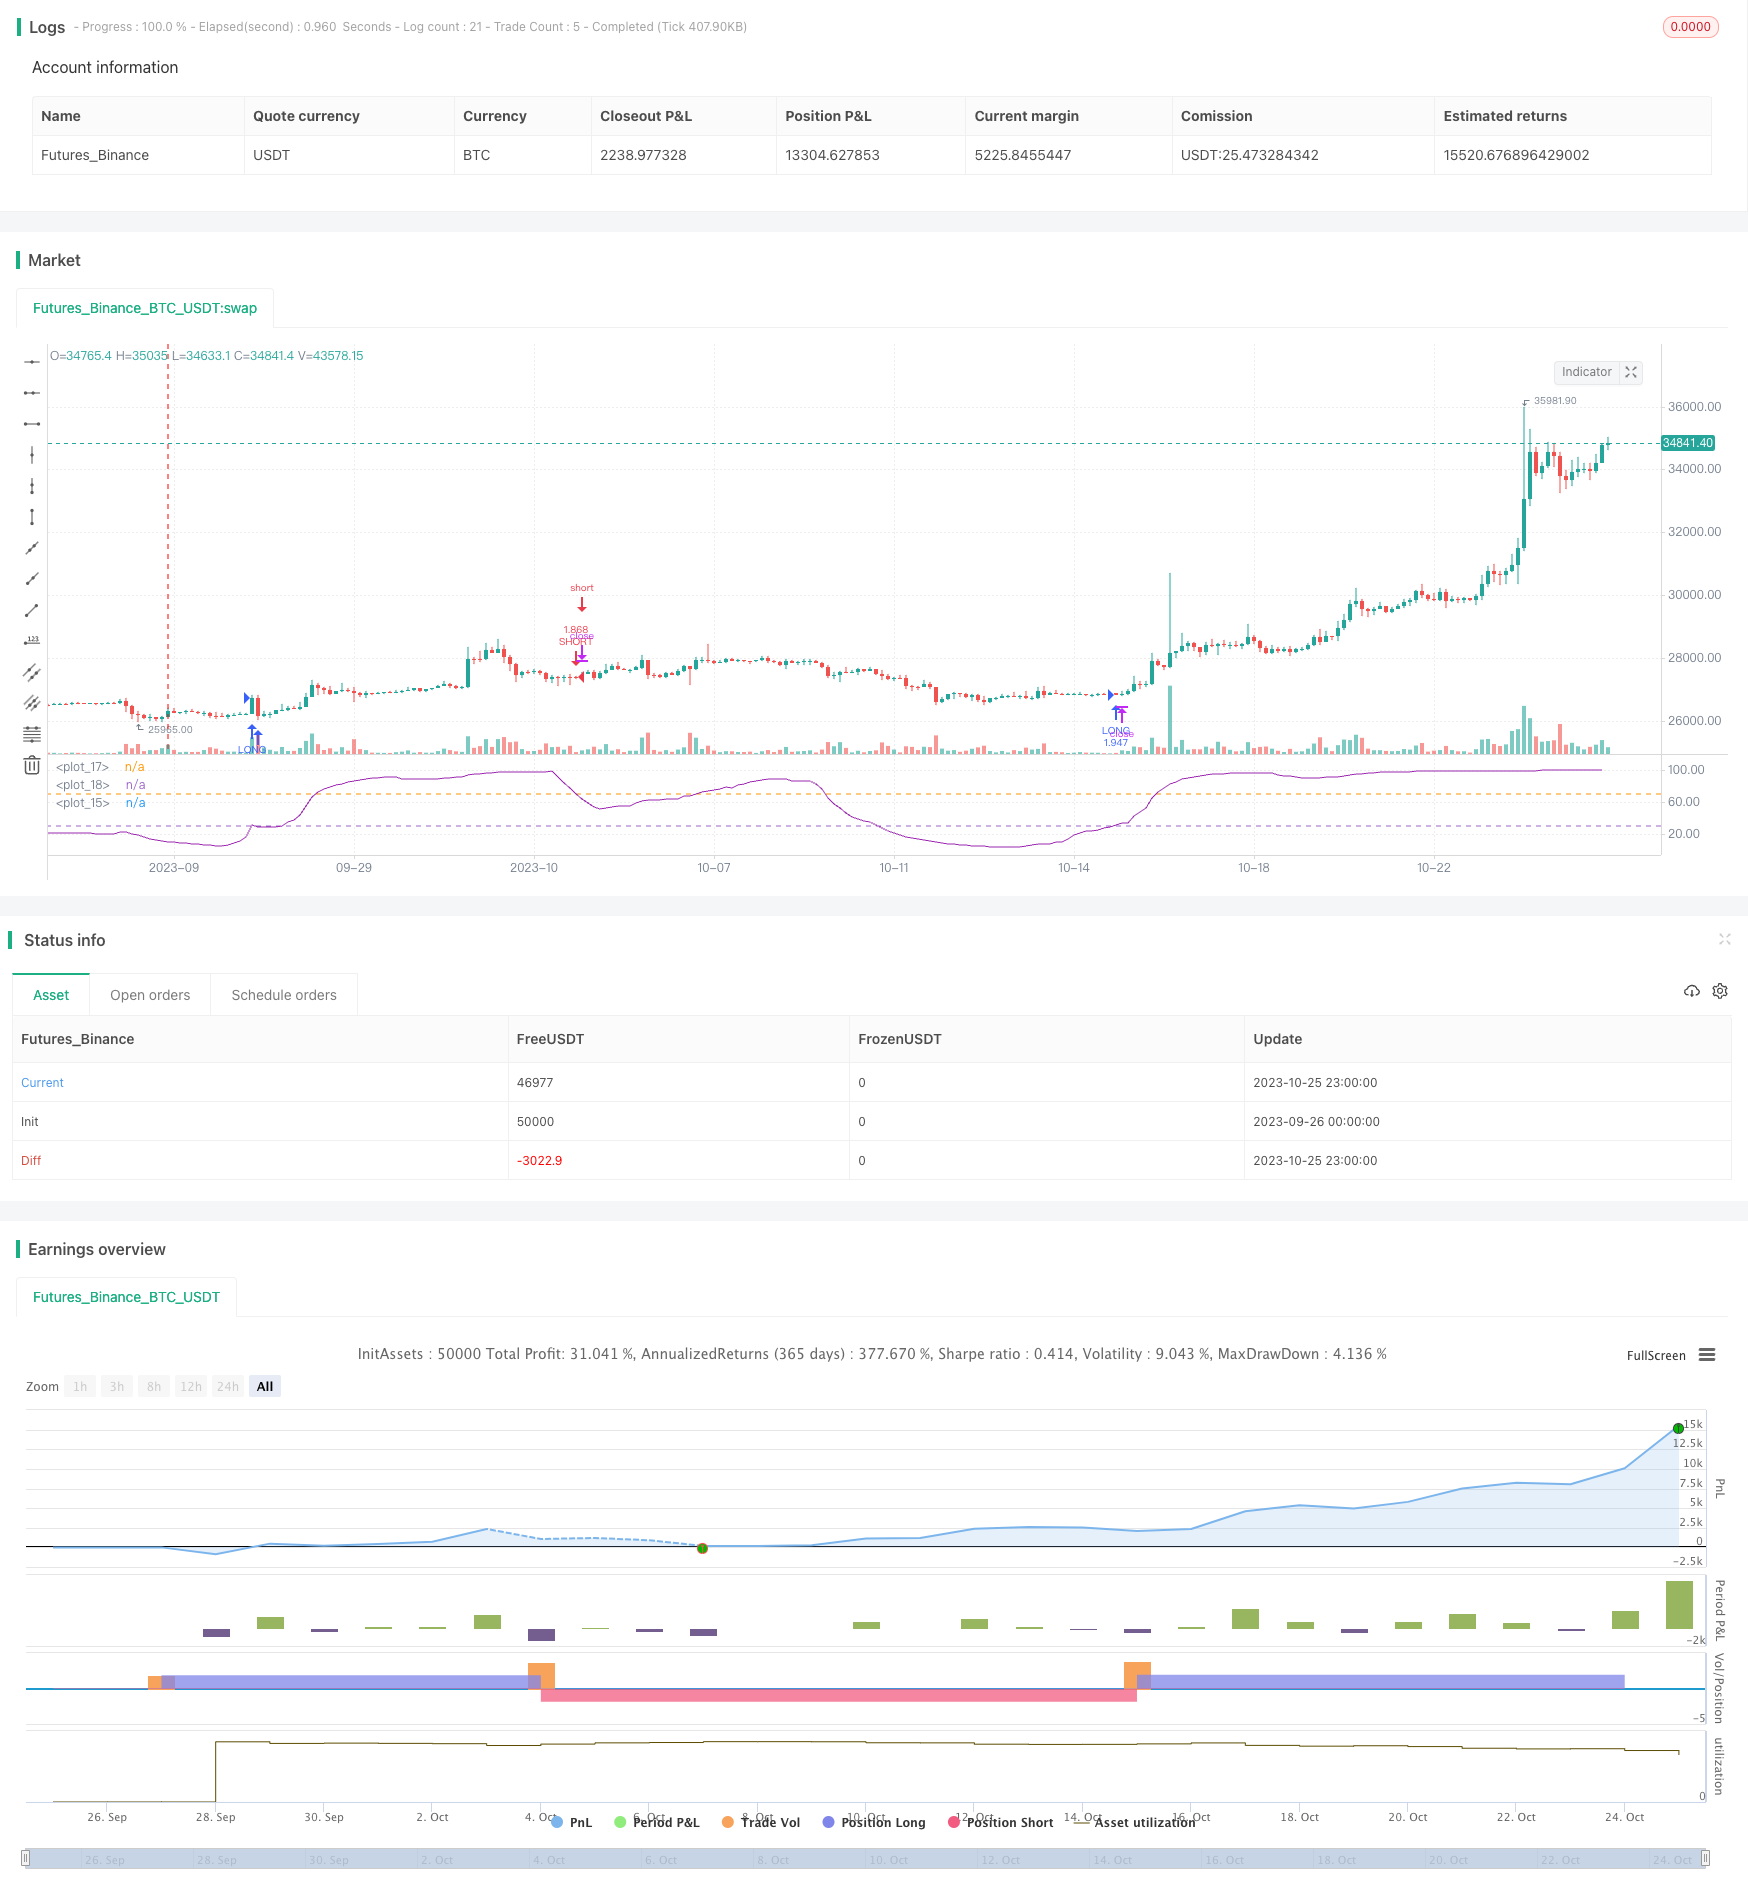
本策略结合了移动平均线和相对强弱指数(RSI)这两种技术指标,实现了对季节性周期性特征的捕捉,由此产生交易信号。该策略优点在于可以非常清晰地识别出季节性行情,但同时也存在被错误信号误导的风险。通过调整参数设置可以进一步优化,提高策略效果。
本策略首先计算一定周期n的移动平均线,以捕捉价格的中长期趋势方向。然后计算该移动平均线的RSI指标,以判断目前是否处于超买或超卖状态。RSI通过计算一定周期内涨幅与跌幅的比值,来判断目前的市场情绪。
当RSI上穿过下轨时产生买入信号,表示目前处于超卖状态,可以买入。当RSI下穿上轨时产生卖出信号,表示目前处于超买状态,可以卖出。此外,策略还设置了月份与日期的范围,只在指定月份和日期之间进行交易,以捕捉季节性特征。
- 利用移动平均线判断大趋势,RSI判断超买超卖现象,结合双重指标提高判断准确性
- 设置月份日期范围,可有效识别季节行情特征,捕捉这样的交易机会
- RSI参数设置灵活,可调整判断超买超卖的灵敏度
- 可自定义移动平均线参数,调整对大趋势判定的敏感度
-
存在被错误信号误导的风险。例如非季节性突发事件引发的趋势反转,可能导致不适当的交易信号。解决方法是调整月份日期范围,避开可能的事件风险。
-
当趋势发生转折时,移动平均线和RSI指标之间可能出现背离,导致交易信号不一致。解决方法是适当调整移动平均线参数,缩短周期以更快捕捉趋势转折。
-
预设的月份日期范围可能与实际季节行情出现的时间有偏差。解决方法是根据历史数据测试确定更准确的季节范围参数。
-
交易信号可能出现假突破的情况。解决方法是设置更宽的区间范围,避免被小幅波动误导。
-
可以引入其他辅助指标,例如震荡股票指数(STOCH)等,设置更严格的过滤条件,减少错误信号。
-
可以测试更多不同参数组合,寻找最优参数以提高策略效果。例如调整移动平均线周期,RSI的上下轨参数等。
-
可以利用步进优化方法自动搜索参数空间,寻找最优参数组合。
-
可以收集更多历史数据,利用机器学习方法训练和优化策略规则。
-
可以考虑加入止损止盈策略,优化资金管理。
本策略综合运用移动平均线和RSI指标,并加入季节因素判断,形成较为完整的趋势和超买超卖识别体系。策略优势在于可以清晰识别季节行情,把握这样的交易机会。存在一定被误导的风险,但可以通过参数调整、引入辅助指标、机器学习等方法进行优化,将策略效果提升到更高水平。总体来说,本策略提供了一个可靠、有效的季节交易框架,值得实盘测试和应用。
||
This strategy combines moving average and relative strength index (RSI), two technical indicators, to capture seasonal cyclical characteristics and generate trading signals. The advantage of this strategy is that it can identify seasonal trends very clearly, but it also has the risk of being misled by wrong signals. Further optimizations can be made by adjusting parameter settings to improve strategy performance.
The strategy first calculates the moving average of a certain period n to capture the medium-to-long term trend direction. Then it calculates the RSI indicator of the moving average to judge whether it is currently in an overbought or oversold state. RSI measures market sentiment by calculating the ratio of gains versus losses over a certain period.
When RSI crosses above the lower band, a buy signal is generated, indicating an oversold status, and a long position can be opened. When RSI crosses below the upper band, a sell signal is generated, indicating an overbought status, and a short position can be opened. In addition, the strategy also sets the range for month and date to trade only during specific months and days, in order to capture seasonal patterns.
-
Utilize moving average to determine the major trend, and RSI to judge overbought/oversold scenarios, combining dual indicators to improve accuracy
-
Setting monthly and date range can effectively identify seasonal trends and capture such trading opportunities
-
Flexible RSI parameter settings to adjust sensitivity in determining overbought/oversold levels
-
Customizable moving average parameters to adapt sensitivity in judging major trends
-
Risk of being misled by wrong signals, e.g. trend reversals triggered by non-seasonal events, may generate improper trading signals. Solution is to adjust monthly and date range to avoid potential event risks.
-
Divergence may appear between moving average and RSI when trend is reversing. Solution is to properly shorten moving average period to capture trend turns faster.
-
Preset monthly and date range may deviate from actual seasonal trends. Solution is to determine a more precise seasonal range based on historical data testing.
-
Trading signals may encounter false breakouts. Solution is to set wider range to avoid being misled by minor fluctuations.
-
Introduce other auxiliary indicators, e.g. Stochastic Oscillator, to set more stringent filtering conditions and reduce wrong signals.
-
Test more different parameter combinations to find optimum parameters and improve strategy performance, e.g. adjust moving average period, RSI bands etc.
-
Utilize parameter optimization methods to automatically search parameter space for optimal parameter sets.
-
Collect more historical data and utilize machine learning to train and optimize strategy rules.
-
Consider adding stop loss/take profit strategies to optimize money management.
This strategy combines moving average and RSI, with the addition of seasonal judgments, to form a relatively complete system for trend and overbought/oversold identification. The advantage lies in its ability to clearly recognize seasonal patterns and capitalize on such trading opportunities. There are certain risks of being misled, but optimizations can be made via parameter tuning, introducing auxiliary indicators, machine learning etc. to elevate strategy performance. Overall, this strategy provides a reliable and effective seasonal trading framework that is worth live testing and application.
[/trans]
Strategy Arguments
| Argument | Default | Description |
|---|---|---|
| v_input_1 | 15 | Length of MA |
| v_input_2 | 14 | Length |
| v_input_3 | 70 | Upper Band for RSI |
| v_input_4 | 30 | Lower Band for RSI |
| v_input_5 | true | monthfrom |
| v_input_6 | 12 | monthuntil |
| v_input_7 | true | dayfrom |
| v_input_8 | 31 | dayuntil |
Source (PineScript)
/*backtest
start: 2023-09-26 00:00:00
end: 2023-10-26 00:00:00
period: 3h
basePeriod: 15m
exchanges: [{"eid":"Futures_Binance","currency":"BTC_USDT"}]
*/

//@version=2
strategy(title = " RSI of MA Strategy ",shorttitle="MARSI Strategy",default_qty_type = strategy.percent_of_equity, default_qty_value = 100,commission_type=strategy.commission.percent,commission_value=0.1,initial_capital=1)


lengthofma = input(15,minval=1,title="Length of MA")
len = input(14, minval=1, title="Length")
upperband = input(70,minval=1,title='Upper Band for RSI')
lowerband = input(30,minval=1,title="Lower Band for RSI")

src=sma(close,lengthofma)
up = rma(max(change(src), 0), len)
down = rma(-min(change(src), 0), len)
rsi = down == 0 ? 100 : up == 0 ? 0 : 100 - (100 / (1 + up / down))
plot(rsi, color=purple)

band1 = hline(upperband)
band0 = hline(lowerband)
fill(band1, band0, color=purple, transp=90)


longCond =  crossover(rsi,lowerband)

shortCond =  crossunder(rsi,upperband)


monthfrom =input(1)
monthuntil =input(12)
dayfrom=input(1)
dayuntil=input(31)

if (  longCond )
    strategy.entry("LONG", strategy.long, stop=close, oca_name="TREND",  comment="LONG")

else
    strategy.cancel(id="LONG")


if ( shortCond )

    strategy.entry("SHORT", strategy.short,stop=close, oca_name="TREND",  comment="SHORT")
else
    strategy.cancel(id="SHORT")
Detail
https://www.fmz.com/strategy/430365
Last Modified
2023-10-27 16:04:21
